SIT717 Enterprise Business Intelligence: Breast Cancer Data Analysis
VerifiedAdded on 2022/11/10
|26
|2850
|148
Report
AI Summary
This technical report presents a comprehensive analysis of breast cancer data obtained from the University of Wisconsin Hospital, focusing on the classification of breast cancer cases as either benign or malignant. The study employs various data mining and machine learning techniques, including regression analysis and several classification algorithms such as Naive-Bayes, Bayes network learning with K2 search, LAGDHillClimber search, Simulated Annealing, TabuSearch, and TAN search. The dataset, originally compiled by Dr. William H. Wolberg, comprises ten variables related to breast characteristics and a class variable indicating the clinical diagnosis. The report details the data preprocessing steps, including handling missing values and converting the data into a suitable format for analysis in Weka. The results of each classification method are evaluated and compared based on metrics like confusion matrices and error rates, with the Tabu search algorithm demonstrating the highest accuracy. The report includes a detailed interpretation of the models and concludes with a discussion of the findings and their implications for breast cancer diagnosis. The student has created this solution to assist other students on Desklib.

Running head: CLASSIFICATION OF BREAST CANCER DATA OF WISCONSIN
HOSPITAL
CLASSIFICATION OF BREAST CANCER DATA OF WISCONSIN HOSPITAL
Name of the Student
Name of the University
Author Note
HOSPITAL
CLASSIFICATION OF BREAST CANCER DATA OF WISCONSIN HOSPITAL
Name of the Student
Name of the University
Author Note
Paraphrase This Document
Need a fresh take? Get an instant paraphrase of this document with our AI Paraphraser
1CLASSIFICATION OF BREAST CANCER DATA OF WISCONSIN HOSPITAL
Abstract:
Breast cancers are common to many mid-aged to older women throughout every
country. After development of breast cancer it becomes very much difficult to cure cancer if
not found in early stage or sometimes it’s not always possible to completely cure the disease.
Hence, finding symptoms relating to probable breast cancer can be very much helpful for
taking necessary precautions or actions at an early stage. Hence, in this research an original
breast cancer data is collected from University of Wisconsin hospital provided by Dr.
Wolberg based on his clinical cases from year 1989 to 1991. Using the data classification
techniques in machine learning is performed along with regression analysis to predict the
class of breasts differentiated in either most probable to cancer or normal breast with no
cancer symptom. Then the results are compared to the actual results as clinically analysed
and classified by Dr. Wolberg in Wisconsin hospital.
2CLASSIFICATION OF BREAST CANCER DATA OF WISCONSIN HOSPITAL
Table of Contents
Introduction:...............................................................................................................................3
Dataset summary and pre-processing:.......................................................................................3
Data mining techniques:.............................................................................................................5
Naïve-Bayes classification:....................................................................................................5
K2 search:...............................................................................................................................6
LAGDHillClimber search:.....................................................................................................6
Simulated Annealing search:..................................................................................................6
TAN search:...........................................................................................................................7
TabuSearch algorithm:...........................................................................................................7
Results, Evaluation and demonstration:.....................................................................................7
Regression output:..................................................................................................................8
Naïve-bayes classification:.....................................................................................................9
Bayes network learning classification using K2 search algorithm:.....................................12
Bayes Network learning using LAGD Hill Climbing search algorithm:.............................14
Bayes Network learning using Simulated Annealing search algorithm:.............................16
Bayes Network learning classification using Tabu search algorithm:.................................18
Bayes Network learning classification using TAN search algorithm:.................................20
Models’ interpretation:.........................................................................................................22
Conclusion:..............................................................................................................................24
References:...............................................................................................................................25
⊘ This is a preview!⊘
Do you want full access?
Subscribe today to unlock all pages.
Trusted by 1+ million students worldwide
3CLASSIFICATION OF BREAST CANCER DATA OF WISCONSIN HOSPITAL
Introduction:
In this particular report the different classification algorithms are used to classify the
class of breast cancer as by benign or malignant by using the breast cancer data obtained from
the UCI machine learning website. The dataset was originally created by Dr. William H.
Wolberg, a physician of University of Wisconsin Hospitals located in Madison, Wisconsin,
USA. Wolberg created the dataset based on his medical practice time with patients in
Wisconsin Hospitals during the period from January 1989 to November 1991. The different
properties of breasts examined during the period along with Wolberg’s clinical classification
of the breasts as acute cancerous or normal are given in the last column of the dataset
(Mlr.cs.umass.edu 2019). The dataset is copied from the website, pre-processed and loaded in
Weka tool for data analysis. The primary motive is to train a model based on the provided
data which can predict the acuteness of breast cancer based on physical properties of breast
and can classify the breast as either benign or malignant. Different searching algorithms for
classifications are used with the data and the results of different methods are compared to
choose the best method based on the absolute error in model, confusion matrix and other
properties of the output as discussed in later sections. Also, brief introduction about the steps
followed while applying each algorithm of classification and regression are given in the later
sections along with discussion of results.
Dataset summary and pre-processing:
The collected breast cancer data has total of 10 variables excluding the class variable
which has only two values 2 and 4 representing benign and malignant status of the breasts
respectively as examined by Wolberg during his practice duration to the real patients
admitted in Wisconsin hospital. Originally the entire dataset containing 699 instances
grouped based on the period of examination from January 1989 to November 1991. The 10
variables of the dataset excluding the class variable are sample number given as the patient id
Paraphrase This Document
Need a fresh take? Get an instant paraphrase of this document with our AI Paraphraser
4CLASSIFICATION OF BREAST CANCER DATA OF WISCONSIN HOSPITAL
number at time of collection, clump thickness given in a scale as measured by Wolberg, cell
size uniformity, shape uniformity of cell, Marginal Adhesion, cell size of Single Epithelial
Cell, Bare Nuclei, Bland Chromatin, Normal Nucleoli and Mitoses. All the variable are scales
in a rating 1 to 10 by Dr. Wolberg based on his clinical measurement to the patients in his
practicing period. The class variable has 458 ‘benign’ cases and 241 ‘malignant’ cases which
is 34.5% of the total data points. Also, there exists all total of 16 missing values the total data
and all are in the variable Bare Nuclei variable. All the variables in the dataset are numeric
integers.
Now, the data set containing value for all the groups in time frame 1989 to 1991 are copied in
a text file and converted to csv file in order to load the data in Weka. Now, after loading the
cancer data csv file in Weka it is converted to .arff format which is pre-processed with
different filters. In the first filter the variable sample number is removed as it has no
contribution in data analysis because there exist no relation between the sample number and
the rest variables. Now, the missing values are generally replaced by the mean of all the
values in column, however, in this particular case this method is not followed as mean of rest
of the values of Bare Nuclei variable gives fractional number, but the Bare Nuclei is
restricted to be integer in the scale of 1 to 10. Hence, for minimizing the total error associated
with missing value replacement, the missing values of Bare Nuclei is replaced with rounded
average of its previous and later value. As no values of the given dataset are removed during
filtering hence the actual sample size on which data analysis is performed is same as total
data points in source data which is 699. The modified data with removed sample number and
replaced missing values is saved as .arff format for data analysis. Now, regression is
performed at first as all the variable are in numeric form and then the class variable is
converted to nominal class for applying different classification algorithms in Weka.
5CLASSIFICATION OF BREAST CANCER DATA OF WISCONSIN HOSPITAL
Data mining techniques:
As discussed earlier the primary motive of this paper is to predict the class of breast
cancer based on other variables and then to classify instances of class variable using different
classification algorithms and the results through classification is compared with actual status
of the breasts made by Wolberg at the time of his clinical practice. No primitive specific
information is known about the relationship between the class variable and its predictors and
hence linear least square regression is applied for building the prediction model in Weka as,
linear model is the most conventional regression model and nearly predicts data accurately if
sufficient correlation between the variables exists. Now, for classification that is segmenting
each instance of class variable into either 2 or 4 (benign or malignant) a series of algorithms
and searching techniques namely Naïve-Bayes, Bayes network learning using K2 search,
Bayes network learning using LAGDHillClimber search, Bayes network learning using
Simulated Annealing, Bayes network learning using TabuSearch, Bayes network learning
using TAN are applied which is discussed below.
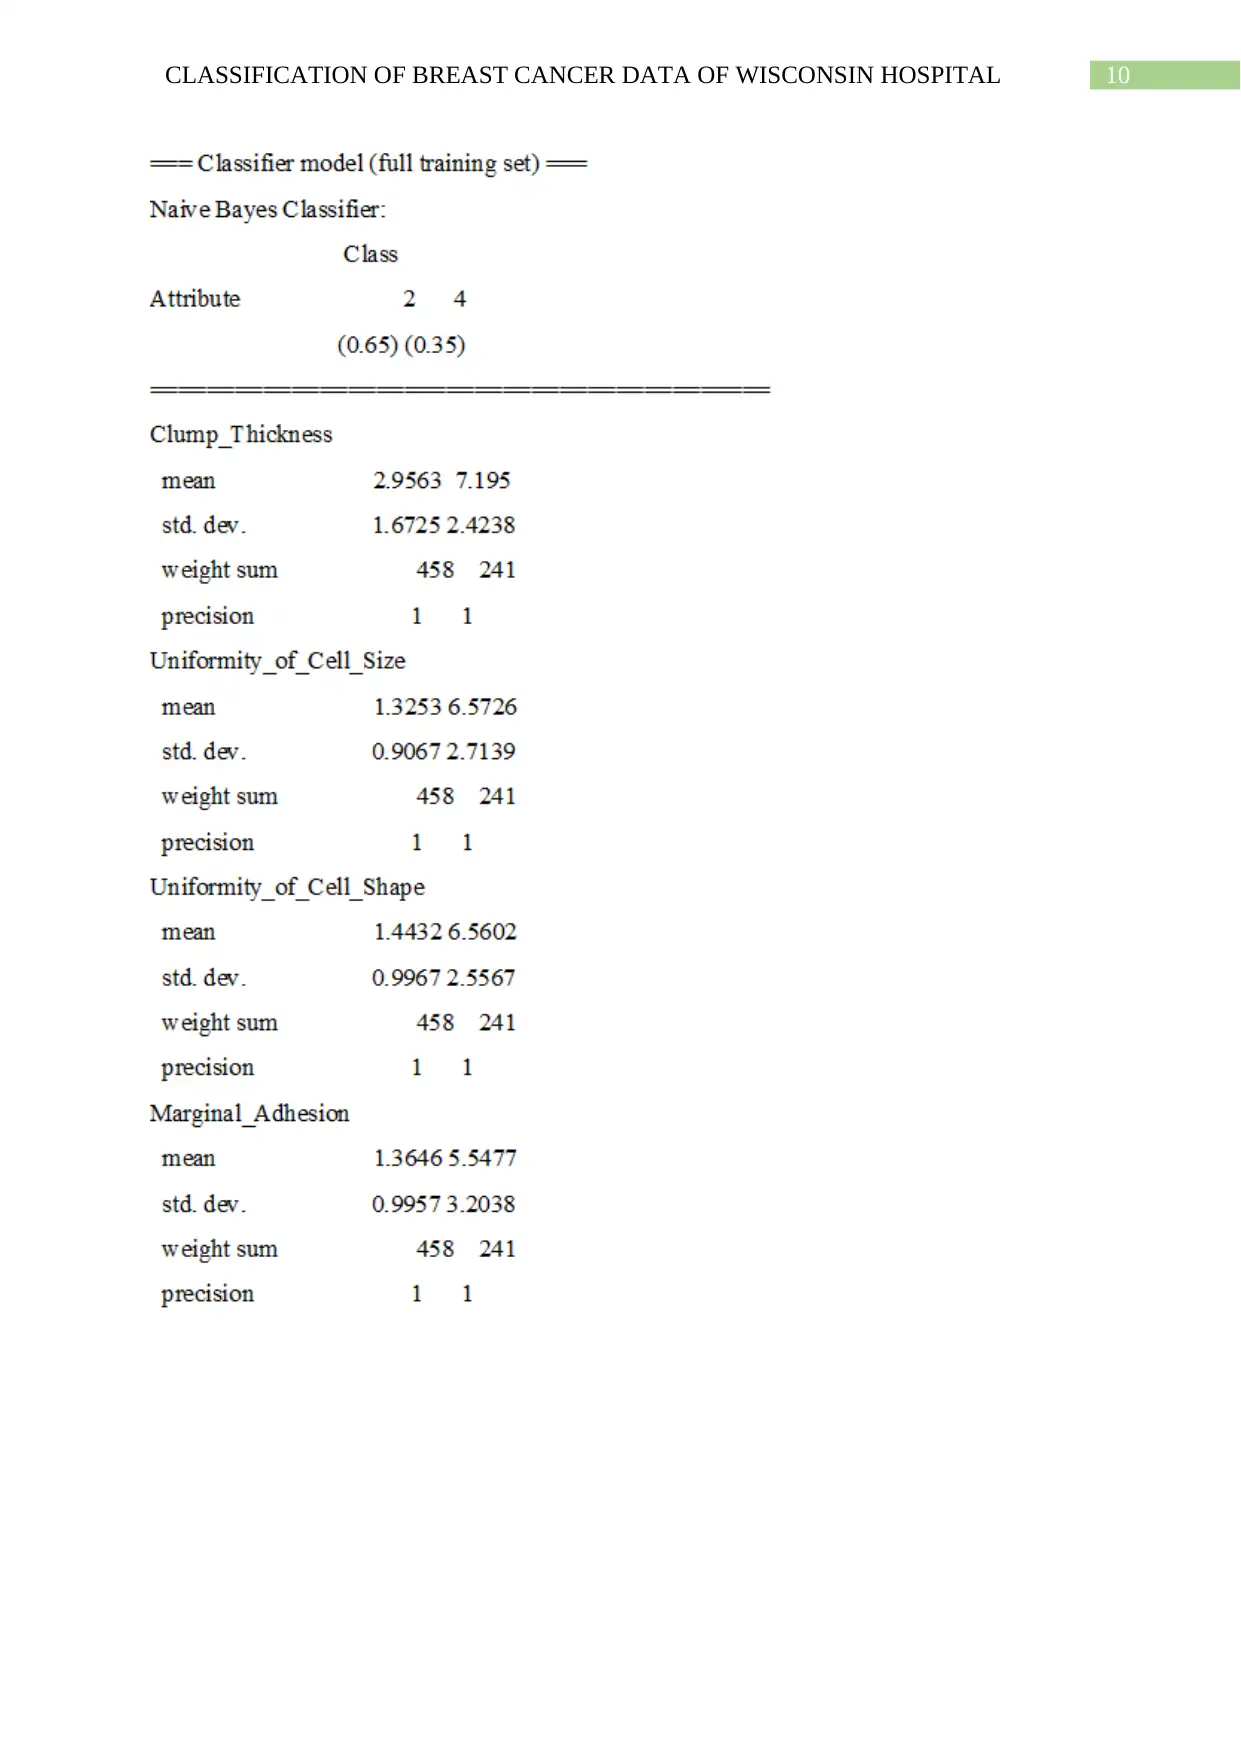
Naïve-Bayes classification:
The Naïve-Bayes is basically a machine learning model defined by Bayes theorem of
probability. The Bayes theorem of probability is given by
P ( A |B )= P ( B|A ) P ( A )
P ( B )
Where A and B are two events and A|B is the event of occurrence of A given B has occurred
already. It is assumed here that the predictors are independent or occurrence of one predictor
does not affect occurrence of other. Now, in classifier the formula is modified in the
following way,
P ( y|X ) = P ( X | y ) P ( y )
P ( X )
Data mining techniques:
As discussed earlier the primary motive of this paper is to predict the class of breast
cancer based on other variables and then to classify instances of class variable using different
classification algorithms and the results through classification is compared with actual status
of the breasts made by Wolberg at the time of his clinical practice. No primitive specific
information is known about the relationship between the class variable and its predictors and
hence linear least square regression is applied for building the prediction model in Weka as,
linear model is the most conventional regression model and nearly predicts data accurately if
sufficient correlation between the variables exists. Now, for classification that is segmenting
each instance of class variable into either 2 or 4 (benign or malignant) a series of algorithms
and searching techniques namely Naïve-Bayes, Bayes network learning using K2 search,
Bayes network learning using LAGDHillClimber search, Bayes network learning using
Simulated Annealing, Bayes network learning using TabuSearch, Bayes network learning
using TAN are applied which is discussed below.
Naïve-Bayes classification:
The Naïve-Bayes is basically a machine learning model defined by Bayes theorem of
probability. The Bayes theorem of probability is given by
P ( A |B )= P ( B|A ) P ( A )
P ( B )
Where A and B are two events and A|B is the event of occurrence of A given B has occurred
already. It is assumed here that the predictors are independent or occurrence of one predictor
does not affect occurrence of other. Now, in classifier the formula is modified in the
following way,
P ( y|X ) = P ( X | y ) P ( y )
P ( X )
⊘ This is a preview!⊘
Do you want full access?
Subscribe today to unlock all pages.
Trusted by 1+ million students worldwide
6CLASSIFICATION OF BREAST CANCER DATA OF WISCONSIN HOSPITAL
Here, the variable y is the class variable and X is the predictors or features x1,x2,…xn. The
class variable is generally of binary class i.e. assumes two values, however, the class can be
multinomial class also (Zhou et al. 2015). Based on the type of class variable naïve Bayes
classification can be of three types which are Multinomial Naive Bayes (class has more than
two values), Bernoulli Naive Bayes (class is Binary variable) and Gaussian naïve Bayes
(class is continuous variable). In our case of cancer data the Bernoulli Naive Bayes
classification is applied by Weka as the class has only two values 2 and 4.
K2 search:
This is a graph searching algorithm based on hill climbing approach where the arcs are added
with fixed ordering of the variables. The initial variable ordering can be taken as random or
conventionally the ordering of data variable is used in Naïve Bayes network (Yu et al. 2019).
However, if the ordering of variables are taken by the order of data then the class variable is
placed as first in the order.
LAGDHillClimber search:
In this approach the same hill climbing method is followed as K2 with looking forward to a
finite set from the sets with the best scores. This approach is invented by Manuel Neubach
and the quantity of steps to look forward and the number of steps that are to be considered for
looking ahead can be changed manually for improvised results (Ramírez, Mora and Quintero
2019).
Simulated Annealing search:
In this algorithm a candidate graph Bs’ is generated from the current graph Bs upon addition
and/or deletion of nodes. The candidate graph is only accepted if it is better than the current
graph, otherwise, the candidate is rejected based on the probability estimate given by,
Paraphrase This Document
Need a fresh take? Get an instant paraphrase of this document with our AI Paraphraser
7CLASSIFICATION OF BREAST CANCER DATA OF WISCONSIN HOSPITAL
P(rejection) = 1 – exp(ti*(Q(Bs’,D)-Q(Bs,D))), here, Q() = current or candidate graph based
on parameter and ti = temperature at ith iteration (Jia, Duan and Shi 2016). The temperature
minutely decreases in each iteration.
TAN search:
This is a tree search algorithm known as Tree Augmented Naïve Bayes, where the tree is
formed by calculation of the spanning tree with most weight with the help of Chow and Liu
algorithm (Wu 2018). There is no controllable input attributes in this search algorithm as
provided in Weka.
TabuSearch algorithm:
In this technique hill climbing is performed until a local maximum or minimum is found and
then the search switches to the point is lowest worst point in the current neighbourhood. The
values obtained in each step or at each local optimum are stored in Tabu-list. In this case also
network in each iteration is generated by addition and/or deletion of nodes (Poppenborg and
Knust 2016). The number of steps or iteration and the length of Tabu-list can be manually
controlled for improvised results.
Results, Evaluation and demonstration:
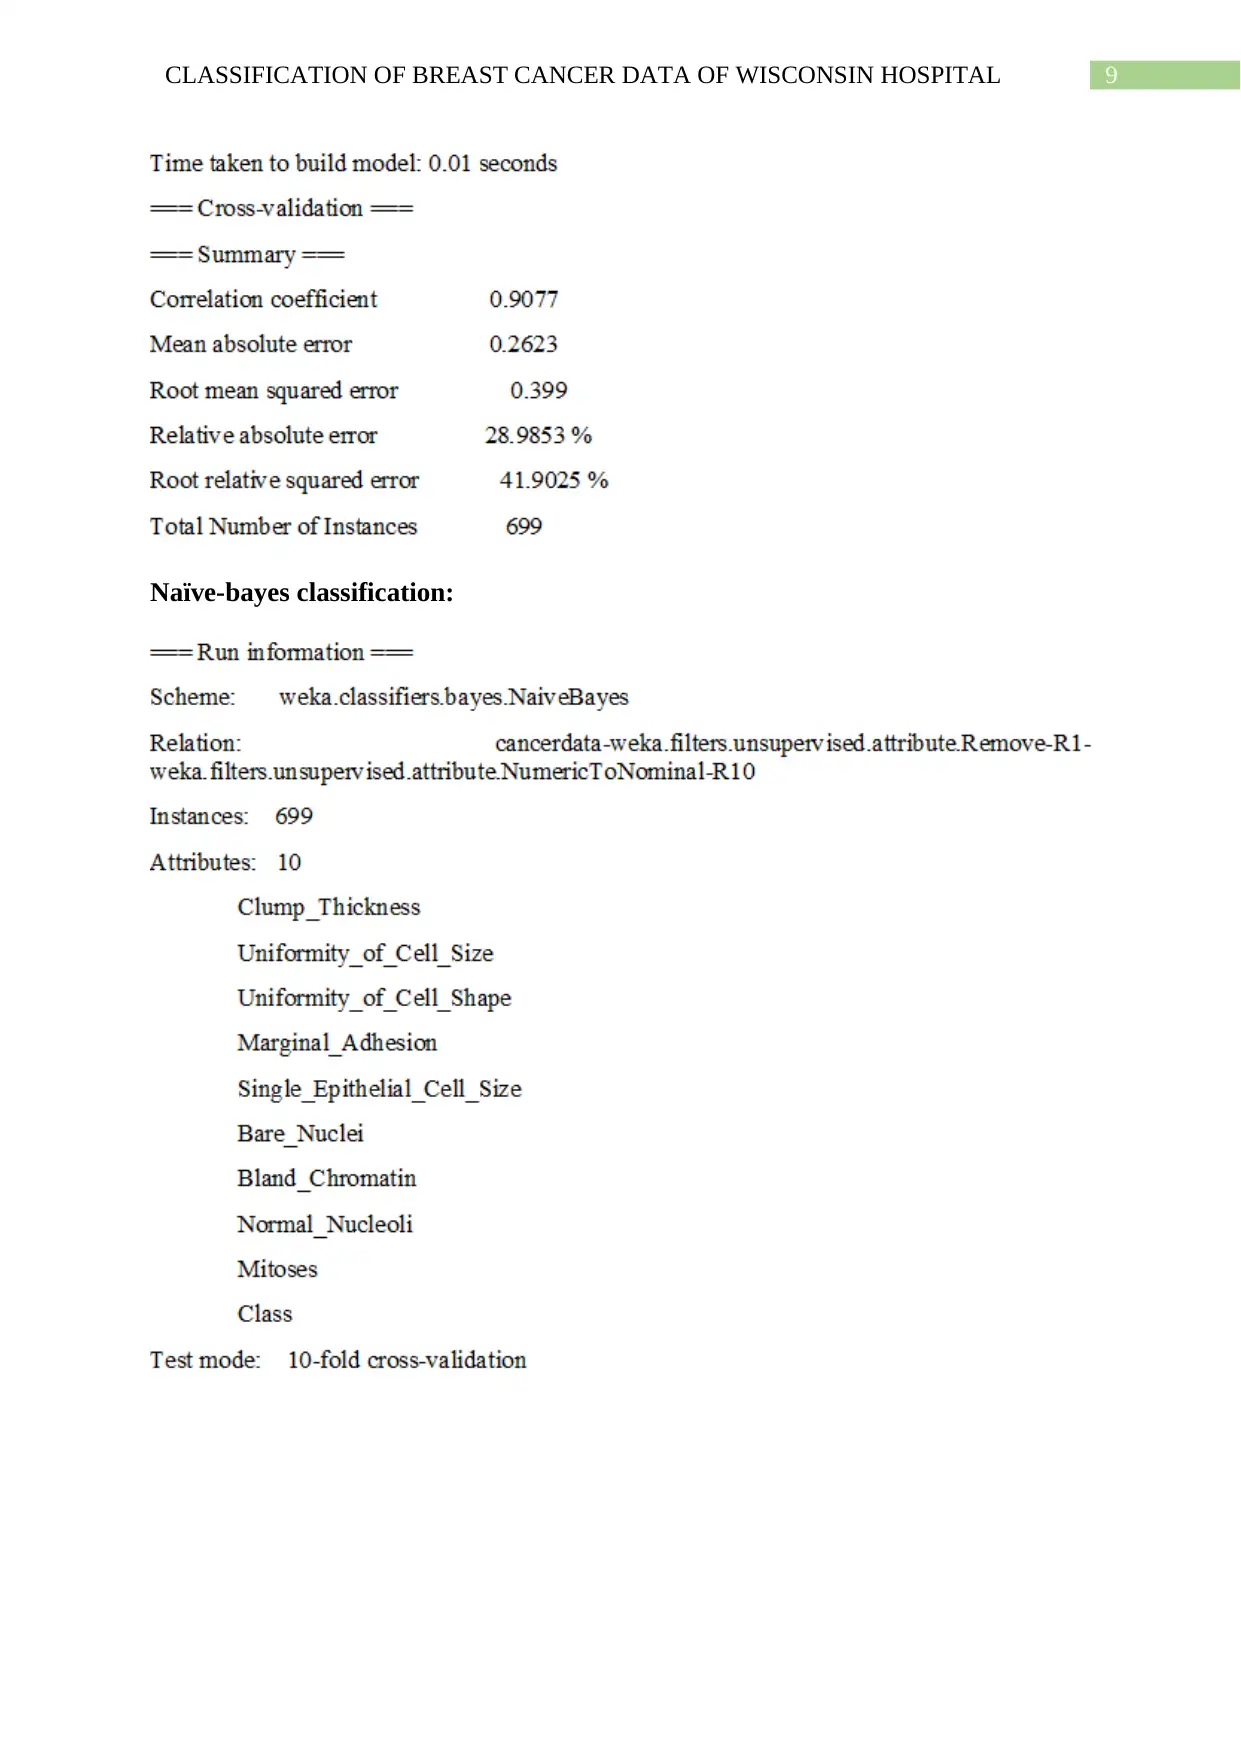
In every data analysis technique from regression to classification algorithms, cross
validation is used with 10 folds or in other words the total data is subdivided in k=10
approximately equal parts and one fold is removed at a time to make the training set. Then on
each training set the data analysis algorithm is applied and the best result (i.e. the result with
minimum error) is displayed as the output of data analysis.
P(rejection) = 1 – exp(ti*(Q(Bs’,D)-Q(Bs,D))), here, Q() = current or candidate graph based
on parameter and ti = temperature at ith iteration (Jia, Duan and Shi 2016). The temperature
minutely decreases in each iteration.
TAN search:
This is a tree search algorithm known as Tree Augmented Naïve Bayes, where the tree is
formed by calculation of the spanning tree with most weight with the help of Chow and Liu
algorithm (Wu 2018). There is no controllable input attributes in this search algorithm as
provided in Weka.
TabuSearch algorithm:
In this technique hill climbing is performed until a local maximum or minimum is found and
then the search switches to the point is lowest worst point in the current neighbourhood. The
values obtained in each step or at each local optimum are stored in Tabu-list. In this case also
network in each iteration is generated by addition and/or deletion of nodes (Poppenborg and
Knust 2016). The number of steps or iteration and the length of Tabu-list can be manually
controlled for improvised results.
Results, Evaluation and demonstration:
In every data analysis technique from regression to classification algorithms, cross
validation is used with 10 folds or in other words the total data is subdivided in k=10
approximately equal parts and one fold is removed at a time to make the training set. Then on
each training set the data analysis algorithm is applied and the best result (i.e. the result with
minimum error) is displayed as the output of data analysis.
8CLASSIFICATION OF BREAST CANCER DATA OF WISCONSIN HOSPITAL
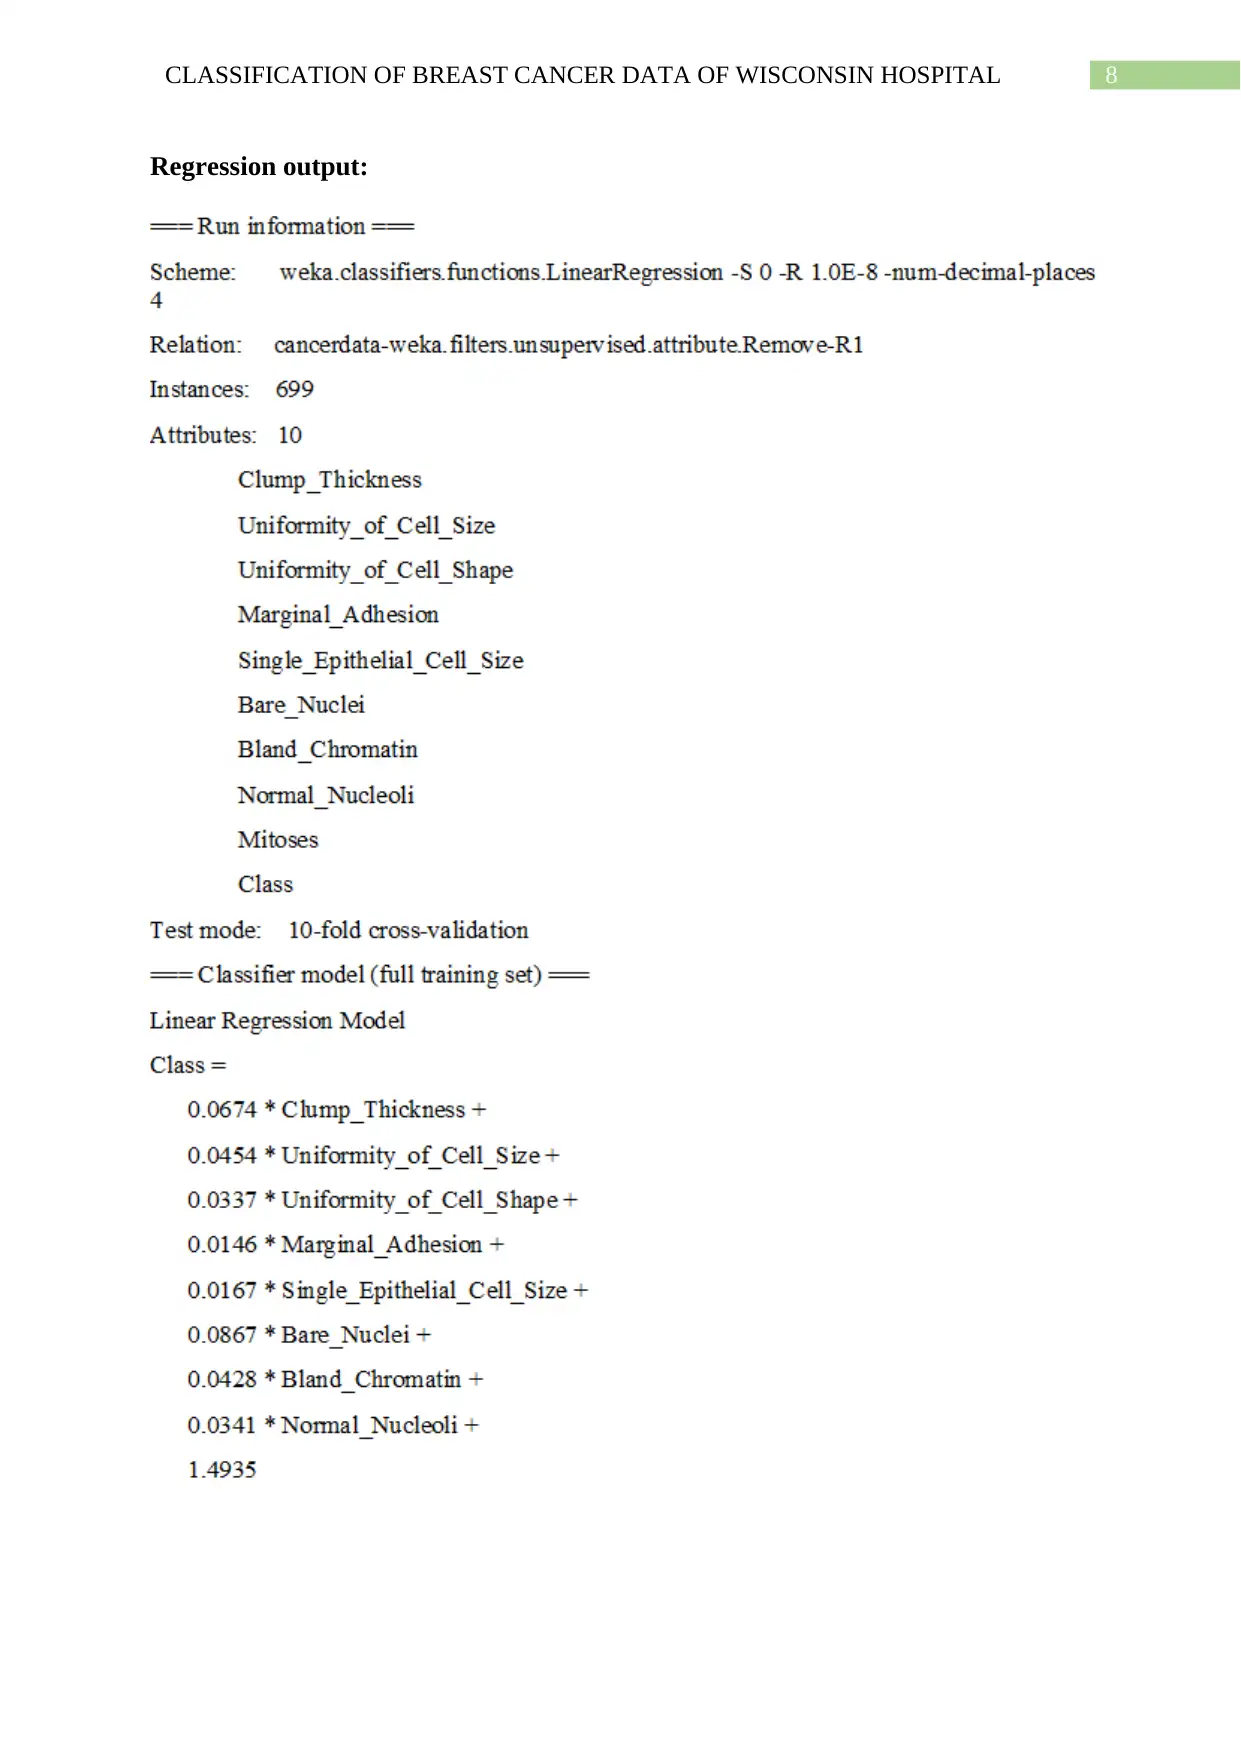
Regression output:
Regression output:
⊘ This is a preview!⊘
Do you want full access?
Subscribe today to unlock all pages.
Trusted by 1+ million students worldwide
9CLASSIFICATION OF BREAST CANCER DATA OF WISCONSIN HOSPITAL
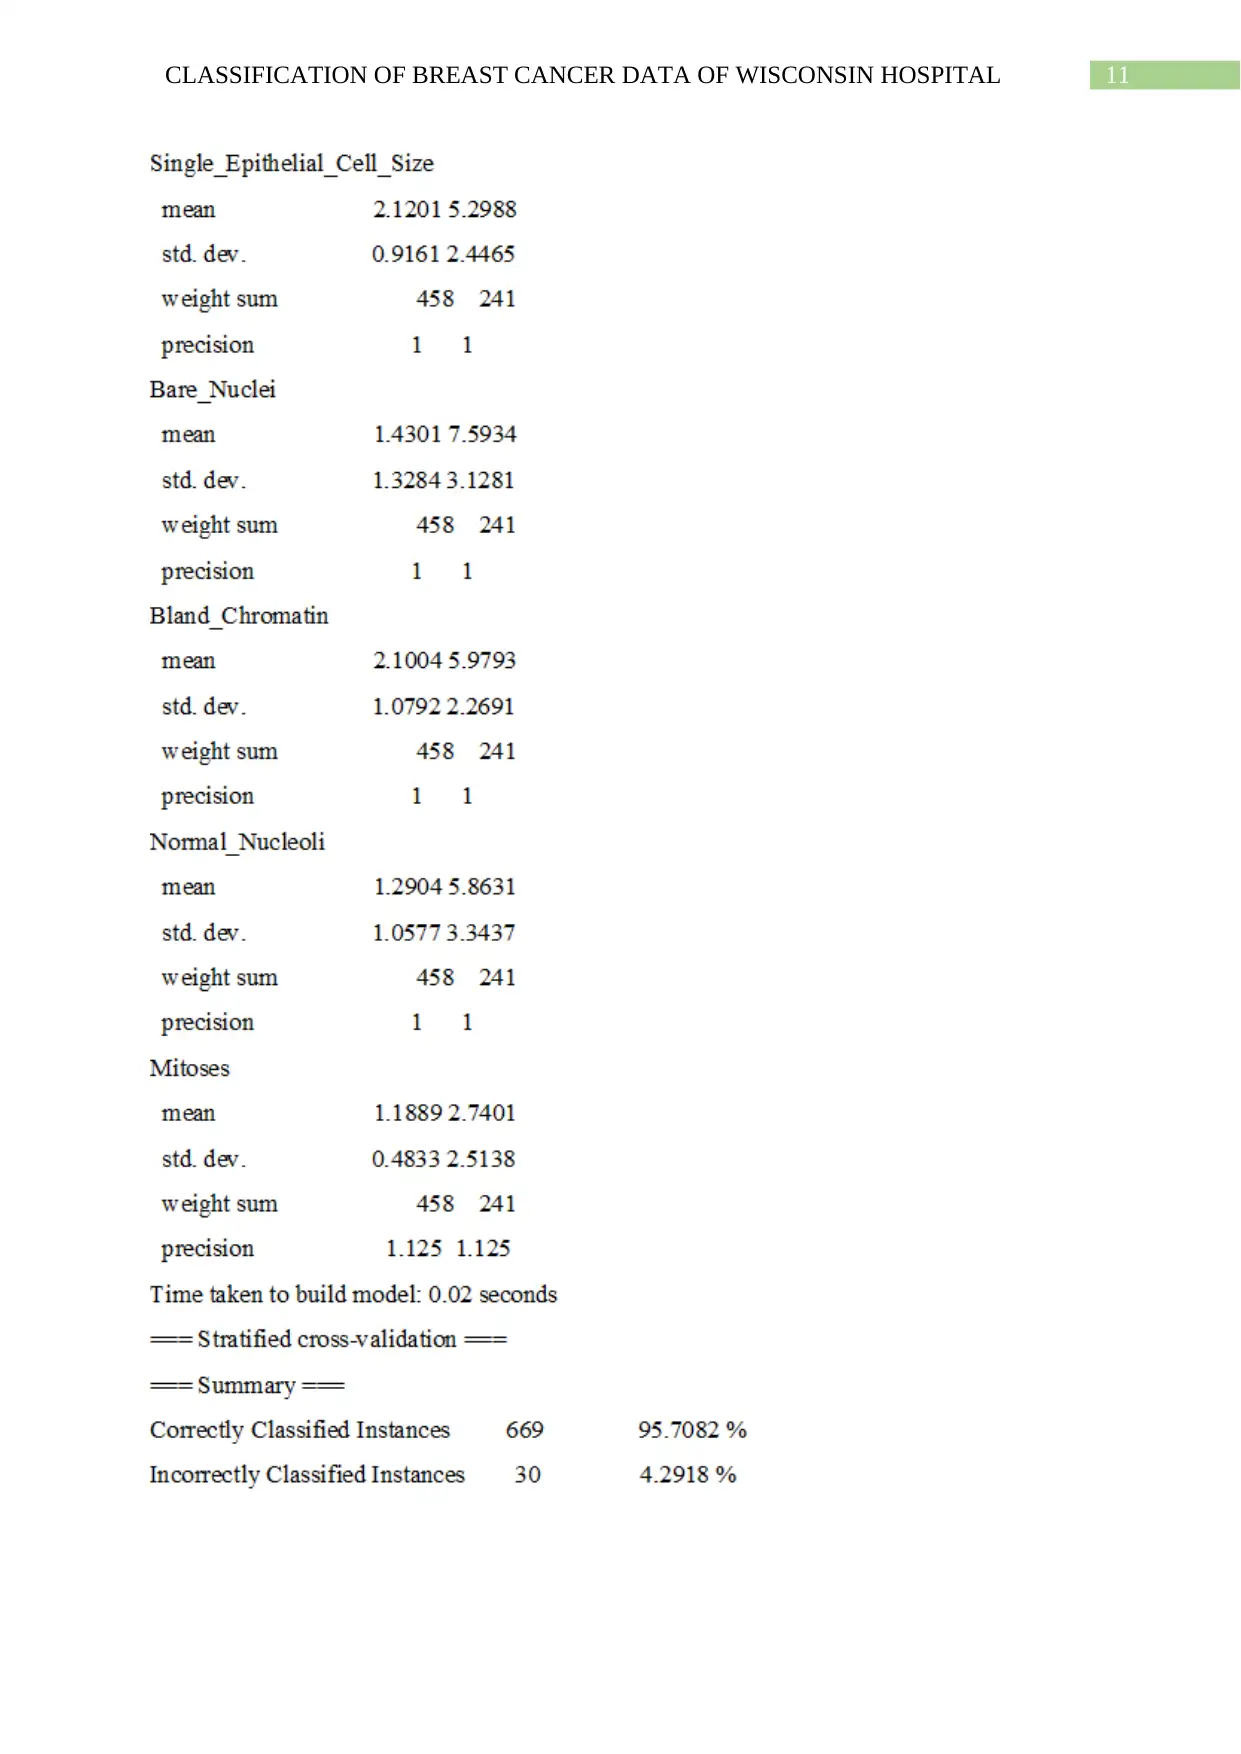
Naïve-bayes classification:
Naïve-bayes classification:
Paraphrase This Document
Need a fresh take? Get an instant paraphrase of this document with our AI Paraphraser
10CLASSIFICATION OF BREAST CANCER DATA OF WISCONSIN HOSPITAL
11CLASSIFICATION OF BREAST CANCER DATA OF WISCONSIN HOSPITAL
⊘ This is a preview!⊘
Do you want full access?
Subscribe today to unlock all pages.
Trusted by 1+ million students worldwide
1 out of 26

Your All-in-One AI-Powered Toolkit for Academic Success.
+13062052269
info@desklib.com
Available 24*7 on WhatsApp / Email
![[object Object]](/_next/static/media/star-bottom.7253800d.svg)
Unlock your academic potential
Copyright © 2020–2026 A2Z Services. All Rights Reserved. Developed and managed by ZUCOL.