Epidemiology for Health and Medical Sciences II Assignment 2 Analysis
VerifiedAdded on 2022/10/19
|15
|2438
|408
Homework Assignment
AI Summary
This assignment analyzes a randomized clinical trial investigating a breastfeeding support intervention in Lebanon. The solution presents a detailed statistical analysis using data from the study, employing methods like Chi-square and t-tests to assess the relationship between the intervention and breastfeeding outcomes at six months. The analysis includes hand calculations, Excel outputs, and STATA outputs to demonstrate the statistical tests, including the null and alternate hypotheses, degrees of freedom, and p-values. The assignment explores the association between treatment groups and breastfeeding outcomes, as well as the impact of delivery mode on breastfeeding duration. The findings indicate no significant association between the intervention and breastfeeding outcomes or the delivery mode and breastfeeding outcomes, which is a critical aspect of the study's conclusions.

Epidemiology for Health and Medical Sciences II
1
1
Paraphrase This Document
Need a fresh take? Get an instant paraphrase of this document with our AI Paraphraser
Answer 1:
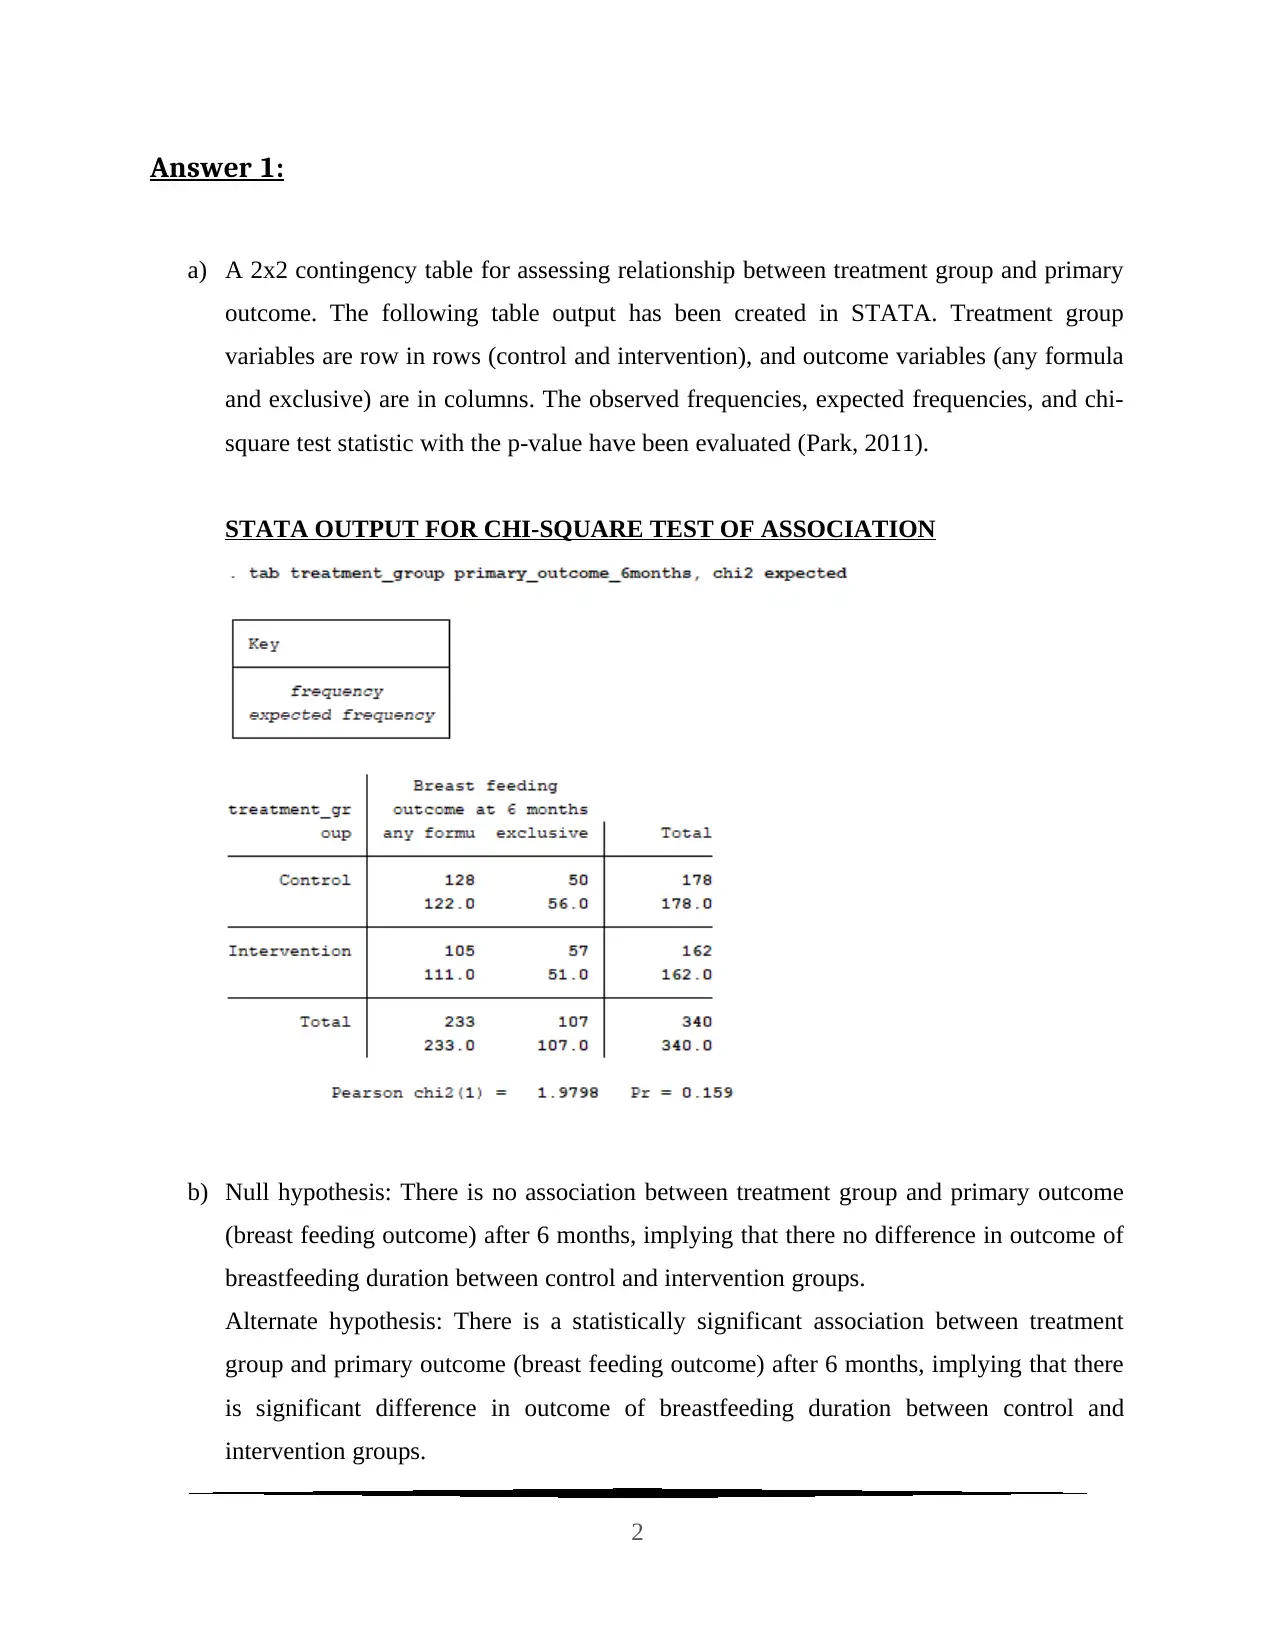
a) A 2x2 contingency table for assessing relationship between treatment group and primary
outcome. The following table output has been created in STATA. Treatment group
variables are row in rows (control and intervention), and outcome variables (any formula
and exclusive) are in columns. The observed frequencies, expected frequencies, and chi-
square test statistic with the p-value have been evaluated (Park, 2011).
STATA OUTPUT FOR CHI-SQUARE TEST OF ASSOCIATION
b) Null hypothesis: There is no association between treatment group and primary outcome
(breast feeding outcome) after 6 months, implying that there no difference in outcome of
breastfeeding duration between control and intervention groups.
Alternate hypothesis: There is a statistically significant association between treatment
group and primary outcome (breast feeding outcome) after 6 months, implying that there
is significant difference in outcome of breastfeeding duration between control and
intervention groups.
2
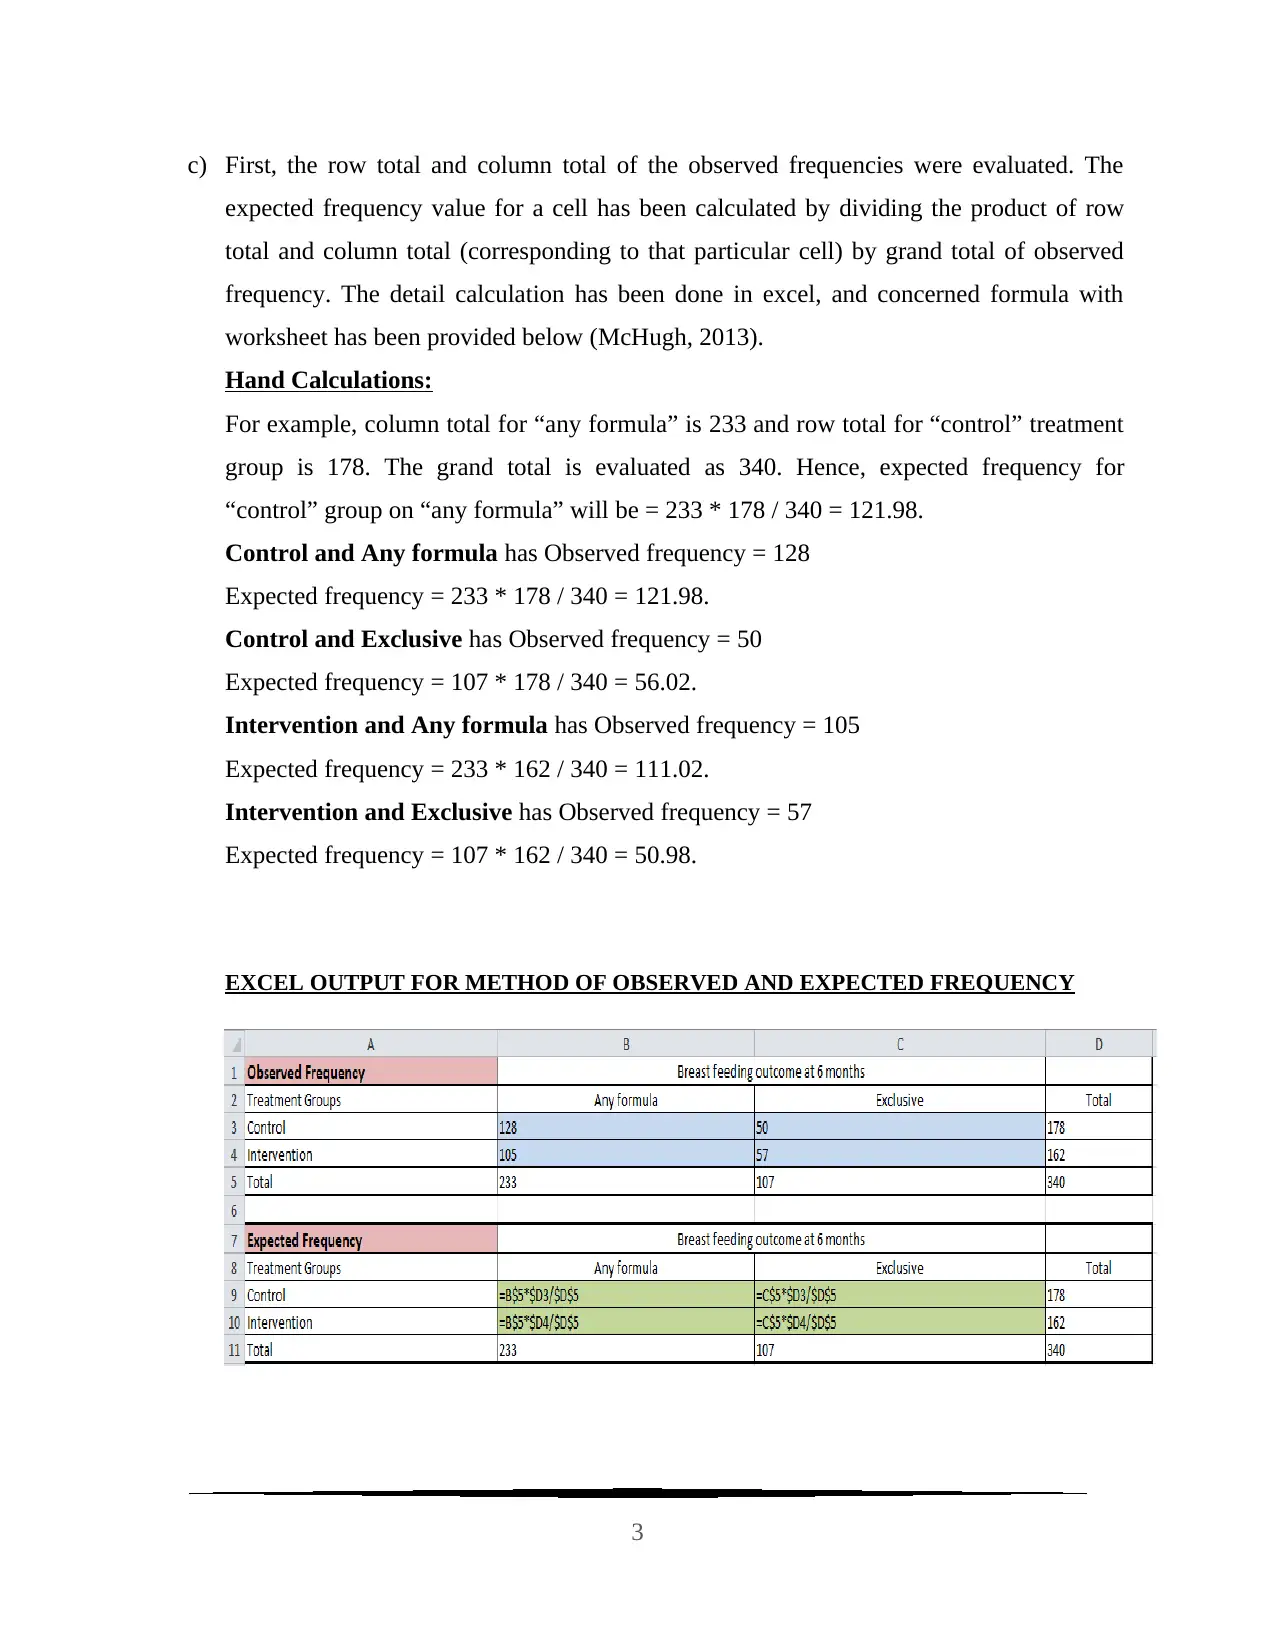
c) First, the row total and column total of the observed frequencies were evaluated. The
expected frequency value for a cell has been calculated by dividing the product of row
total and column total (corresponding to that particular cell) by grand total of observed
frequency. The detail calculation has been done in excel, and concerned formula with
worksheet has been provided below (McHugh, 2013).
Hand Calculations:
For example, column total for “any formula” is 233 and row total for “control” treatment
group is 178. The grand total is evaluated as 340. Hence, expected frequency for
“control” group on “any formula” will be = 233 * 178 / 340 = 121.98.
Control and Any formula has Observed frequency = 128
Expected frequency = 233 * 178 / 340 = 121.98.
Control and Exclusive has Observed frequency = 50
Expected frequency = 107 * 178 / 340 = 56.02.
Intervention and Any formula has Observed frequency = 105
Expected frequency = 233 * 162 / 340 = 111.02.
Intervention and Exclusive has Observed frequency = 57
Expected frequency = 107 * 162 / 340 = 50.98.
EXCEL OUTPUT FOR METHOD OF OBSERVED AND EXPECTED FREQUENCY
3
⊘ This is a preview!⊘
Do you want full access?
Subscribe today to unlock all pages.
Trusted by 1+ million students worldwide
EXCEL OUTPUT FOR OBSERVED AND EXPECTED FREQUENCY
Observed
Frequency Breast feeding outcome at 6 months
Treatment Groups Any formula Exclusive Total
Control 128 50 178
Intervention 105 57 162
Total 233 107 340
Expected Frequency Breast feeding outcome at 6 months
Treatment Groups Any formula Exclusive Total
Control 121.98 56.02 178
Intervention 111.02 50.98 162
Total 233 107 340
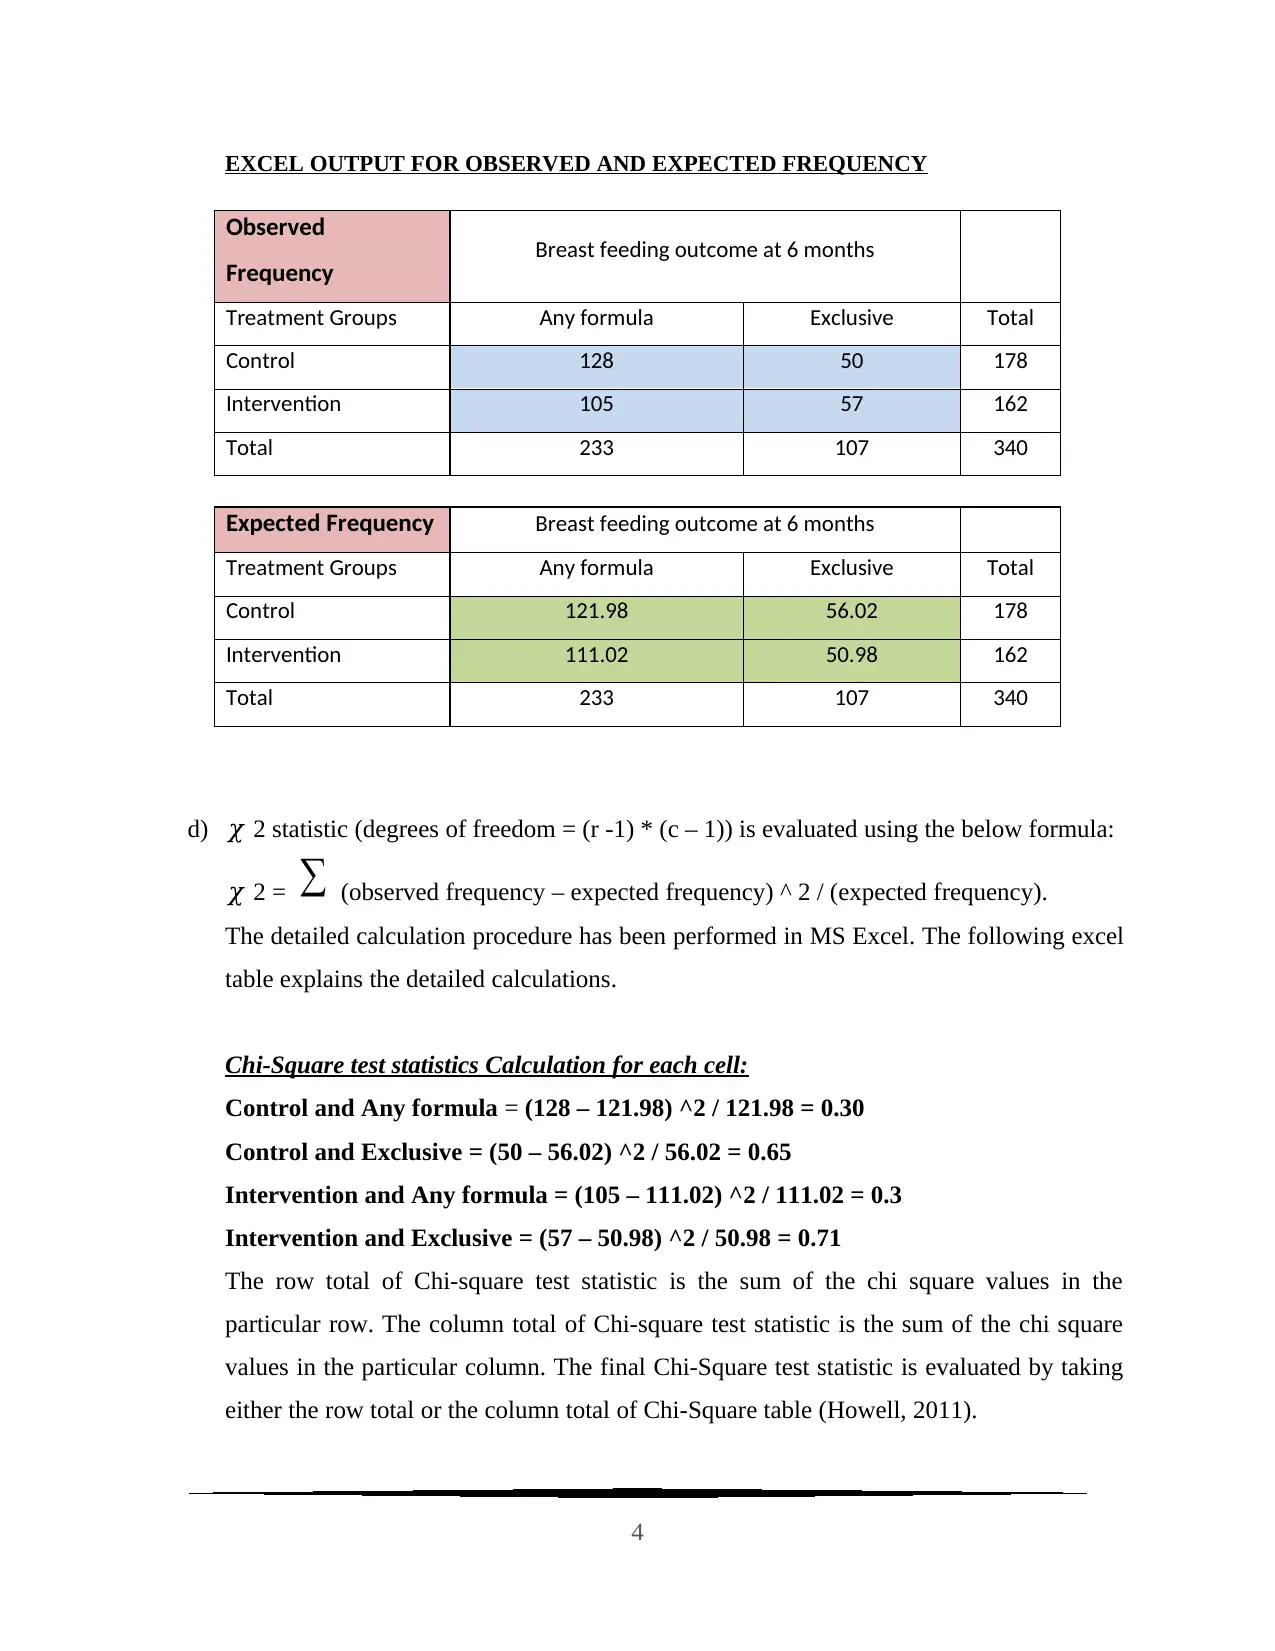
d) 𝜒 2 statistic (degrees of freedom = (r -1) * (c – 1)) is evaluated using the below formula:
𝜒 2 = ∑ (observed frequency – expected frequency) ^ 2 / (expected frequency).
The detailed calculation procedure has been performed in MS Excel. The following excel
table explains the detailed calculations.
Chi-Square test statistics Calculation for each cell:
Control and Any formula = (128 – 121.98) ^2 / 121.98 = 0.30
Control and Exclusive = (50 – 56.02) ^2 / 56.02 = 0.65
Intervention and Any formula = (105 – 111.02) ^2 / 111.02 = 0.3
Intervention and Exclusive = (57 – 50.98) ^2 / 50.98 = 0.71
The row total of Chi-square test statistic is the sum of the chi square values in the
particular row. The column total of Chi-square test statistic is the sum of the chi square
values in the particular column. The final Chi-Square test statistic is evaluated by taking
either the row total or the column total of Chi-Square table (Howell, 2011).
4
Observed
Frequency Breast feeding outcome at 6 months
Treatment Groups Any formula Exclusive Total
Control 128 50 178
Intervention 105 57 162
Total 233 107 340
Expected Frequency Breast feeding outcome at 6 months
Treatment Groups Any formula Exclusive Total
Control 121.98 56.02 178
Intervention 111.02 50.98 162
Total 233 107 340
d) 𝜒 2 statistic (degrees of freedom = (r -1) * (c – 1)) is evaluated using the below formula:
𝜒 2 = ∑ (observed frequency – expected frequency) ^ 2 / (expected frequency).
The detailed calculation procedure has been performed in MS Excel. The following excel
table explains the detailed calculations.
Chi-Square test statistics Calculation for each cell:
Control and Any formula = (128 – 121.98) ^2 / 121.98 = 0.30
Control and Exclusive = (50 – 56.02) ^2 / 56.02 = 0.65
Intervention and Any formula = (105 – 111.02) ^2 / 111.02 = 0.3
Intervention and Exclusive = (57 – 50.98) ^2 / 50.98 = 0.71
The row total of Chi-square test statistic is the sum of the chi square values in the
particular row. The column total of Chi-square test statistic is the sum of the chi square
values in the particular column. The final Chi-Square test statistic is evaluated by taking
either the row total or the column total of Chi-Square table (Howell, 2011).
4
Paraphrase This Document
Need a fresh take? Get an instant paraphrase of this document with our AI Paraphraser

EXCEL OUTPUT FOR METHOD OF CHI-SQUARE TEST OF ASSOCIATION
e) The degrees of freedom for the Chi-Square test are evaluated by the product of (r-1) and
(c-1), where “r” = number of rows in the contingency table, and “c” = number of rows in
the contingency table. Hence, degrees of freedom = (2 – 1) * (2 – 1) = 1 for the Chi-
square test of independence to assess the relation between outcome after 6 months and
treatment groups.
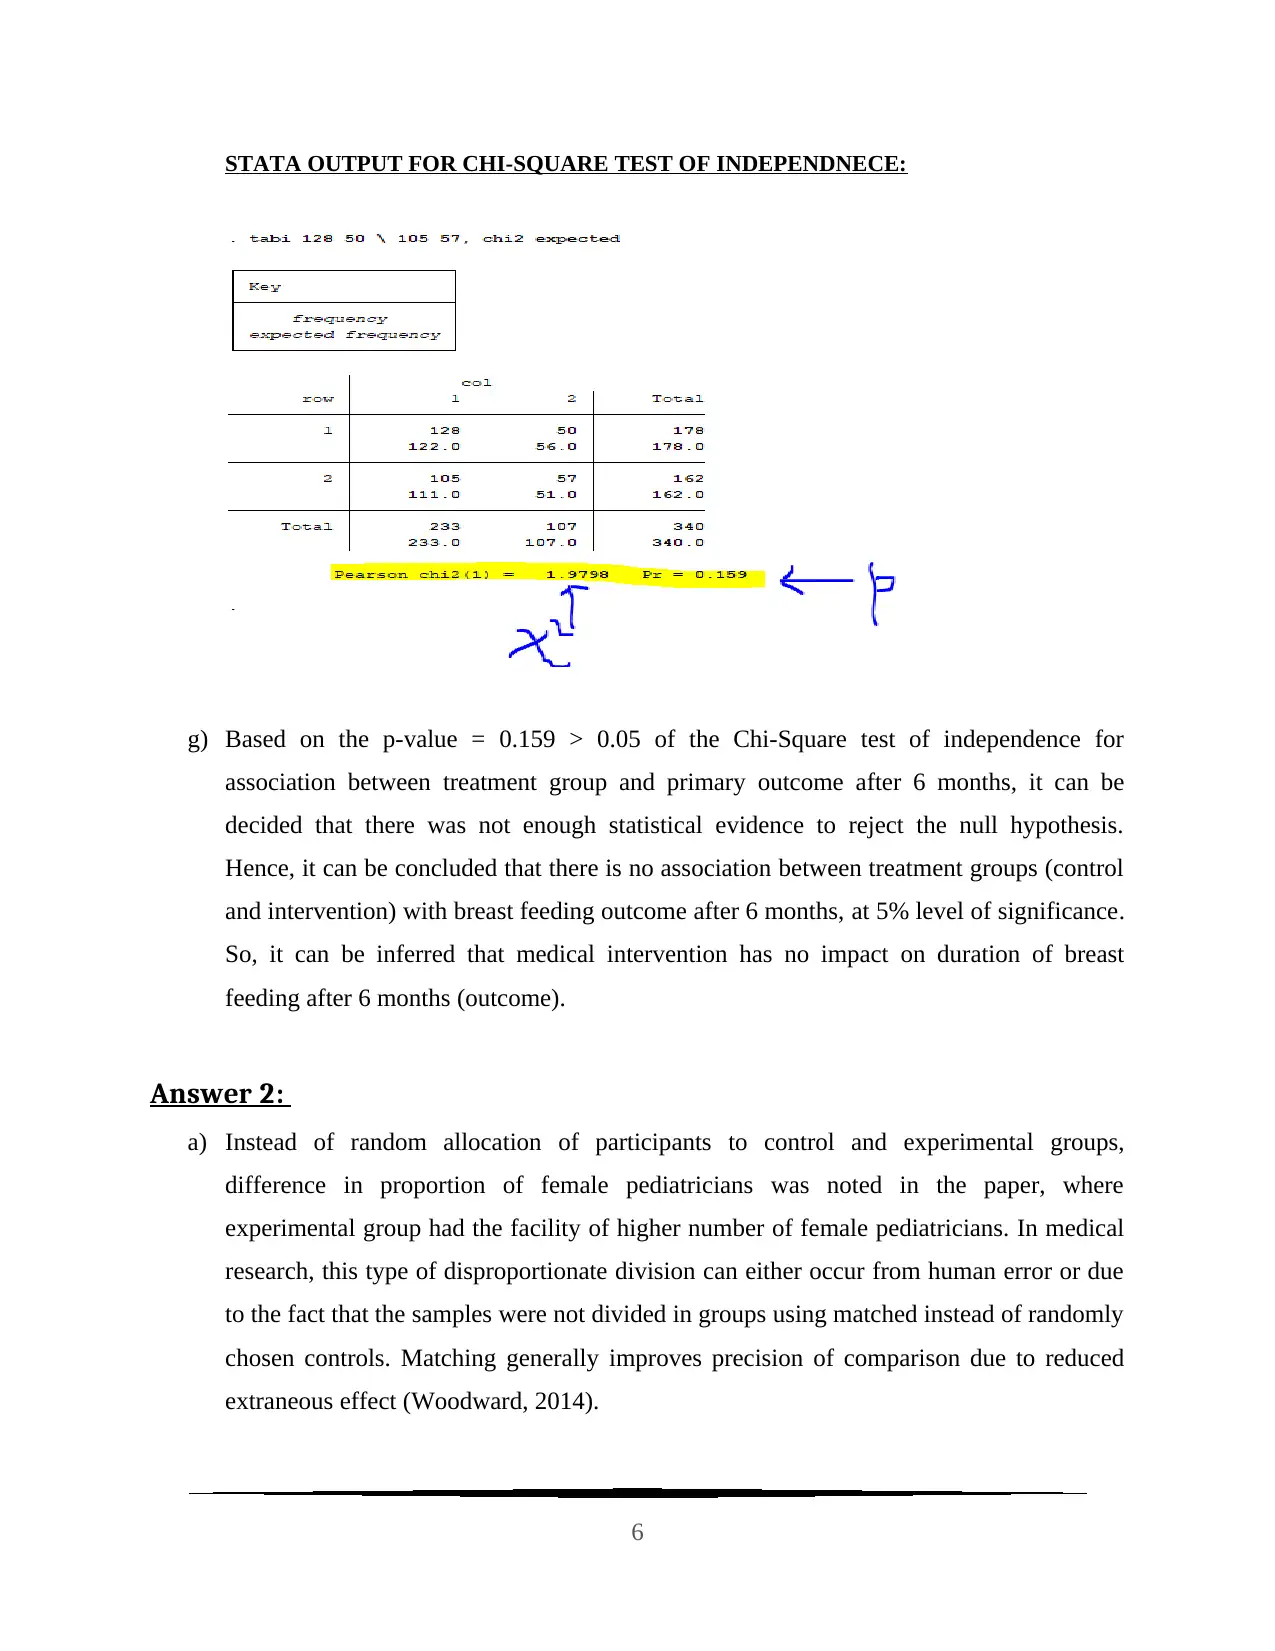
f) The “tabi” command in STATA is to reproduce the Chi-Square test statistic with
manually input observed frequencies. The “tabi” command is used with the observed
frequencies of the contingency table (128, 50, 105, and 57). The Chi-Square statistic is
also found with “chi2 expected” command with “tabi”. The Chi-square test statistic is =
1.98, p = 0.159 > 0.05. Hence, the results resemble with the previous outcomes, implying
that there no difference in outcome of breastfeeding duration between control and
intervention groups at 5% level of significance (Brennan, 2010).
5
e) The degrees of freedom for the Chi-Square test are evaluated by the product of (r-1) and
(c-1), where “r” = number of rows in the contingency table, and “c” = number of rows in
the contingency table. Hence, degrees of freedom = (2 – 1) * (2 – 1) = 1 for the Chi-
square test of independence to assess the relation between outcome after 6 months and
treatment groups.
f) The “tabi” command in STATA is to reproduce the Chi-Square test statistic with
manually input observed frequencies. The “tabi” command is used with the observed
frequencies of the contingency table (128, 50, 105, and 57). The Chi-Square statistic is
also found with “chi2 expected” command with “tabi”. The Chi-square test statistic is =
1.98, p = 0.159 > 0.05. Hence, the results resemble with the previous outcomes, implying
that there no difference in outcome of breastfeeding duration between control and
intervention groups at 5% level of significance (Brennan, 2010).
5
STATA OUTPUT FOR CHI-SQUARE TEST OF INDEPENDNECE:
g) Based on the p-value = 0.159 > 0.05 of the Chi-Square test of independence for
association between treatment group and primary outcome after 6 months, it can be
decided that there was not enough statistical evidence to reject the null hypothesis.
Hence, it can be concluded that there is no association between treatment groups (control
and intervention) with breast feeding outcome after 6 months, at 5% level of significance.
So, it can be inferred that medical intervention has no impact on duration of breast
feeding after 6 months (outcome).
Answer 2:
a) Instead of random allocation of participants to control and experimental groups,
difference in proportion of female pediatricians was noted in the paper, where
experimental group had the facility of higher number of female pediatricians. In medical
research, this type of disproportionate division can either occur from human error or due
to the fact that the samples were not divided in groups using matched instead of randomly
chosen controls. Matching generally improves precision of comparison due to reduced
extraneous effect (Woodward, 2014).
6
⊘ This is a preview!⊘
Do you want full access?
Subscribe today to unlock all pages.
Trusted by 1+ million students worldwide
b) Null hypothesis: There is no difference in average lengths of breastfeeding between
control and intervention groups (treatment).
Alternate hypothesis: Average length of breastfeeding of control group of mothers is
significantly higher than average length of breastfeeding of intervention group of mothers
(treatment) (right tailed).
c) Mean duration of breast feeding for control group = 11.86 months, and mean duration of
breast feeding for intervention group = 7.82 months. Difference in sample means duration
between control and intervention group = (11.86 – 7.82) = 4.04 months.
d) Expected difference between average duration of previous breastfeeding of control and
intervention group is zero month. Here equal average duration of previous breast feeding
is considered for control and intervention groups. The null hypothesis statement
incorporates this assumption of equality of average duration of previous breast feeding.
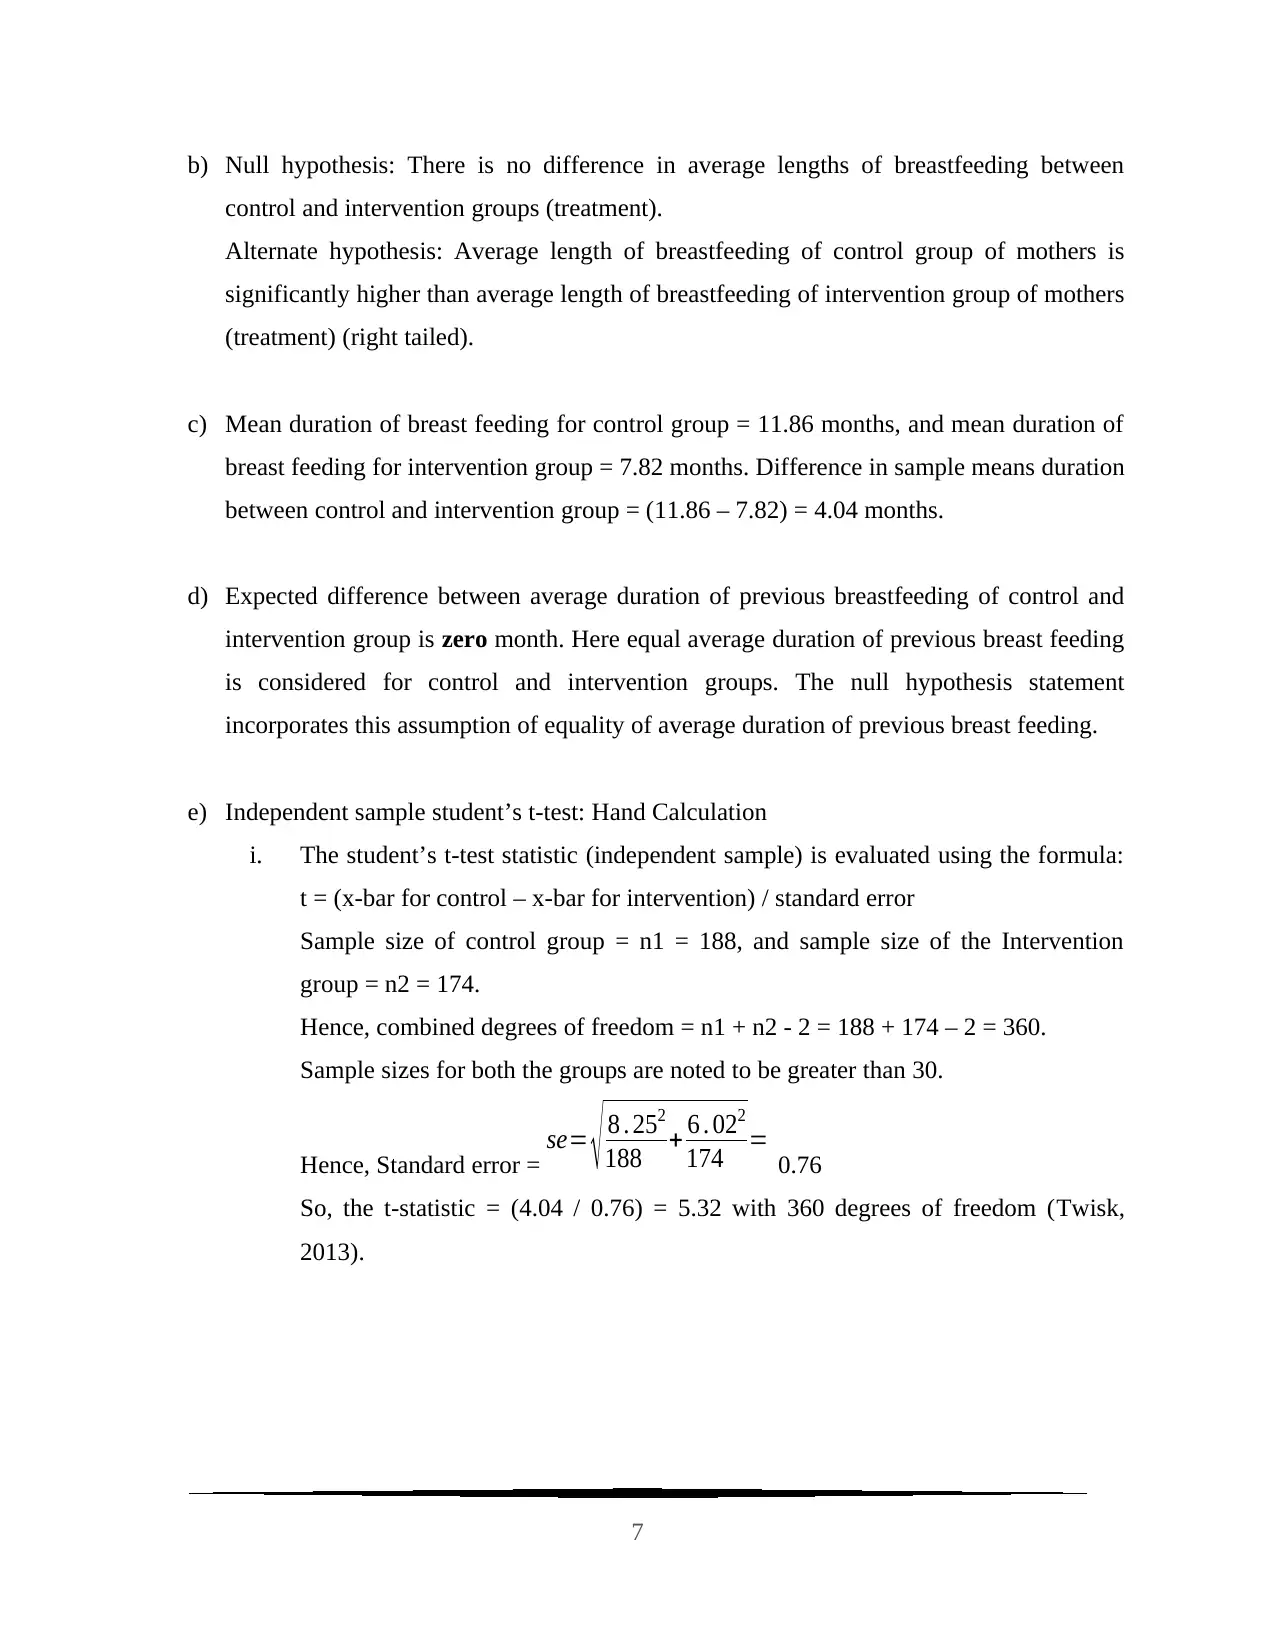
e) Independent sample student’s t-test: Hand Calculation
i. The student’s t-test statistic (independent sample) is evaluated using the formula:
t = (x-bar for control – x-bar for intervention) / standard error
Sample size of control group = n1 = 188, and sample size of the Intervention
group = n2 = 174.
Hence, combined degrees of freedom = n1 + n2 - 2 = 188 + 174 – 2 = 360.
Sample sizes for both the groups are noted to be greater than 30.
Hence, Standard error =
se= √ 8 . 252
188 + 6 . 022
174 = 0.76
So, the t-statistic = (4.04 / 0.76) = 5.32 with 360 degrees of freedom (Twisk,
2013).
7
control and intervention groups (treatment).
Alternate hypothesis: Average length of breastfeeding of control group of mothers is
significantly higher than average length of breastfeeding of intervention group of mothers
(treatment) (right tailed).
c) Mean duration of breast feeding for control group = 11.86 months, and mean duration of
breast feeding for intervention group = 7.82 months. Difference in sample means duration
between control and intervention group = (11.86 – 7.82) = 4.04 months.
d) Expected difference between average duration of previous breastfeeding of control and
intervention group is zero month. Here equal average duration of previous breast feeding
is considered for control and intervention groups. The null hypothesis statement
incorporates this assumption of equality of average duration of previous breast feeding.
e) Independent sample student’s t-test: Hand Calculation
i. The student’s t-test statistic (independent sample) is evaluated using the formula:
t = (x-bar for control – x-bar for intervention) / standard error
Sample size of control group = n1 = 188, and sample size of the Intervention
group = n2 = 174.
Hence, combined degrees of freedom = n1 + n2 - 2 = 188 + 174 – 2 = 360.
Sample sizes for both the groups are noted to be greater than 30.
Hence, Standard error =
se= √ 8 . 252
188 + 6 . 022
174 = 0.76
So, the t-statistic = (4.04 / 0.76) = 5.32 with 360 degrees of freedom (Twisk,
2013).
7
Paraphrase This Document
Need a fresh take? Get an instant paraphrase of this document with our AI Paraphraser
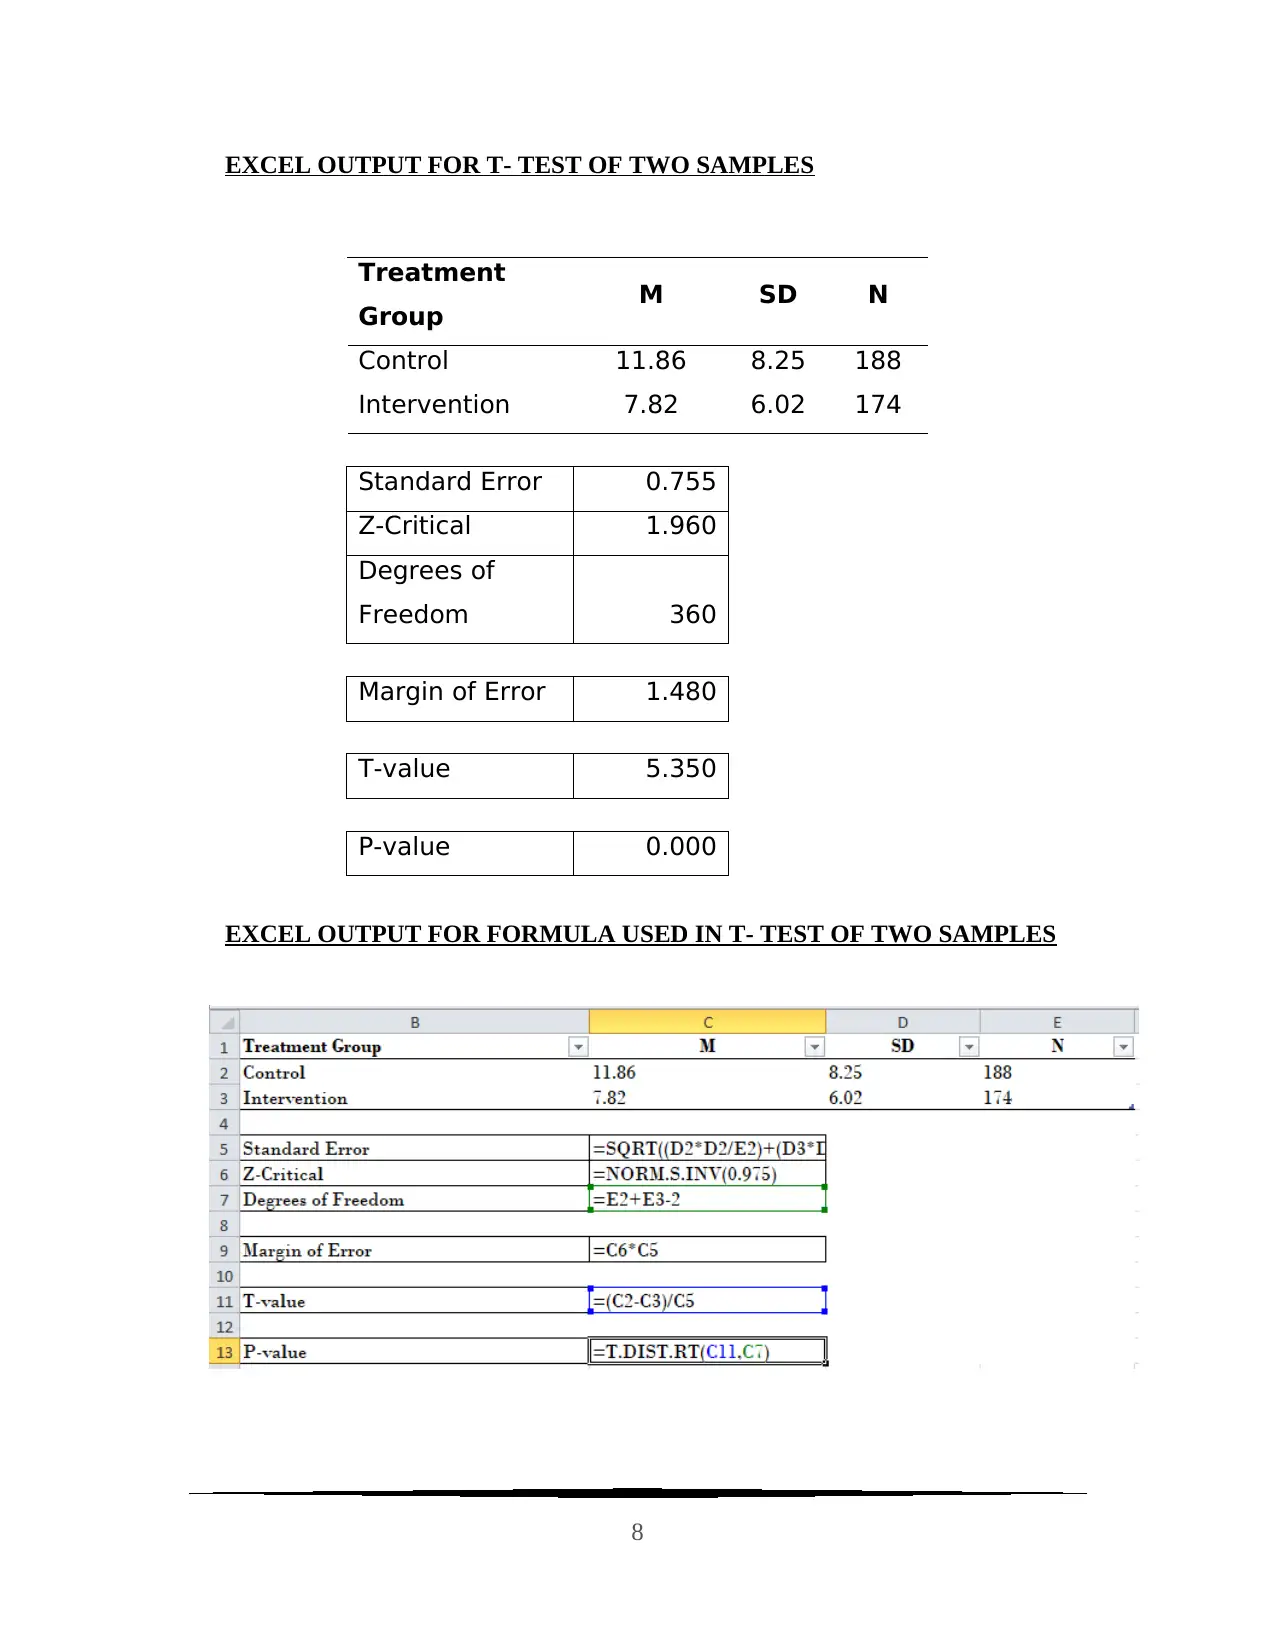
EXCEL OUTPUT FOR T- TEST OF TWO SAMPLES
Treatment
Group M SD N
Control 11.86 8.25 188
Intervention 7.82 6.02 174
Standard Error 0.755
Z-Critical 1.960
Degrees of
Freedom 360
Margin of Error 1.480
T-value 5.350
P-value 0.000
EXCEL OUTPUT FOR FORMULA USED IN T- TEST OF TWO SAMPLES
8
Treatment
Group M SD N
Control 11.86 8.25 188
Intervention 7.82 6.02 174
Standard Error 0.755
Z-Critical 1.960
Degrees of
Freedom 360
Margin of Error 1.480
T-value 5.350
P-value 0.000
EXCEL OUTPUT FOR FORMULA USED IN T- TEST OF TWO SAMPLES
8
ii. Sample size of control group = N1 = 188, and Intervention group = N2 = 174.
Hence degrees of freedom = N1 + N2 -2 = 188 + 174 – 2 = 360.
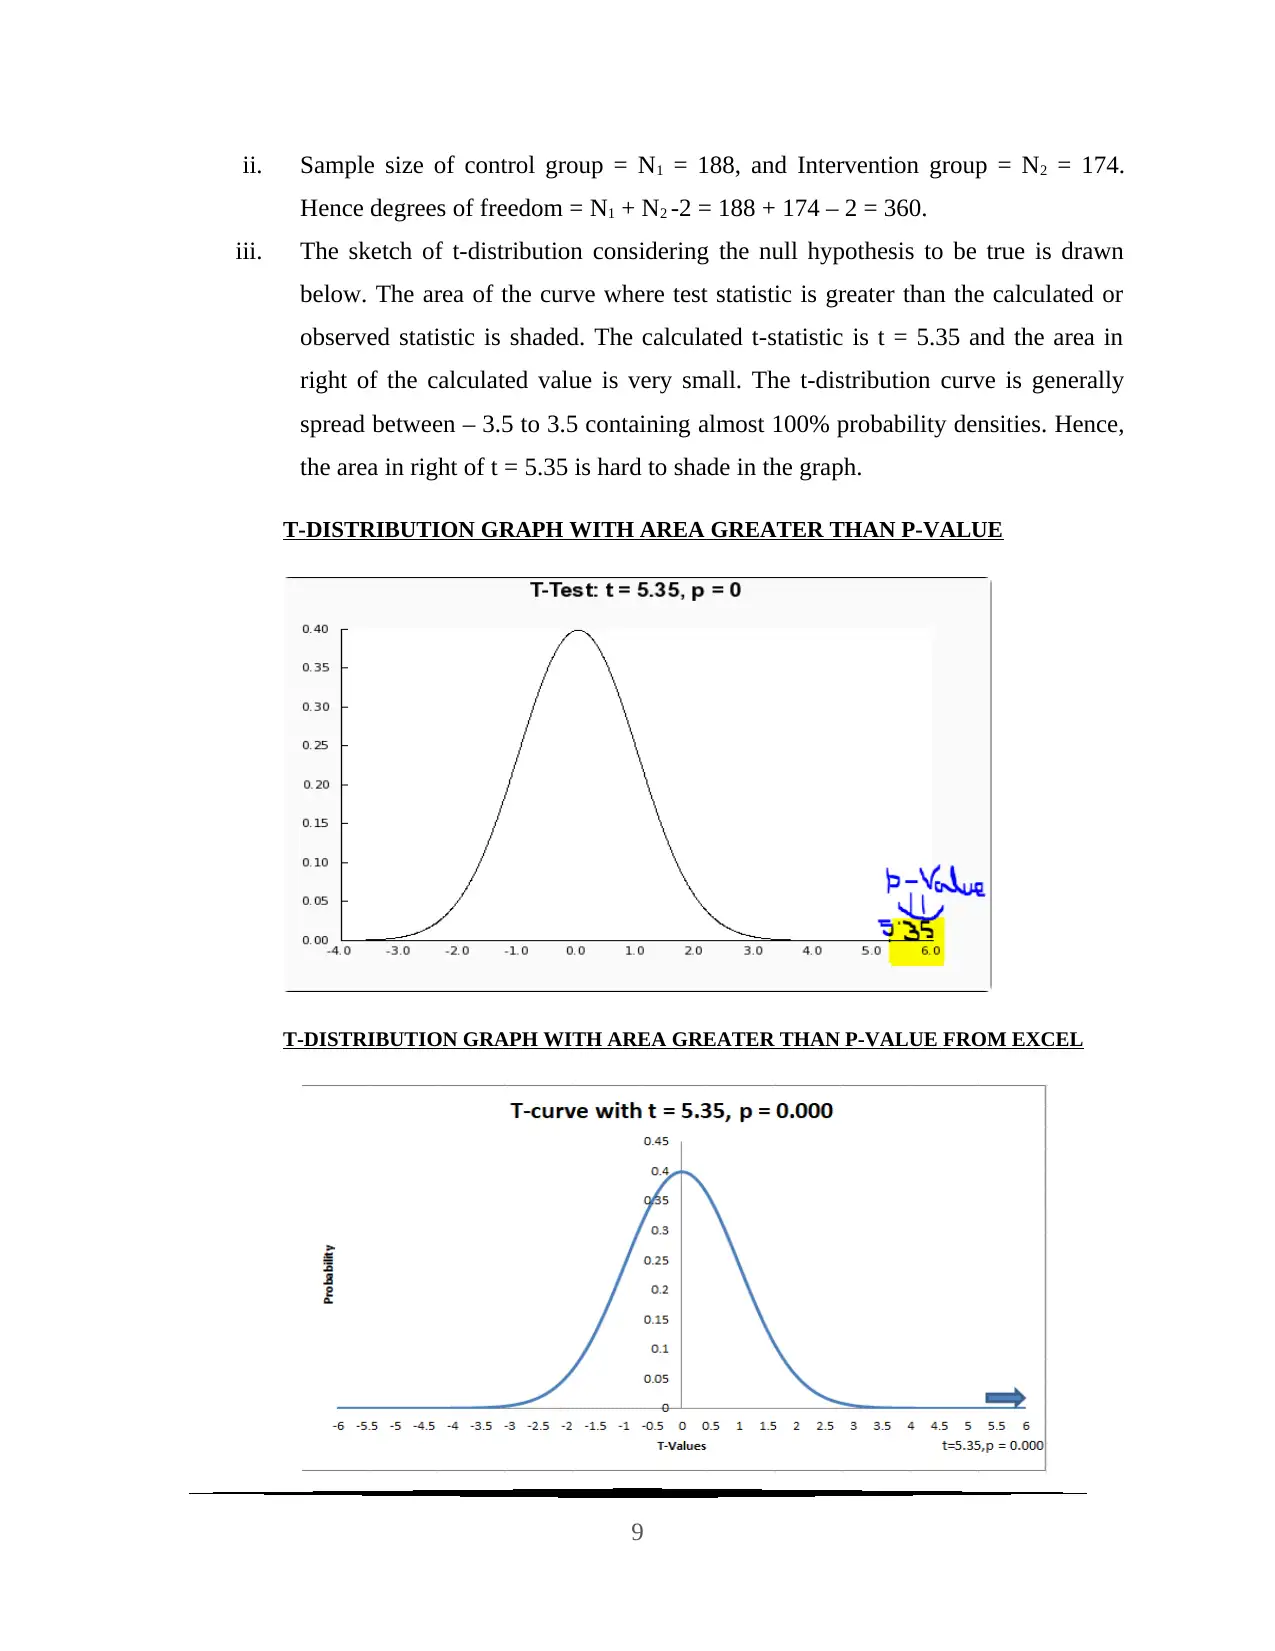
iii. The sketch of t-distribution considering the null hypothesis to be true is drawn
below. The area of the curve where test statistic is greater than the calculated or
observed statistic is shaded. The calculated t-statistic is t = 5.35 and the area in
right of the calculated value is very small. The t-distribution curve is generally
spread between – 3.5 to 3.5 containing almost 100% probability densities. Hence,
the area in right of t = 5.35 is hard to shade in the graph.
T-DISTRIBUTION GRAPH WITH AREA GREATER THAN P-VALUE
T-DISTRIBUTION GRAPH WITH AREA GREATER THAN P-VALUE FROM EXCEL
9
Hence degrees of freedom = N1 + N2 -2 = 188 + 174 – 2 = 360.
iii. The sketch of t-distribution considering the null hypothesis to be true is drawn
below. The area of the curve where test statistic is greater than the calculated or
observed statistic is shaded. The calculated t-statistic is t = 5.35 and the area in
right of the calculated value is very small. The t-distribution curve is generally
spread between – 3.5 to 3.5 containing almost 100% probability densities. Hence,
the area in right of t = 5.35 is hard to shade in the graph.
T-DISTRIBUTION GRAPH WITH AREA GREATER THAN P-VALUE
T-DISTRIBUTION GRAPH WITH AREA GREATER THAN P-VALUE FROM EXCEL
9
⊘ This is a preview!⊘
Do you want full access?
Subscribe today to unlock all pages.
Trusted by 1+ million students worldwide
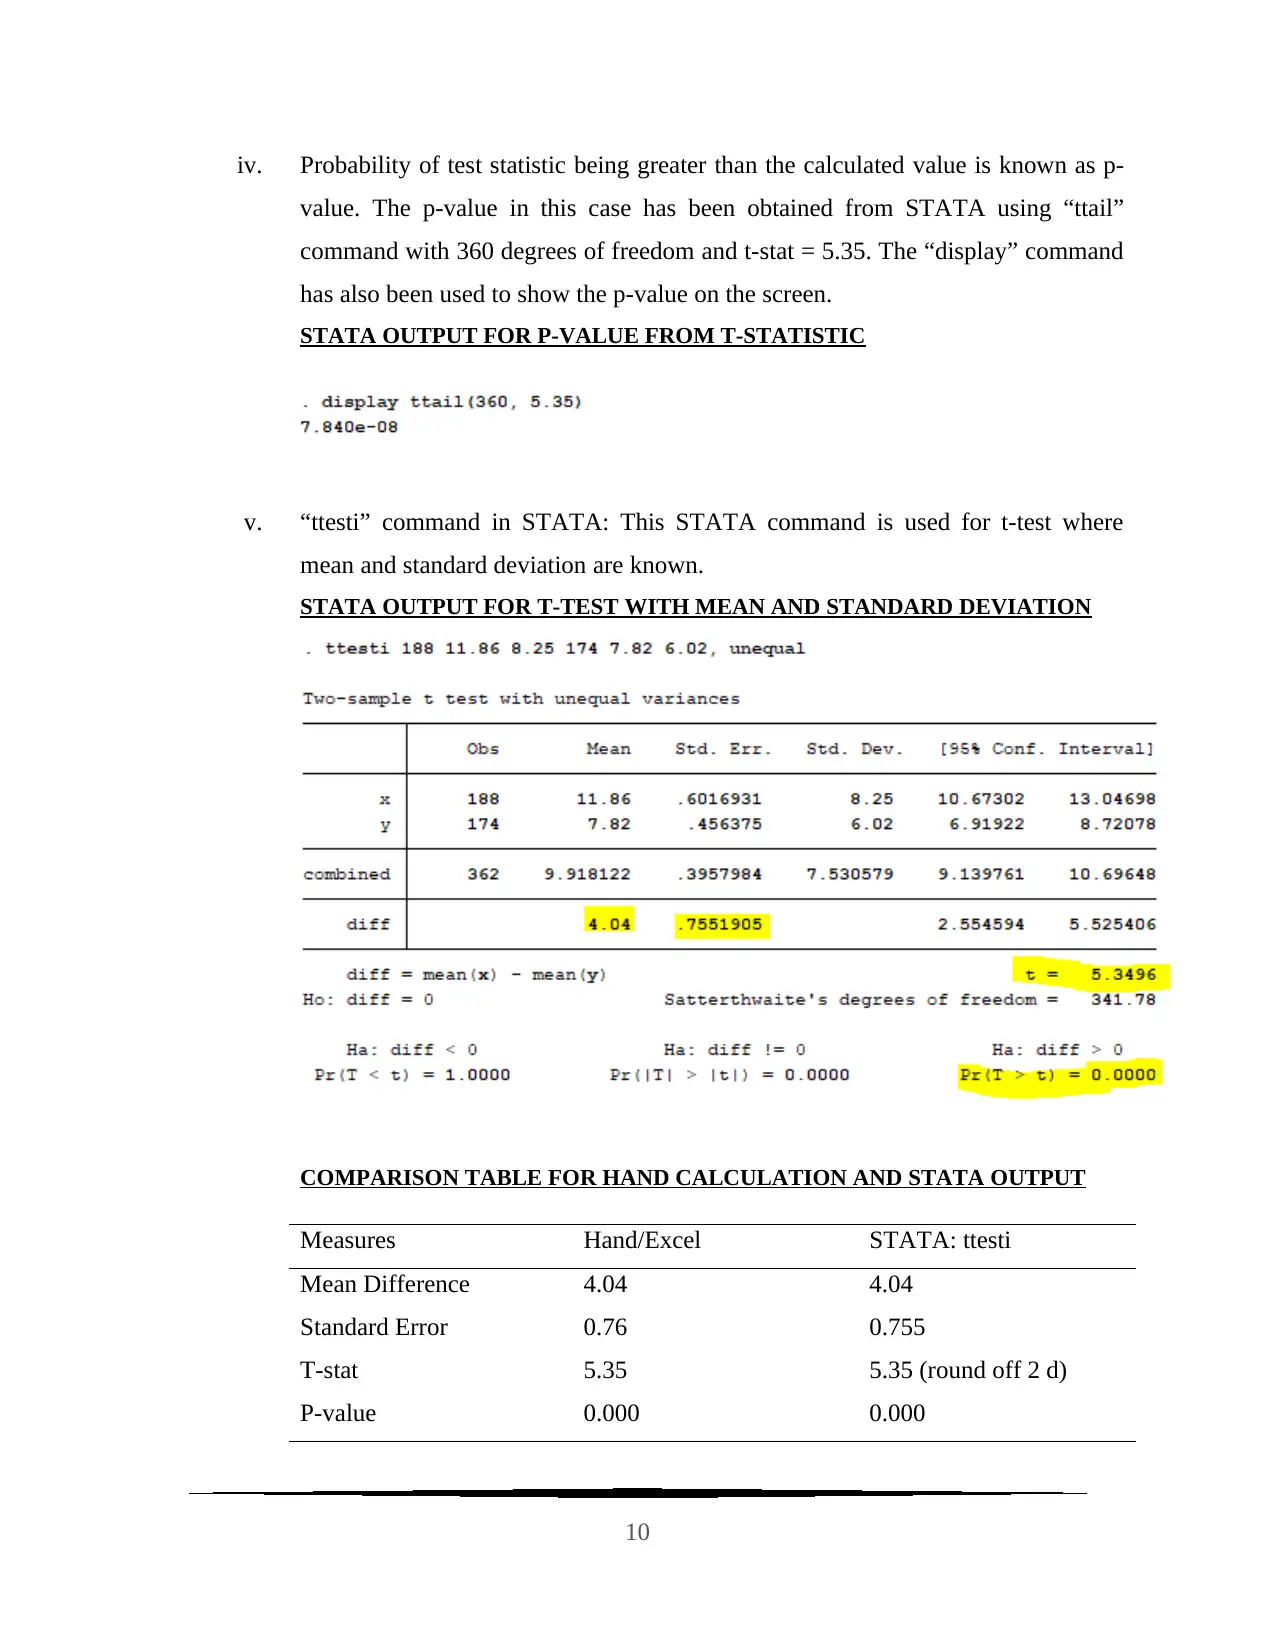
iv. Probability of test statistic being greater than the calculated value is known as p-
value. The p-value in this case has been obtained from STATA using “ttail”
command with 360 degrees of freedom and t-stat = 5.35. The “display” command
has also been used to show the p-value on the screen.
STATA OUTPUT FOR P-VALUE FROM T-STATISTIC
v. “ttesti” command in STATA: This STATA command is used for t-test where
mean and standard deviation are known.
STATA OUTPUT FOR T-TEST WITH MEAN AND STANDARD DEVIATION
COMPARISON TABLE FOR HAND CALCULATION AND STATA OUTPUT
Measures Hand/Excel STATA: ttesti
Mean Difference 4.04 4.04
Standard Error 0.76 0.755
T-stat 5.35 5.35 (round off 2 d)
P-value 0.000 0.000
10
Paraphrase This Document
Need a fresh take? Get an instant paraphrase of this document with our AI Paraphraser
vi. The p-value region (very small region) in Q2 (iii), and p-value (p < 0.05) in Q2
(IV) imply that there was statistically strong evidence to reject the null hypothesis
that there was no difference in average duration of previous breastfeeding for
control and intervention groups, at 5% level of significance. Hence, it was
concluded that average duration of breastfeeding significantly reduced with
intervention process.
vii. Average duration of earlier breastfeeding was significantly less for intervention
treatment group. It has also been noted earlier that treatment group and primary
outcome had no statistically significant association (Chi-Square = 1.98, p =
0.159), at 5% level of significance. Hence, outcome of previous breastfeeding
duration is supposed to have no significant impact on the primary outcome.
Answer 3:
Null hypothesis: There is no statistically significant association between delivery mode
(“Vaginal” or “Cesarean”) and treatment group of a participant (Control” or
“Intervention”), implying that delivery mode of a participant has no impact on duration of
breast feeding after 6 months of delivery. .
Alternate hypothesis: There existed a statistically significant association between delivery
mode (“Vaginal” or “Cesarean”) and treatment group of a participant (Control” or
“Intervention”), implying that delivery mode of a participant has significant impact on
duration of breast feeding after 6 months of delivery. .
Level of significance: Alpha = 0.05 or 5%
Choice of test: Chi-square test of Independence is the appropriate choice of test to
evaluate association between two nominal / categorical variables.
Test Statistic Calculation: Using STATA, the Chi-square statistic = 1.18, and the p-value
= 0.277 > 0.05.
11
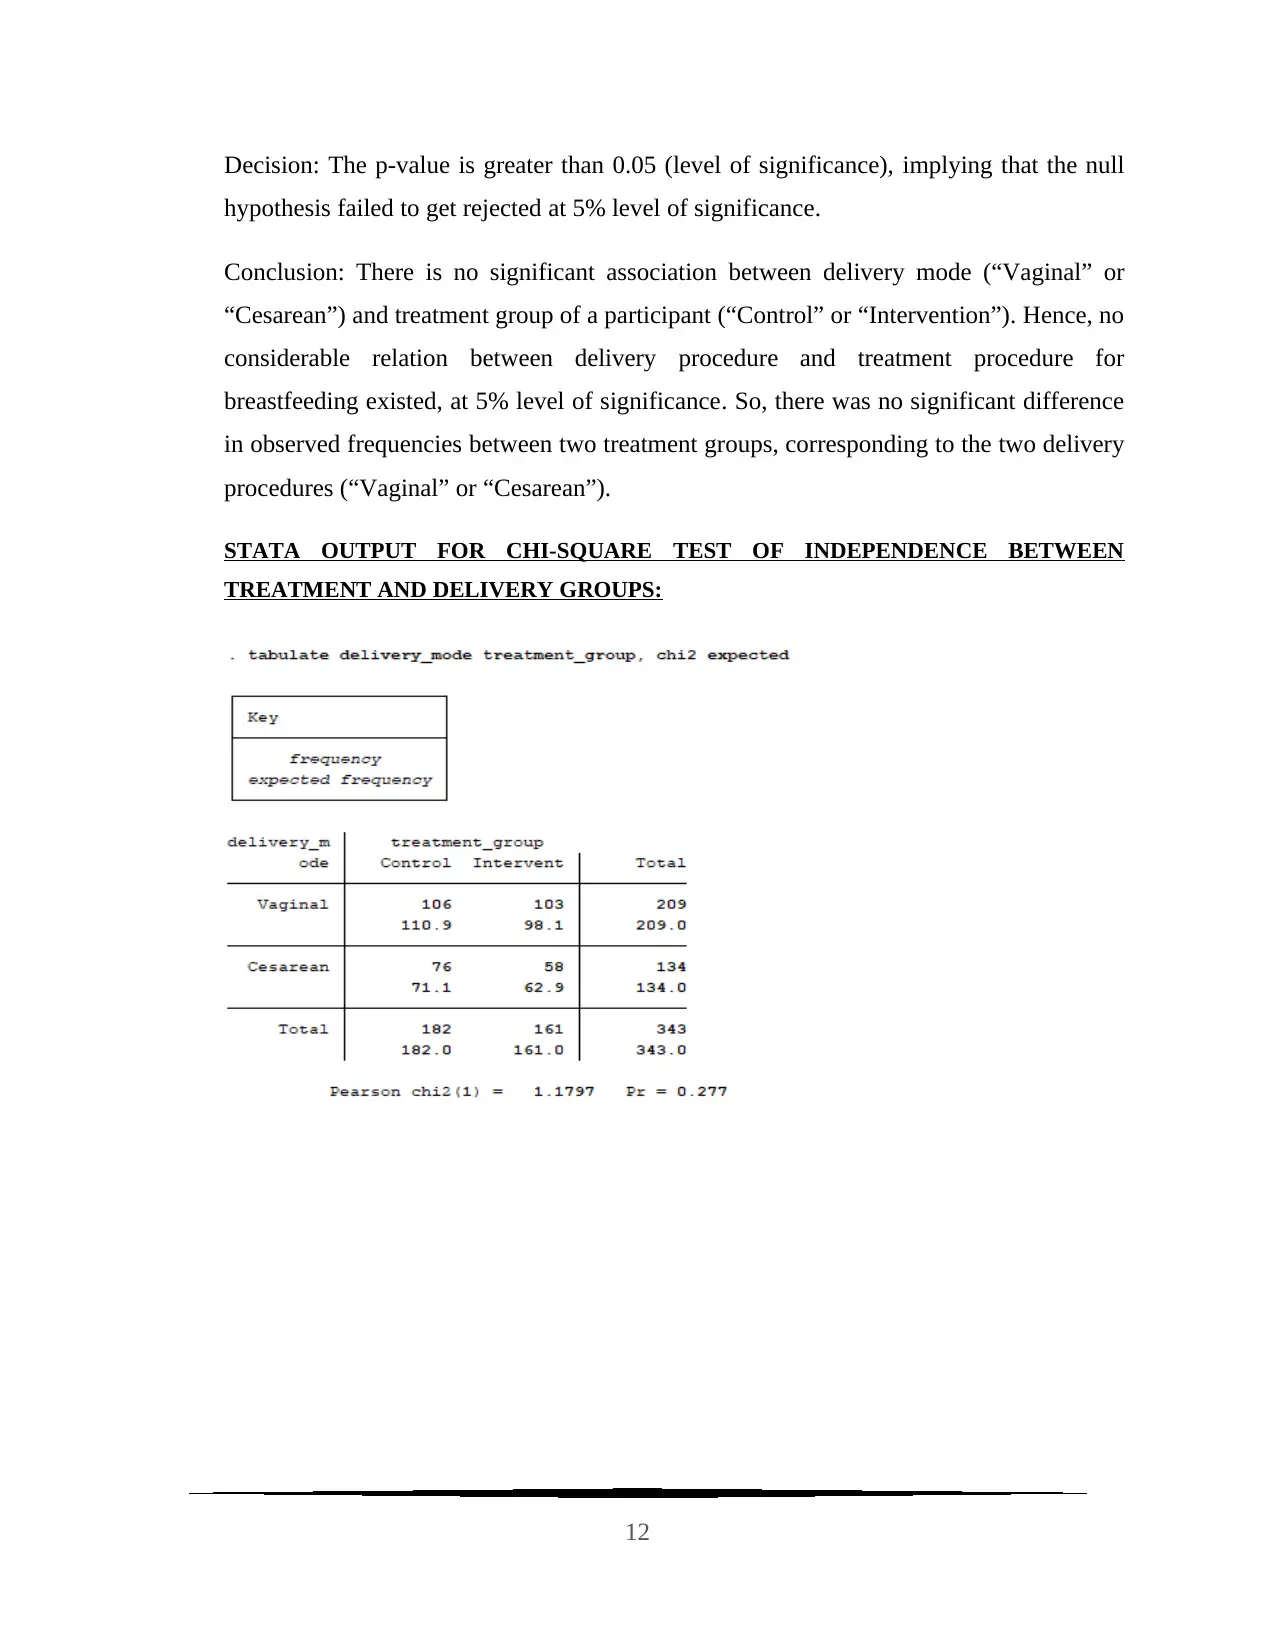
Decision: The p-value is greater than 0.05 (level of significance), implying that the null
hypothesis failed to get rejected at 5% level of significance.
Conclusion: There is no significant association between delivery mode (“Vaginal” or
“Cesarean”) and treatment group of a participant (“Control” or “Intervention”). Hence, no
considerable relation between delivery procedure and treatment procedure for
breastfeeding existed, at 5% level of significance. So, there was no significant difference
in observed frequencies between two treatment groups, corresponding to the two delivery
procedures (“Vaginal” or “Cesarean”).
STATA OUTPUT FOR CHI-SQUARE TEST OF INDEPENDENCE BETWEEN
TREATMENT AND DELIVERY GROUPS:
12
⊘ This is a preview!⊘
Do you want full access?
Subscribe today to unlock all pages.
Trusted by 1+ million students worldwide
1 out of 15

Your All-in-One AI-Powered Toolkit for Academic Success.
+13062052269
info@desklib.com
Available 24*7 on WhatsApp / Email
![[object Object]](/_next/static/media/star-bottom.7253800d.svg)
Unlock your academic potential
Copyright © 2020–2026 A2Z Services. All Rights Reserved. Developed and managed by ZUCOL.