Strategic Growth and Market Challenges of Breville Group
VerifiedAdded on 2020/05/28
|20
|4451
|134
Case Study
AI Summary
Breville is a renowned multinational corporation specializing in high-tech kitchen appliances, established in Australia. The case study explores Breville's strategies for expanding into global markets by focusing on innovative product offerings and efficient market tactics. Despite facing competitive pressures and economic fluctuations, such as currency devaluation, Breville has successfully mitigated risks through strategic planning and robust transformation programs. These initiatives include transitioning to an innovation-centric company, enhancing market reach, and optimizing global performance. The company's sustained growth in North America highlights effective strategies that compensate for challenges in other regions like Australia and New Zealand.
Running head: ECONOMIES OF THE BRAVILLE GROUP
Economics of the Breville Group
Name of the University
Name of the student
Author note
Economics of the Breville Group
Name of the University
Name of the student
Author note
Paraphrase This Document
Need a fresh take? Get an instant paraphrase of this document with our AI Paraphraser
1
ECONOMIES OF THE BRAVILLE GROUP
Table of Contents
Introduction:...............................................................................................................................3
Vulnerability:.............................................................................................................................4
Market Exposure:.......................................................................................................................6
Market demand and GDP development:................................................................................6
Margin Risk:...........................................................................................................................8
Interest rate risk:.....................................................................................................................9
Marker competition:...............................................................................................................9
Performance comparison:.....................................................................................................10
Business strategy of Breville for 2008 and 2009:................................................................11
Macroeconomic Exposure:.......................................................................................................11
Foreign currency exchange risk:..........................................................................................11
Legal factor:.........................................................................................................................12
Protection:................................................................................................................................13
Capital:.................................................................................................................................13
Technology:..........................................................................................................................13
Go-to-market transformation:..............................................................................................14
E-Market strategy of Breville:.............................................................................................14
Market Expansion:...............................................................................................................14
“Strategic hell” of Breville:..................................................................................................15
Overall Analysis:......................................................................................................................16

2
ECONOMIES OF THE BRAVILLE GROUP
Conclusion:..............................................................................................................................17
Reference:................................................................................................................................18
⊘ This is a preview!⊘
Do you want full access?
Subscribe today to unlock all pages.
Trusted by 1+ million students worldwide
3
ECONOMIES OF THE BRAVILLE GROUP
Introduction:
Breville is an Australian based manufacturer of small home appliances. They
are well-known sandwich toaster making company. At present, the company operates its
business in international market by exporting their products in China, South Africa, Brazil,
Israel and Mexico (Brevillegroup.com 2018). The chief products of this company are kettles,
toasters, contact grills, pressure cookers, bread makers, deep fryers, microwave ovens, and
blenders and so on. The ASX listed Breville Group of Australia has possessed this Breville
brand. There are some other companies, which are undertaken by this group. The Breville
group owns the Ronson appliances in their home country. Other brands under Breville group
are Solis, Stollar and Gastroback. In 2013, the Braville group has launched their new business
line in United Kingdom with a new brand name. Kambrook is another famous brand for
kitchen product products of this group. This brand is well-known in Australia and New
Zealand. This brand name is called SageTM, endorsed by Heston Blumenthal. The group has
taken over the Aquaport business from an Australian company to create their new product
segment. The chief product development centre of Braville group is situated in Sydney.
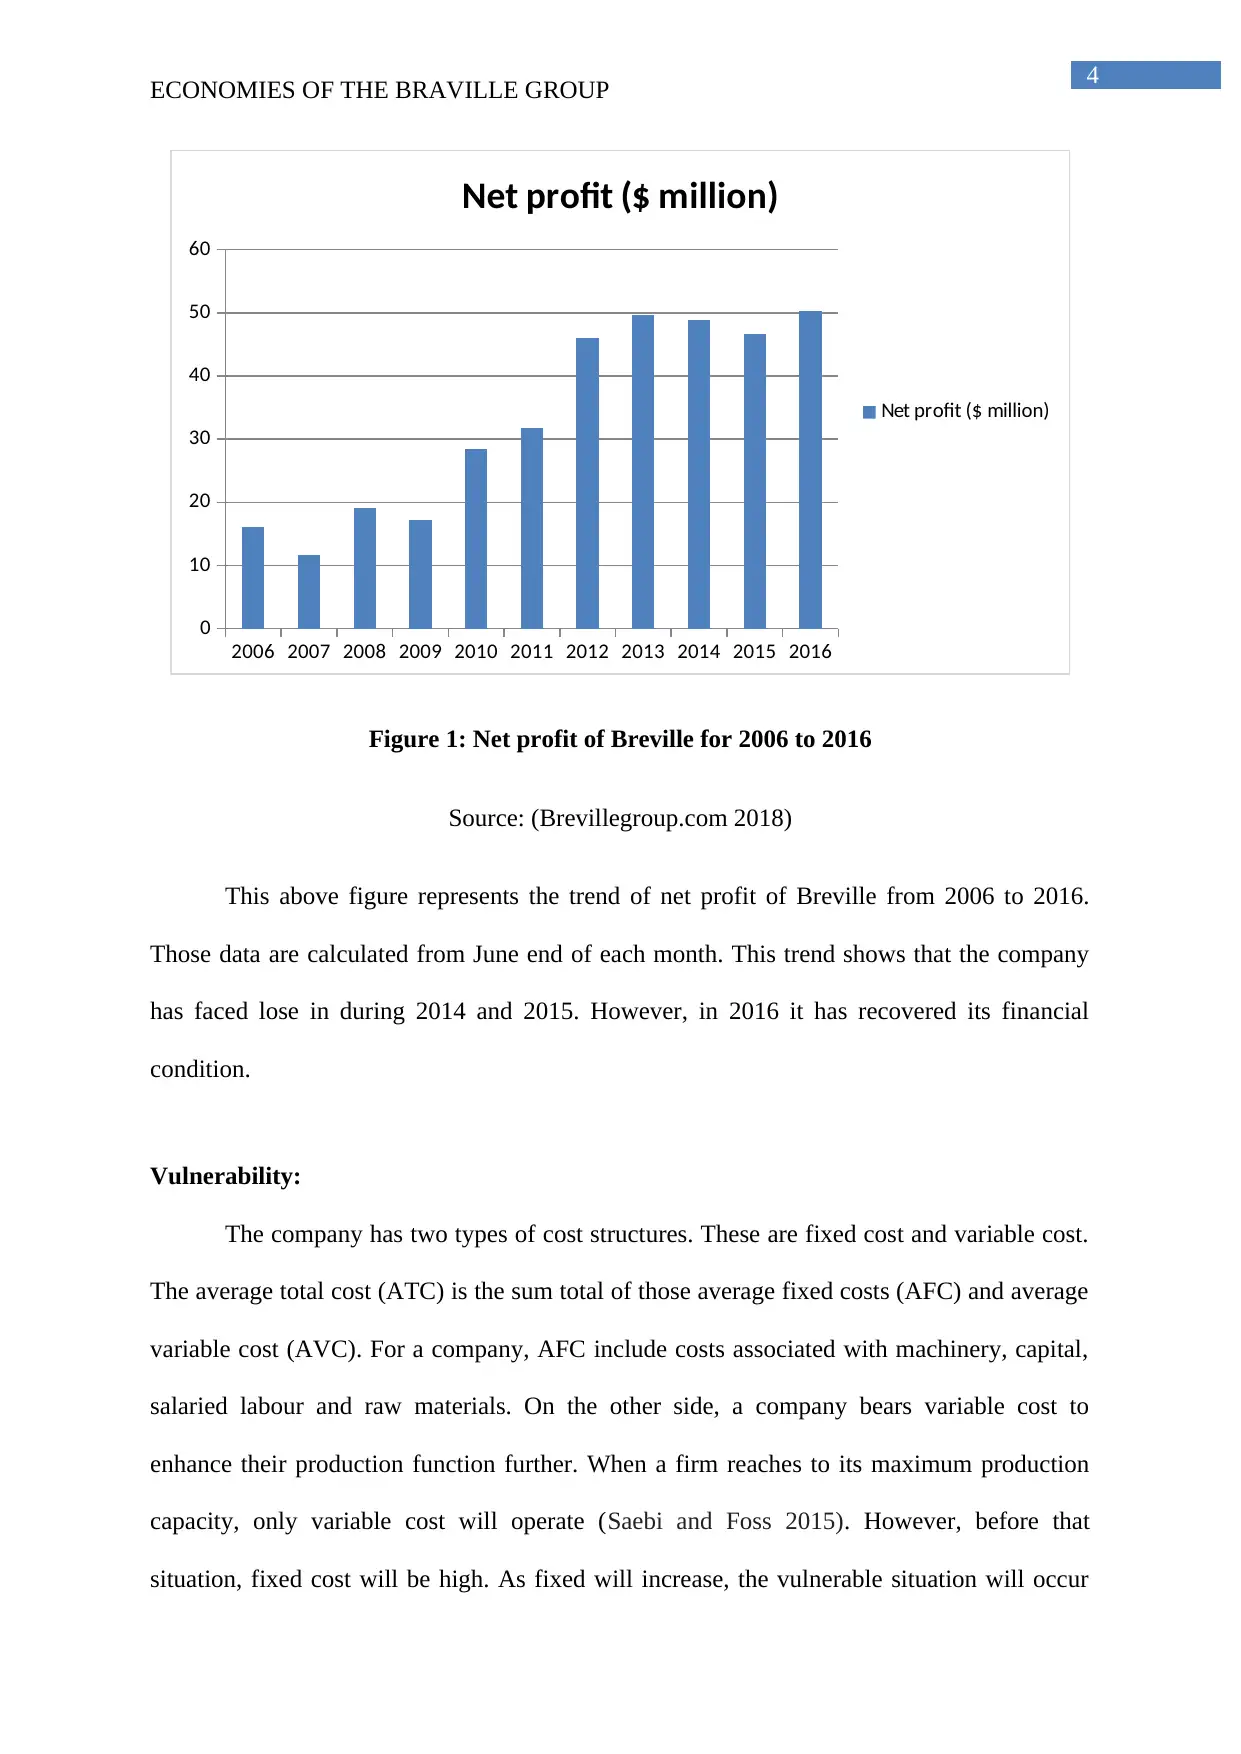
Breville is a publicly listed company of Australia. A suitable bar diagram can
represent the net profit of this company from 2006 to 2016. This net profit indicates
difference between revenue and income tax.
ECONOMIES OF THE BRAVILLE GROUP
Introduction:
Breville is an Australian based manufacturer of small home appliances. They
are well-known sandwich toaster making company. At present, the company operates its
business in international market by exporting their products in China, South Africa, Brazil,
Israel and Mexico (Brevillegroup.com 2018). The chief products of this company are kettles,
toasters, contact grills, pressure cookers, bread makers, deep fryers, microwave ovens, and
blenders and so on. The ASX listed Breville Group of Australia has possessed this Breville
brand. There are some other companies, which are undertaken by this group. The Breville
group owns the Ronson appliances in their home country. Other brands under Breville group
are Solis, Stollar and Gastroback. In 2013, the Braville group has launched their new business
line in United Kingdom with a new brand name. Kambrook is another famous brand for
kitchen product products of this group. This brand is well-known in Australia and New
Zealand. This brand name is called SageTM, endorsed by Heston Blumenthal. The group has
taken over the Aquaport business from an Australian company to create their new product
segment. The chief product development centre of Braville group is situated in Sydney.
Breville is a publicly listed company of Australia. A suitable bar diagram can
represent the net profit of this company from 2006 to 2016. This net profit indicates
difference between revenue and income tax.
Paraphrase This Document
Need a fresh take? Get an instant paraphrase of this document with our AI Paraphraser
4
ECONOMIES OF THE BRAVILLE GROUP
2006 2007 2008 2009 2010 2011 2012 2013 2014 2015 2016
0
10
20
30
40
50
60
Net profit ($ million)
Net profit ($ million)
Figure 1: Net profit of Breville for 2006 to 2016
Source: (Brevillegroup.com 2018)
This above figure represents the trend of net profit of Breville from 2006 to 2016.
Those data are calculated from June end of each month. This trend shows that the company
has faced lose in during 2014 and 2015. However, in 2016 it has recovered its financial
condition.
Vulnerability:
The company has two types of cost structures. These are fixed cost and variable cost.
The average total cost (ATC) is the sum total of those average fixed costs (AFC) and average
variable cost (AVC). For a company, AFC include costs associated with machinery, capital,
salaried labour and raw materials. On the other side, a company bears variable cost to
enhance their production function further. When a firm reaches to its maximum production
capacity, only variable cost will operate (Saebi and Foss 2015). However, before that
situation, fixed cost will be high. As fixed will increase, the vulnerable situation will occur
5
ECONOMIES OF THE BRAVILLE GROUP
more. Type 1 of vulnerability represents fixed cost and quasi-fixed cost of this company.
Type 2 of vulnerability includes variable cost of this firm.
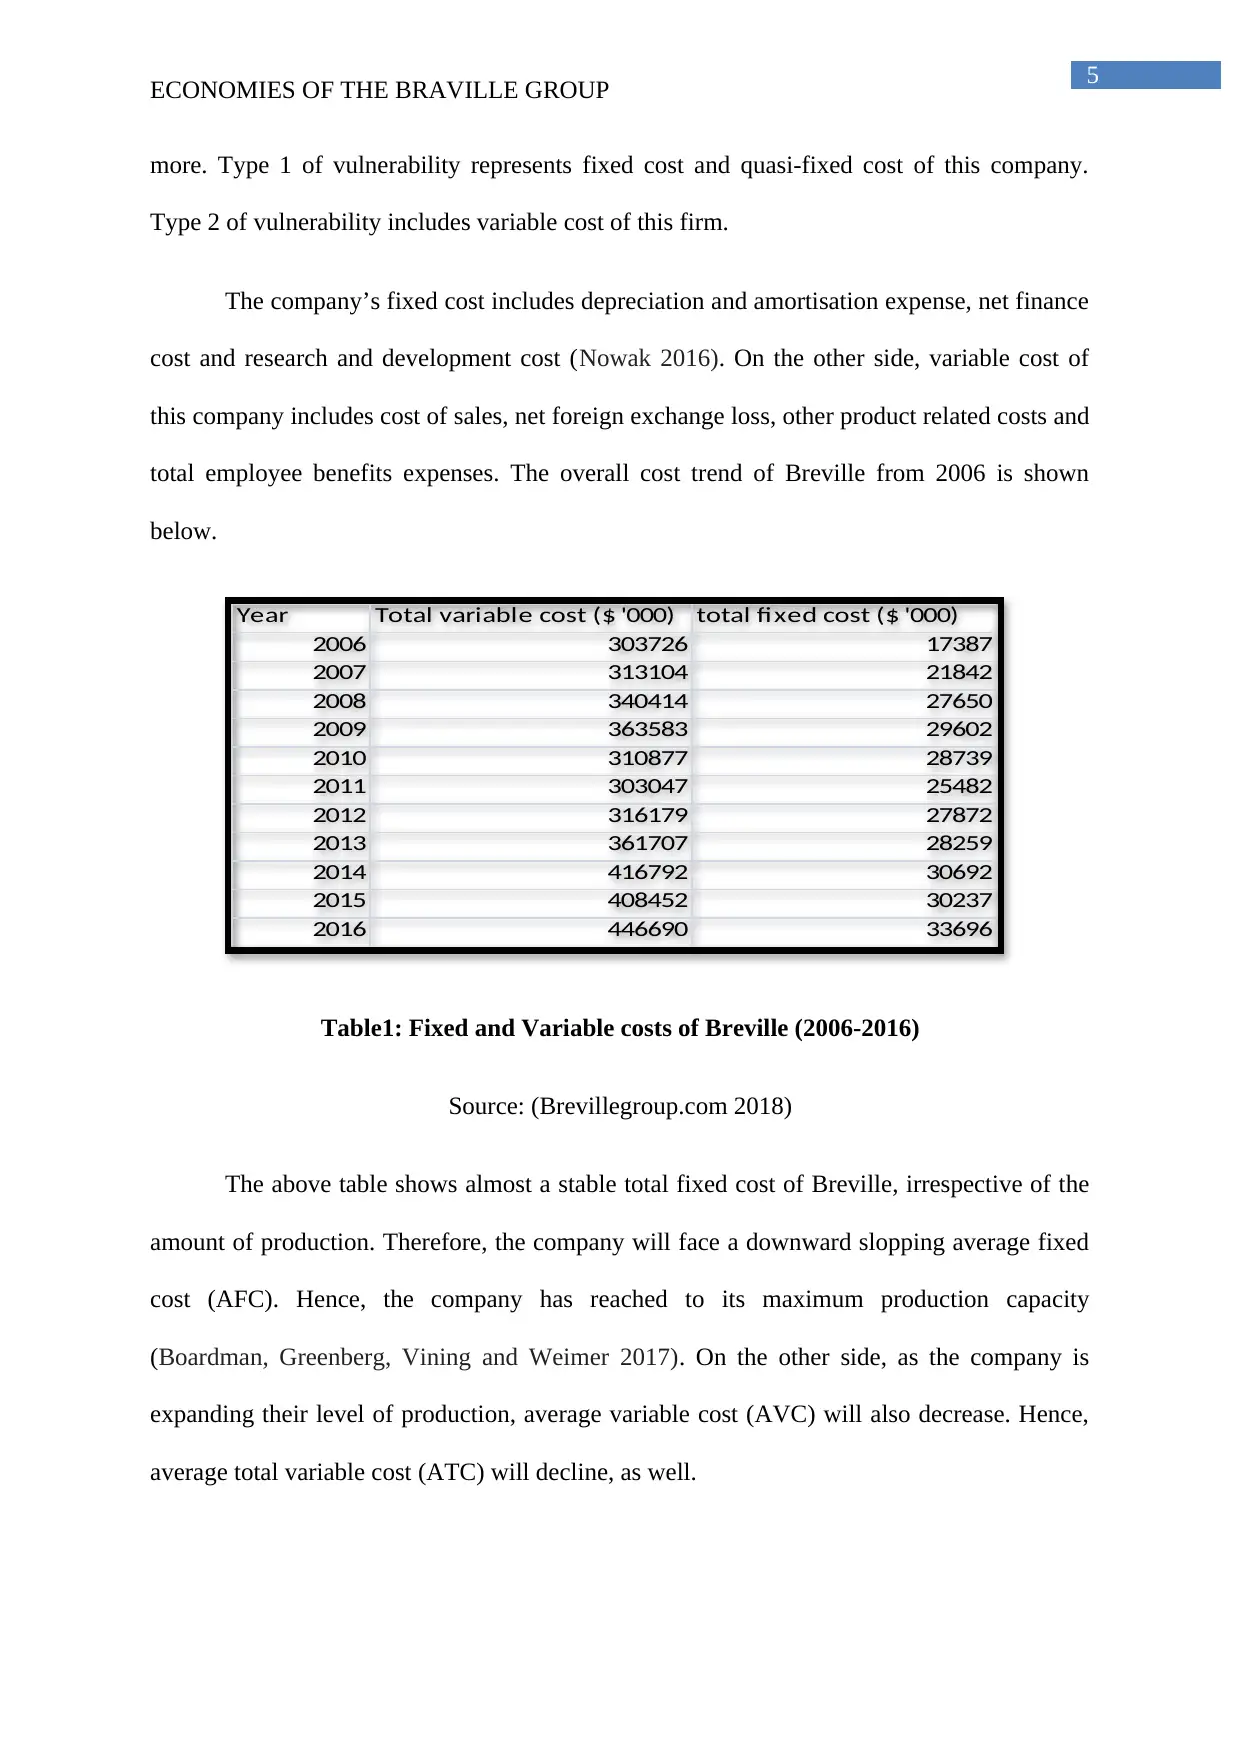
The company’s fixed cost includes depreciation and amortisation expense, net finance
cost and research and development cost (Nowak 2016). On the other side, variable cost of
this company includes cost of sales, net foreign exchange loss, other product related costs and
total employee benefits expenses. The overall cost trend of Breville from 2006 is shown
below.
Table1: Fixed and Variable costs of Breville (2006-2016)
Source: (Brevillegroup.com 2018)
The above table shows almost a stable total fixed cost of Breville, irrespective of the
amount of production. Therefore, the company will face a downward slopping average fixed
cost (AFC). Hence, the company has reached to its maximum production capacity
(Boardman, Greenberg, Vining and Weimer 2017). On the other side, as the company is
expanding their level of production, average variable cost (AVC) will also decrease. Hence,
average total variable cost (ATC) will decline, as well.
Year Total variable cost ($ '000) total fixed cost ($ '000)
2006 303726 17387
2007 313104 21842
2008 340414 27650
2009 363583 29602
2010 310877 28739
2011 303047 25482
2012 316179 27872
2013 361707 28259
2014 416792 30692
2015 408452 30237
2016 446690 33696
ECONOMIES OF THE BRAVILLE GROUP
more. Type 1 of vulnerability represents fixed cost and quasi-fixed cost of this company.
Type 2 of vulnerability includes variable cost of this firm.
The company’s fixed cost includes depreciation and amortisation expense, net finance
cost and research and development cost (Nowak 2016). On the other side, variable cost of
this company includes cost of sales, net foreign exchange loss, other product related costs and
total employee benefits expenses. The overall cost trend of Breville from 2006 is shown
below.
Table1: Fixed and Variable costs of Breville (2006-2016)
Source: (Brevillegroup.com 2018)
The above table shows almost a stable total fixed cost of Breville, irrespective of the
amount of production. Therefore, the company will face a downward slopping average fixed
cost (AFC). Hence, the company has reached to its maximum production capacity
(Boardman, Greenberg, Vining and Weimer 2017). On the other side, as the company is
expanding their level of production, average variable cost (AVC) will also decrease. Hence,
average total variable cost (ATC) will decline, as well.
Year Total variable cost ($ '000) total fixed cost ($ '000)
2006 303726 17387
2007 313104 21842
2008 340414 27650
2009 363583 29602
2010 310877 28739
2011 303047 25482
2012 316179 27872
2013 361707 28259
2014 416792 30692
2015 408452 30237
2016 446690 33696
⊘ This is a preview!⊘
Do you want full access?
Subscribe today to unlock all pages.
Trusted by 1+ million students worldwide
AFC
AVC
AC
Output
AC, AVC, AFC
O
6
ECONOMIES OF THE BRAVILLE GROUP
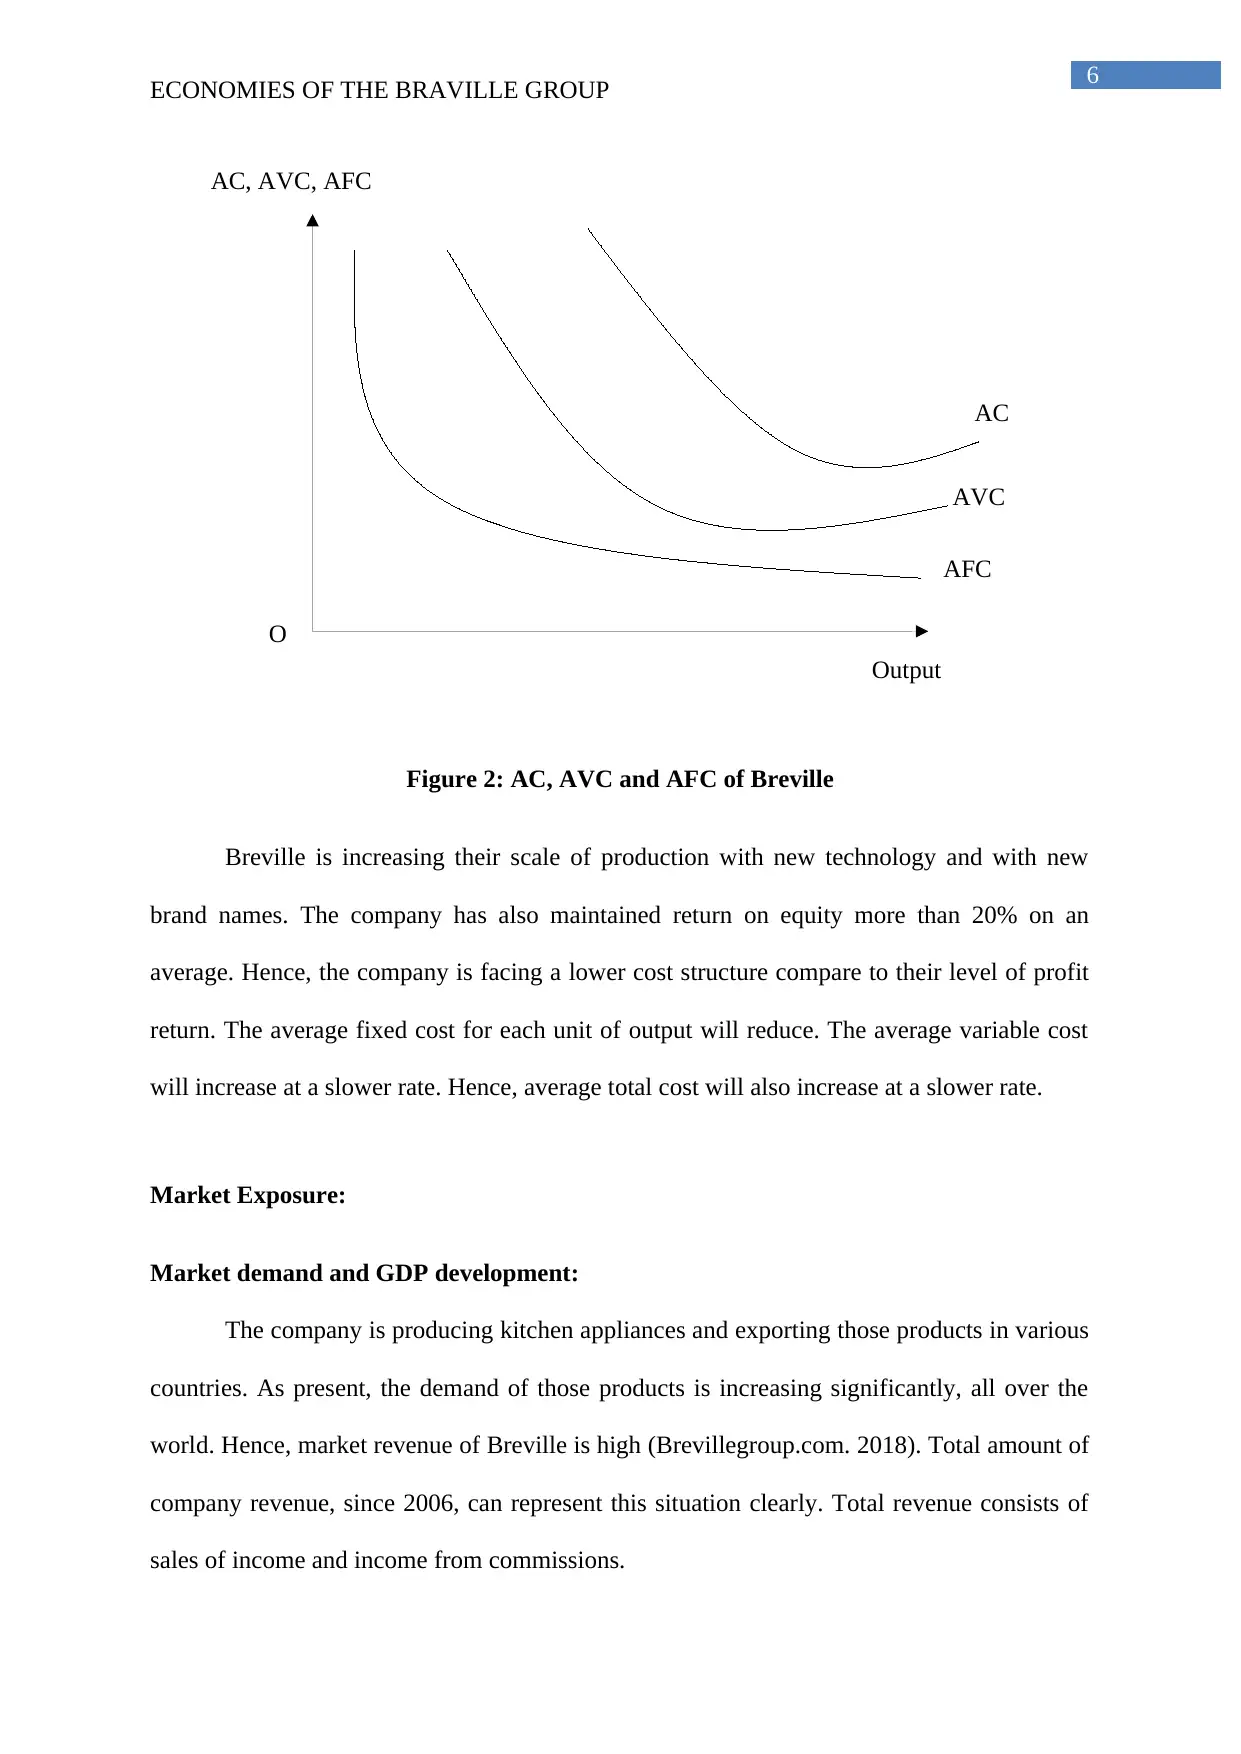
Figure 2: AC, AVC and AFC of Breville
Breville is increasing their scale of production with new technology and with new
brand names. The company has also maintained return on equity more than 20% on an
average. Hence, the company is facing a lower cost structure compare to their level of profit
return. The average fixed cost for each unit of output will reduce. The average variable cost
will increase at a slower rate. Hence, average total cost will also increase at a slower rate.
Market Exposure:
Market demand and GDP development:
The company is producing kitchen appliances and exporting those products in various
countries. As present, the demand of those products is increasing significantly, all over the
world. Hence, market revenue of Breville is high (Brevillegroup.com. 2018). Total amount of
company revenue, since 2006, can represent this situation clearly. Total revenue consists of
sales of income and income from commissions.
AVC
AC
Output
AC, AVC, AFC
O
6
ECONOMIES OF THE BRAVILLE GROUP
Figure 2: AC, AVC and AFC of Breville
Breville is increasing their scale of production with new technology and with new
brand names. The company has also maintained return on equity more than 20% on an
average. Hence, the company is facing a lower cost structure compare to their level of profit
return. The average fixed cost for each unit of output will reduce. The average variable cost
will increase at a slower rate. Hence, average total cost will also increase at a slower rate.
Market Exposure:
Market demand and GDP development:
The company is producing kitchen appliances and exporting those products in various
countries. As present, the demand of those products is increasing significantly, all over the
world. Hence, market revenue of Breville is high (Brevillegroup.com. 2018). Total amount of
company revenue, since 2006, can represent this situation clearly. Total revenue consists of
sales of income and income from commissions.
Paraphrase This Document
Need a fresh take? Get an instant paraphrase of this document with our AI Paraphraser
7
ECONOMIES OF THE BRAVILLE GROUP
2006 2007 2008 2009 2010 2011 2012 2013 2014 2015 2016 2017
0
100000
200000
300000
400000
500000
600000
700000
Total revenue ($ '000)
Total revenue ($ '000)
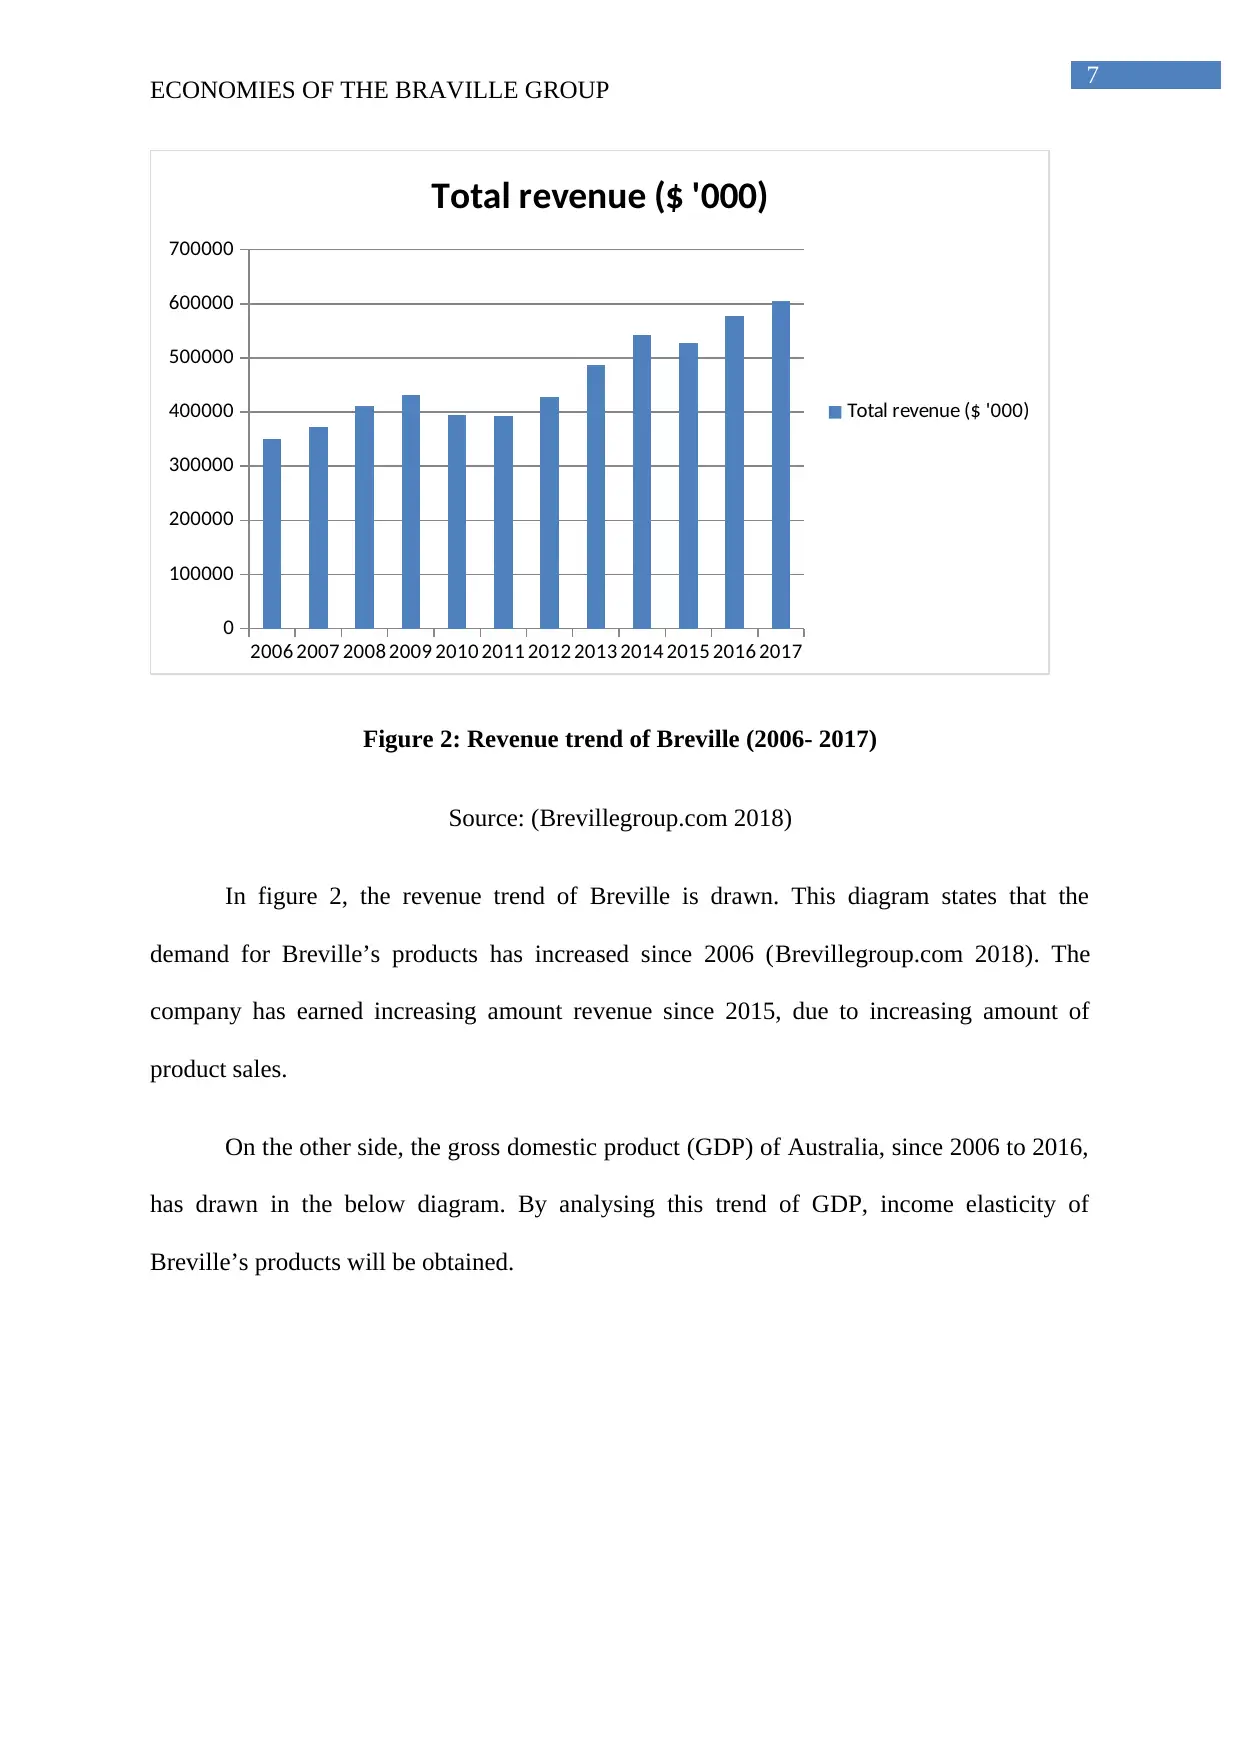
Figure 2: Revenue trend of Breville (2006- 2017)
Source: (Brevillegroup.com 2018)
In figure 2, the revenue trend of Breville is drawn. This diagram states that the
demand for Breville’s products has increased since 2006 (Brevillegroup.com 2018). The
company has earned increasing amount revenue since 2015, due to increasing amount of
product sales.
On the other side, the gross domestic product (GDP) of Australia, since 2006 to 2016,
has drawn in the below diagram. By analysing this trend of GDP, income elasticity of
Breville’s products will be obtained.
ECONOMIES OF THE BRAVILLE GROUP
2006 2007 2008 2009 2010 2011 2012 2013 2014 2015 2016 2017
0
100000
200000
300000
400000
500000
600000
700000
Total revenue ($ '000)
Total revenue ($ '000)
Figure 2: Revenue trend of Breville (2006- 2017)
Source: (Brevillegroup.com 2018)
In figure 2, the revenue trend of Breville is drawn. This diagram states that the
demand for Breville’s products has increased since 2006 (Brevillegroup.com 2018). The
company has earned increasing amount revenue since 2015, due to increasing amount of
product sales.
On the other side, the gross domestic product (GDP) of Australia, since 2006 to 2016,
has drawn in the below diagram. By analysing this trend of GDP, income elasticity of
Breville’s products will be obtained.
8
ECONOMIES OF THE BRAVILLE GROUP
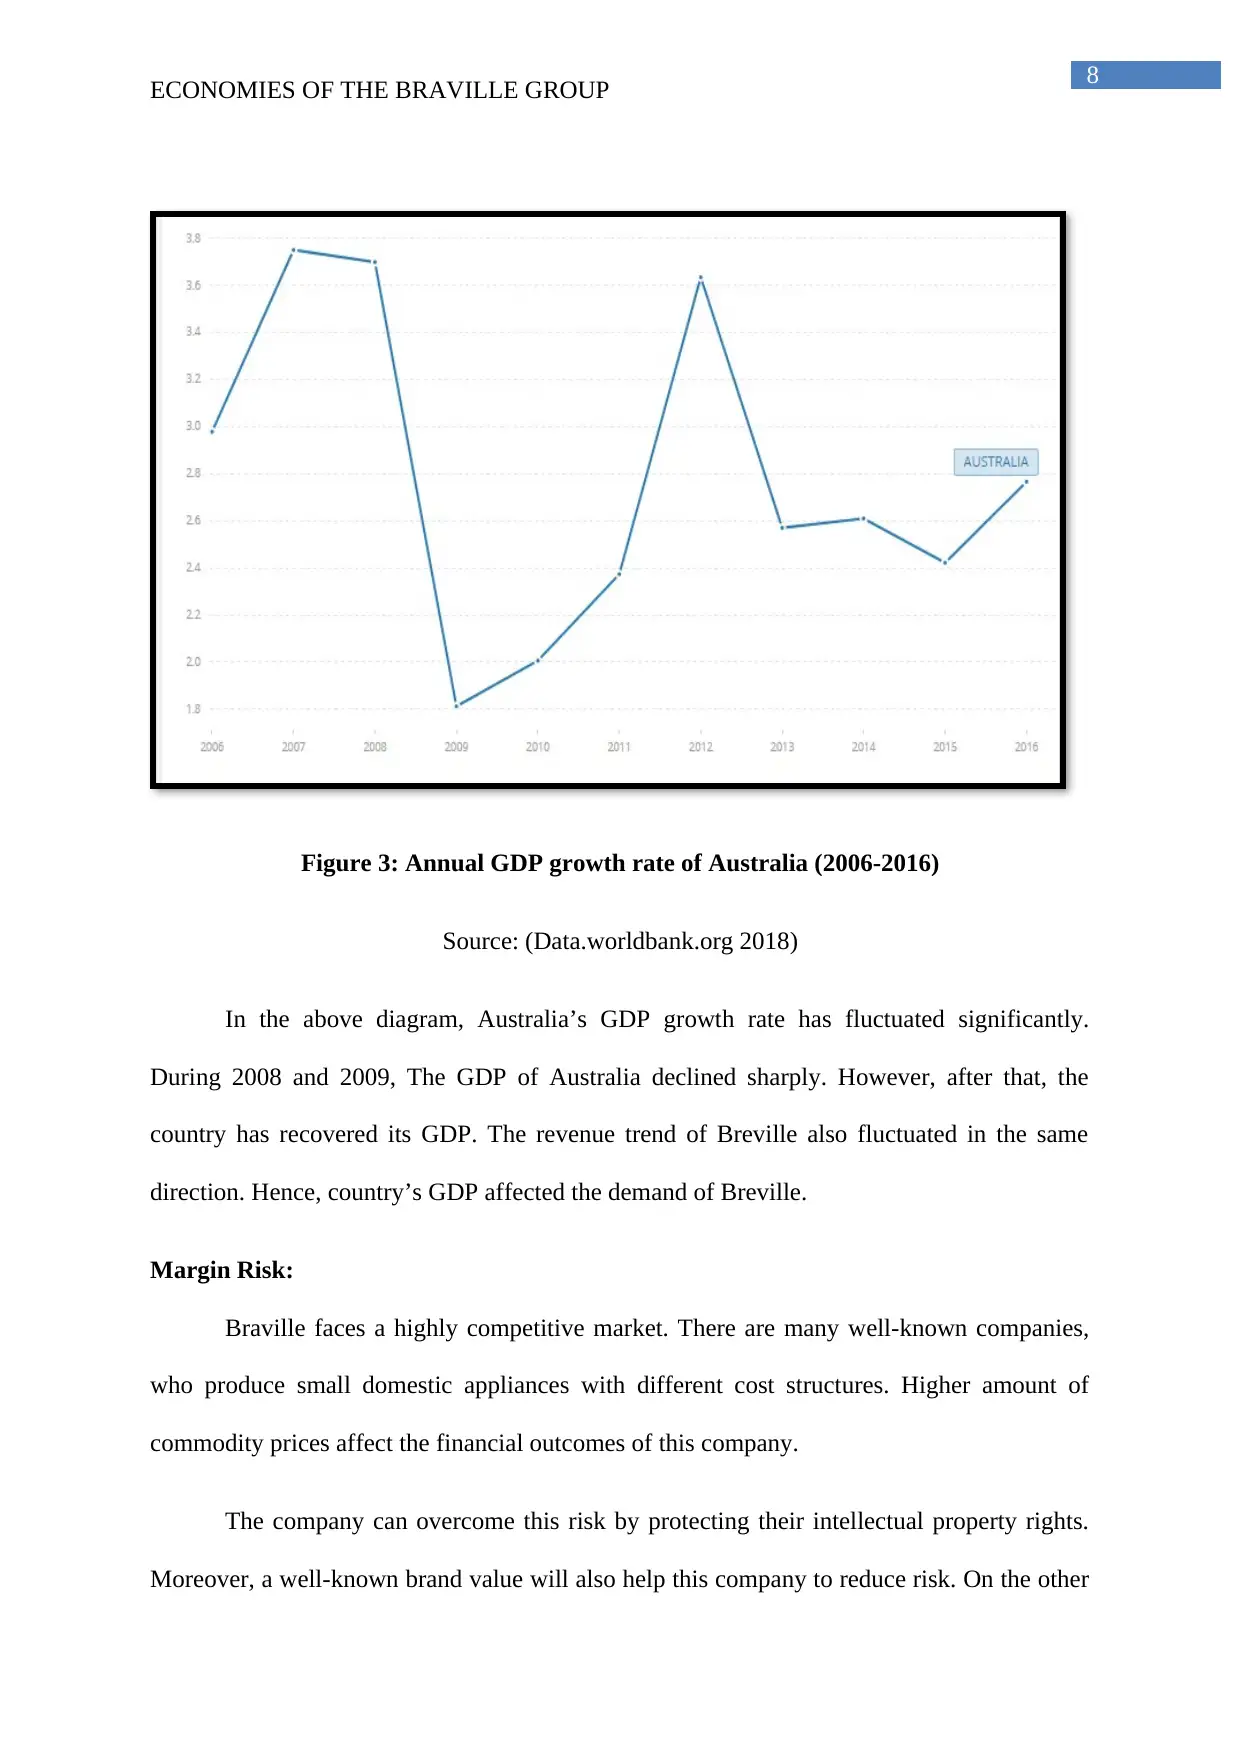
Figure 3: Annual GDP growth rate of Australia (2006-2016)
Source: (Data.worldbank.org 2018)
In the above diagram, Australia’s GDP growth rate has fluctuated significantly.
During 2008 and 2009, The GDP of Australia declined sharply. However, after that, the
country has recovered its GDP. The revenue trend of Breville also fluctuated in the same
direction. Hence, country’s GDP affected the demand of Breville.
Margin Risk:
Braville faces a highly competitive market. There are many well-known companies,
who produce small domestic appliances with different cost structures. Higher amount of
commodity prices affect the financial outcomes of this company.
The company can overcome this risk by protecting their intellectual property rights.
Moreover, a well-known brand value will also help this company to reduce risk. On the other
ECONOMIES OF THE BRAVILLE GROUP
Figure 3: Annual GDP growth rate of Australia (2006-2016)
Source: (Data.worldbank.org 2018)
In the above diagram, Australia’s GDP growth rate has fluctuated significantly.
During 2008 and 2009, The GDP of Australia declined sharply. However, after that, the
country has recovered its GDP. The revenue trend of Breville also fluctuated in the same
direction. Hence, country’s GDP affected the demand of Breville.
Margin Risk:
Braville faces a highly competitive market. There are many well-known companies,
who produce small domestic appliances with different cost structures. Higher amount of
commodity prices affect the financial outcomes of this company.
The company can overcome this risk by protecting their intellectual property rights.
Moreover, a well-known brand value will also help this company to reduce risk. On the other
⊘ This is a preview!⊘
Do you want full access?
Subscribe today to unlock all pages.
Trusted by 1+ million students worldwide
9
ECONOMIES OF THE BRAVILLE GROUP
side, the company can introduce new products and can extend variability of their products
within its cost structure. The company can also expand their business by maintain a good
relation with their long-term suppliers.
Interest rate risk:
Breville is expecting its interest rate risk on its cash balances, borrowings and
derivative financial instruments. The company’s policy is to maintain its interest rate risk,
applying a mix of variable and fixed rate debt where applicable. Facilities related to cash
advance have fixed-interest rates of short-term with1 to 3 months of maturities . Hence, they
are expected to face interest rate risk within the financial year.
At the end of June 2016, the group did not have any borrowings at a fixed interest
rate. All borrowings are exposed to floating rates.
Marker competition:
Due to huge competition, Breville’s annual profit declined in 2013. After that, this
profit rate was decreasing continuously, since 2015. There are various large and small
companies, who produce kitchen appliances, in the world market. For the same product, some
well-known companies are charging lower-price compare to Breville. The net profit was
declined by 4.3% between 2014 and 2015 (Brevillegroup.com 2018). Moreover,
strengthening U.S dollar also affected the cost pattern of this company. Rising level of costs
help the company to increase its cost level. Breville owns popular brands like Kambrook and
Ronson. However, 2014 and 2015 were very difficult and challenging year for them. Various
discount stores are trying to sale their own home products with cheap prices and trying to
capture markets of Kambrook and Ronson.
However, increasing level of product prices and cost efficiency cannot completely
offset the negative volume of product and currency impact. Its other brands help the company
Paraphrase This Document
Need a fresh take? Get an instant paraphrase of this document with our AI Paraphraser
10
ECONOMIES OF THE BRAVILLE GROUP
to increase the company revenue. In U.K, Sage brand has promoted its new products with
well-known persons and helped them to earn double amount of revenue. On the other side,
Breville performed strongly in North America, during 2014 and 2015. They earned more than
24% of total revenue compare to previous year (Brevillegroup.com 2018).
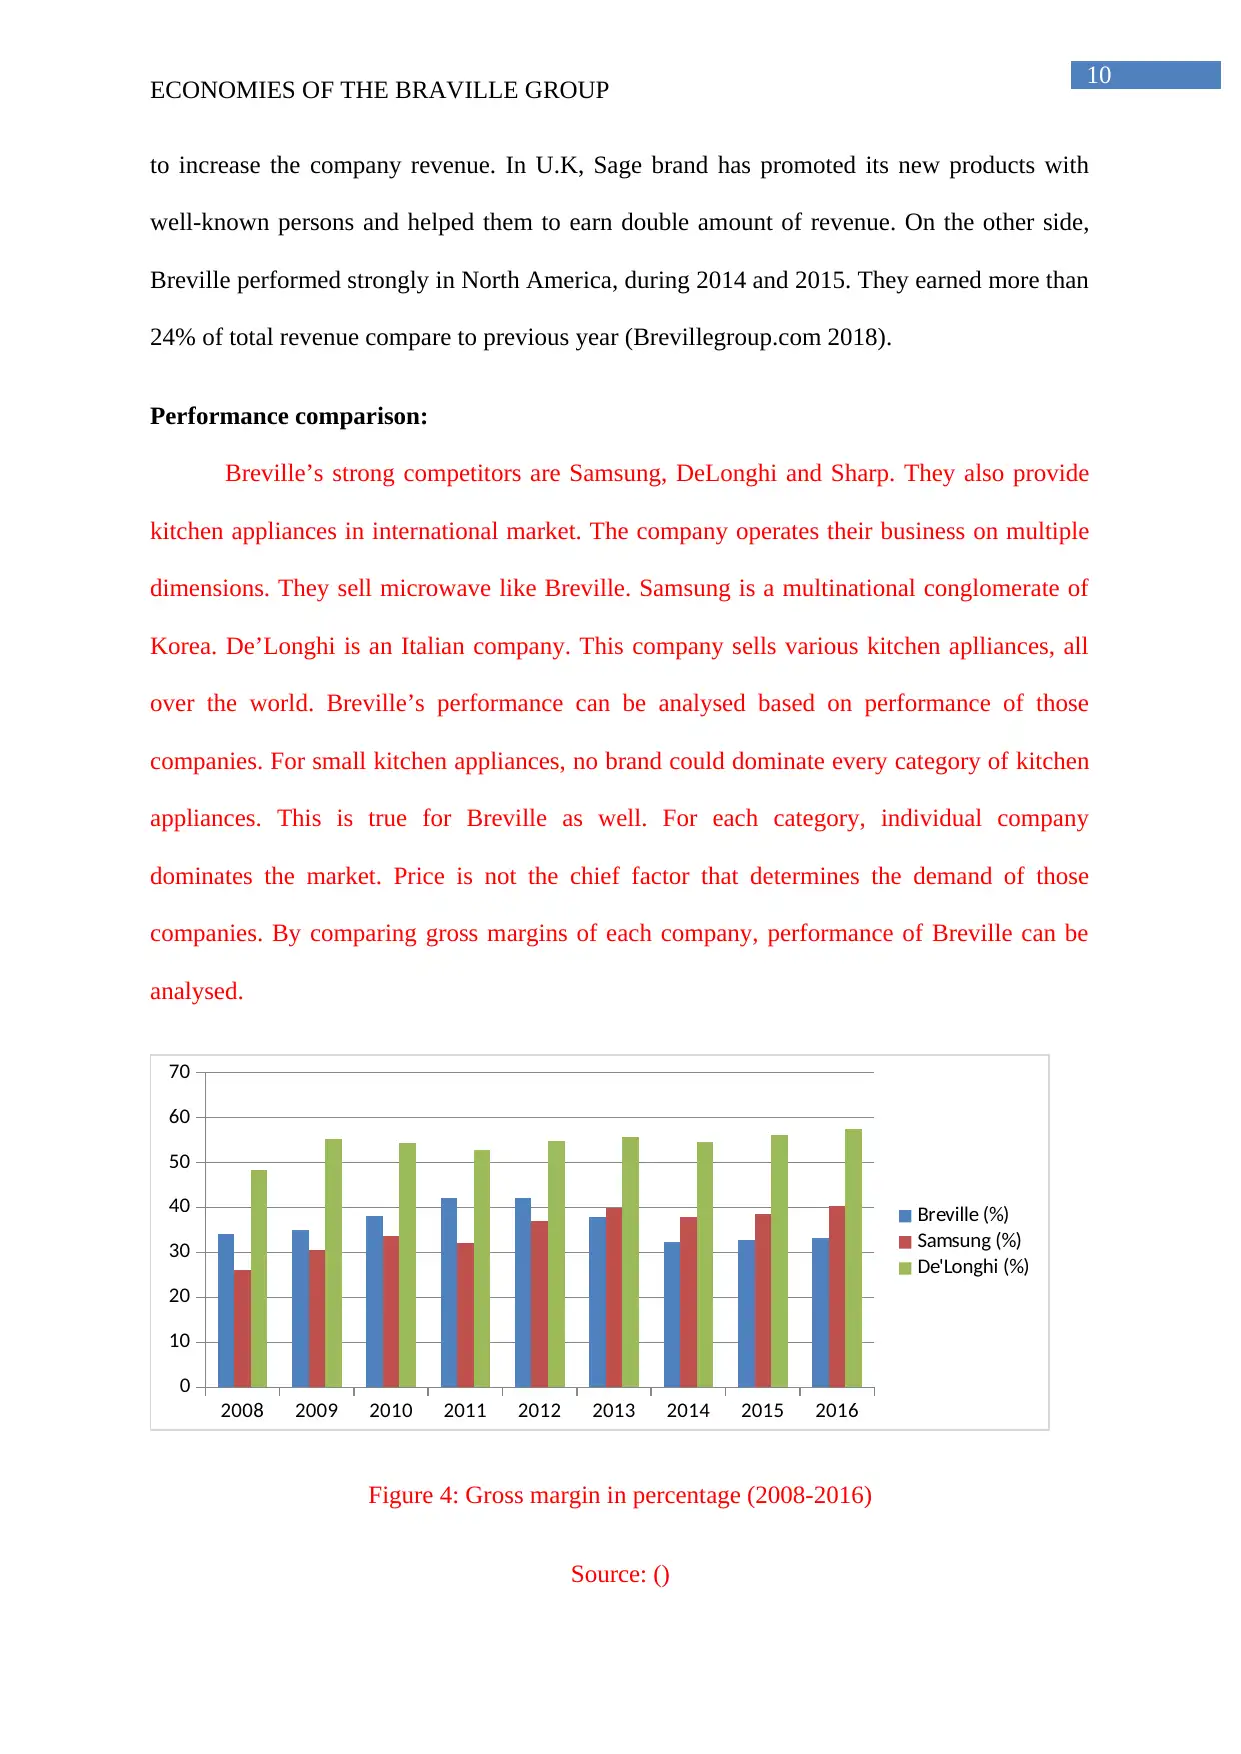
Performance comparison:
Breville’s strong competitors are Samsung, DeLonghi and Sharp. They also provide
kitchen appliances in international market. The company operates their business on multiple
dimensions. They sell microwave like Breville. Samsung is a multinational conglomerate of
Korea. De’Longhi is an Italian company. This company sells various kitchen aplliances, all
over the world. Breville’s performance can be analysed based on performance of those
companies. For small kitchen appliances, no brand could dominate every category of kitchen
appliances. This is true for Breville as well. For each category, individual company
dominates the market. Price is not the chief factor that determines the demand of those
companies. By comparing gross margins of each company, performance of Breville can be
analysed.
2008 2009 2010 2011 2012 2013 2014 2015 2016
0
10
20
30
40
50
60
70
Breville (%)
Samsung (%)
De'Longhi (%)
Figure 4: Gross margin in percentage (2008-2016)
Source: ()
ECONOMIES OF THE BRAVILLE GROUP
to increase the company revenue. In U.K, Sage brand has promoted its new products with
well-known persons and helped them to earn double amount of revenue. On the other side,
Breville performed strongly in North America, during 2014 and 2015. They earned more than
24% of total revenue compare to previous year (Brevillegroup.com 2018).
Performance comparison:
Breville’s strong competitors are Samsung, DeLonghi and Sharp. They also provide
kitchen appliances in international market. The company operates their business on multiple
dimensions. They sell microwave like Breville. Samsung is a multinational conglomerate of
Korea. De’Longhi is an Italian company. This company sells various kitchen aplliances, all
over the world. Breville’s performance can be analysed based on performance of those
companies. For small kitchen appliances, no brand could dominate every category of kitchen
appliances. This is true for Breville as well. For each category, individual company
dominates the market. Price is not the chief factor that determines the demand of those
companies. By comparing gross margins of each company, performance of Breville can be
analysed.
2008 2009 2010 2011 2012 2013 2014 2015 2016
0
10
20
30
40
50
60
70
Breville (%)
Samsung (%)
De'Longhi (%)
Figure 4: Gross margin in percentage (2008-2016)
Source: ()
11
ECONOMIES OF THE BRAVILLE GROUP
The gross margin of De’Longhi was high since 2008. Breville was a strong
competition with Samsung during this period. However, not all products of Breville and
Samsung are equal.
Business strategy of Breville for 2008 and 2009:
In 2008, the chief objective of the company was to expand their business in
international market. Except this ongoing transformation, the group’s chief intension was to
increase the share of the company in a relatively mature market of Australia. Moreover, it
wanted to grow sustainable earnings and sales in international markets (Brevillegroup.com
2018). Breville decides to continue their investment in their core brand. The company
continued to invest for improving infrastructure.
In 2009, the company faced a tough time. Due to instable foreign exchange rates and
product prices, the company faced various difficulties. As a result, the company decided to
reduce their operating costs and maintained the working capital. However, the company kept
its strategic focus by doing investment on product design and innovation. They did it to
capture the changing financial and consumer market conditions (Brevillegroup.com 2018).
Breville did various structural changes and leadership composition to make a better future.
Breville chiefly focuses on revenue generation and marketing activities. The company
also applies its global strategy to control its other brands and brand partners, worldwide.
Macroeconomic Exposure:
Foreign currency exchange risk:
The company may face transactional exposure. The chief reason behind this is that the
customers pay in U.S dollar for buying products of this company. Transactional exposure
indicates the risk that any company can face because of international trade. When a country is
⊘ This is a preview!⊘
Do you want full access?
Subscribe today to unlock all pages.
Trusted by 1+ million students worldwide
1 out of 20
Related Documents


Your All-in-One AI-Powered Toolkit for Academic Success.
+13062052269
info@desklib.com
Available 24*7 on WhatsApp / Email
![[object Object]](/_next/static/media/star-bottom.7253800d.svg)
Unlock your academic potential
Copyright © 2020–2026 A2Z Services. All Rights Reserved. Developed and managed by ZUCOL.