Statistical Analysis of the 2016 Brexit Referendum Results Report

Verified

Added on  2022/09/07

|12
|2001
|19
Report
AI Summary
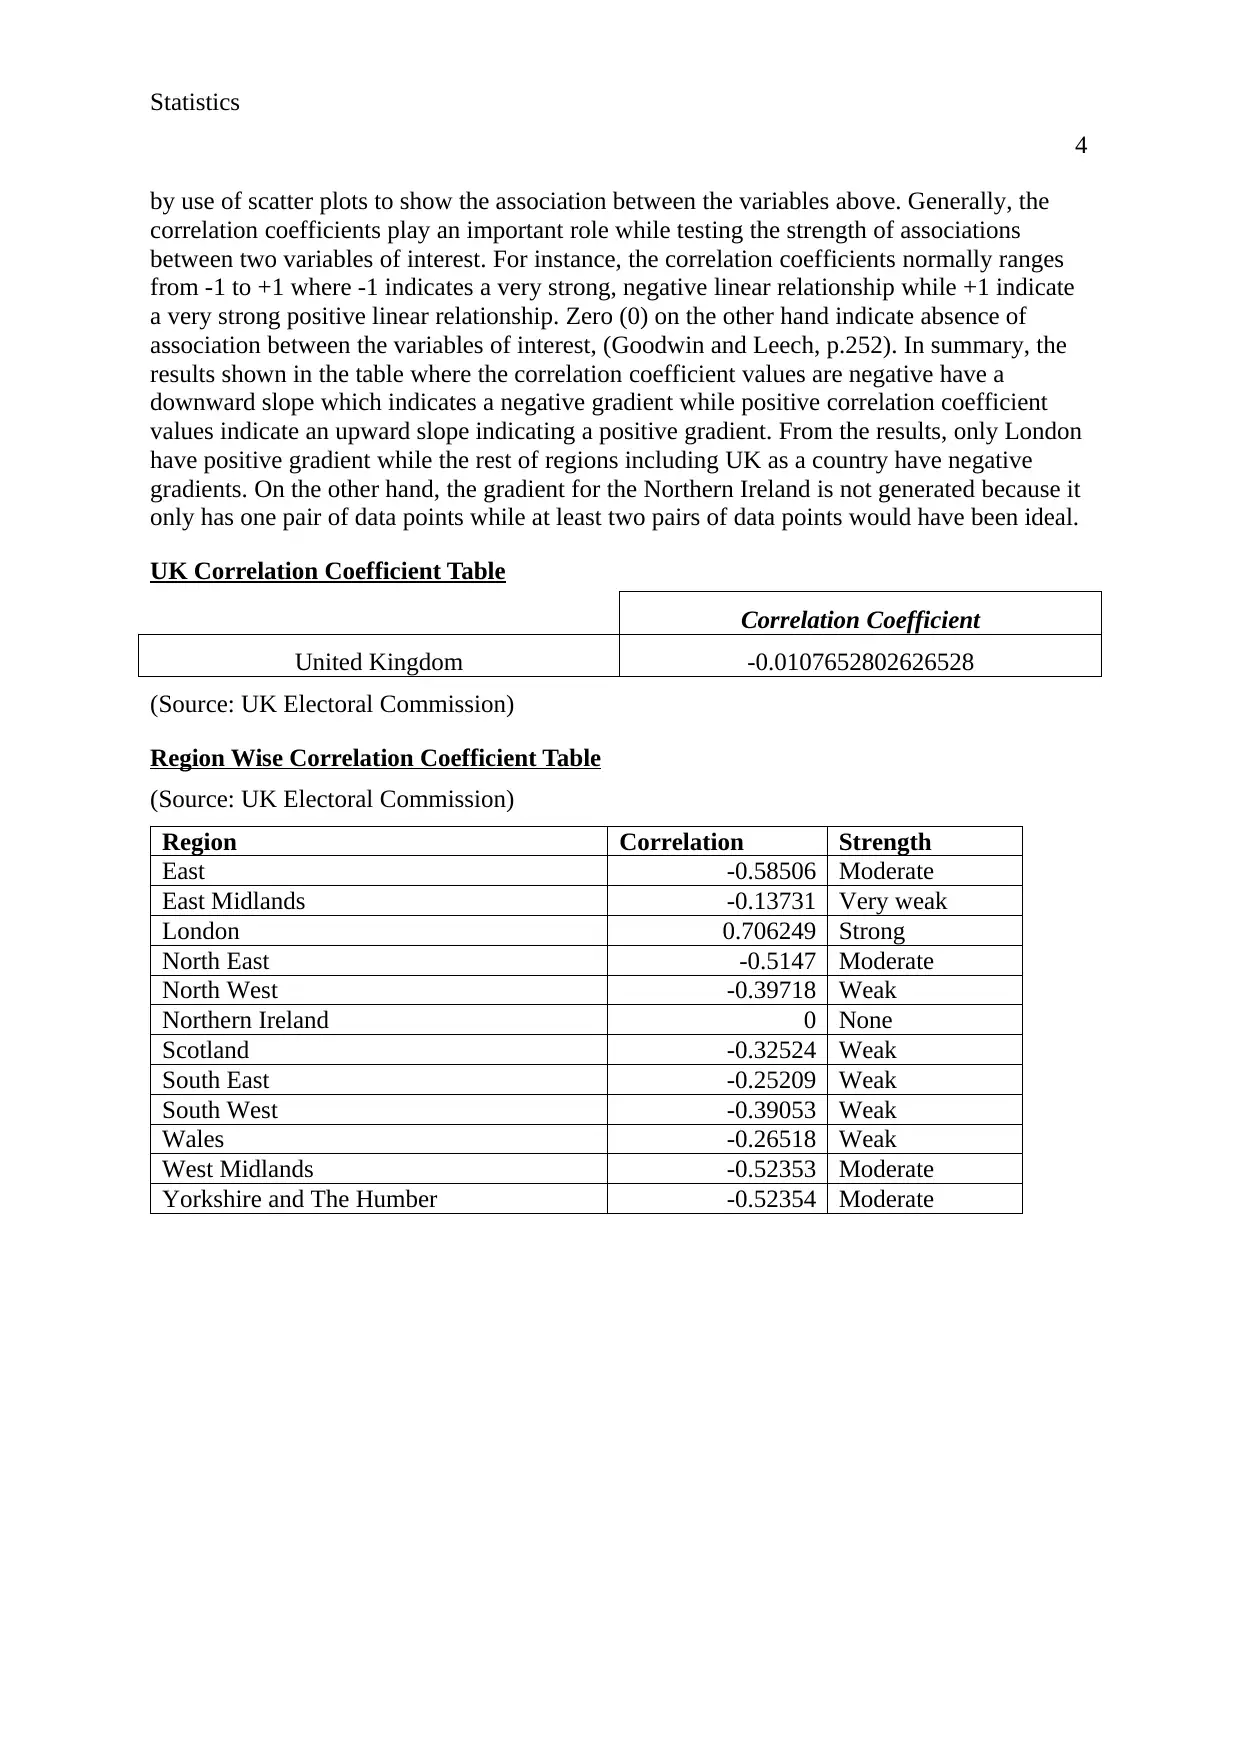
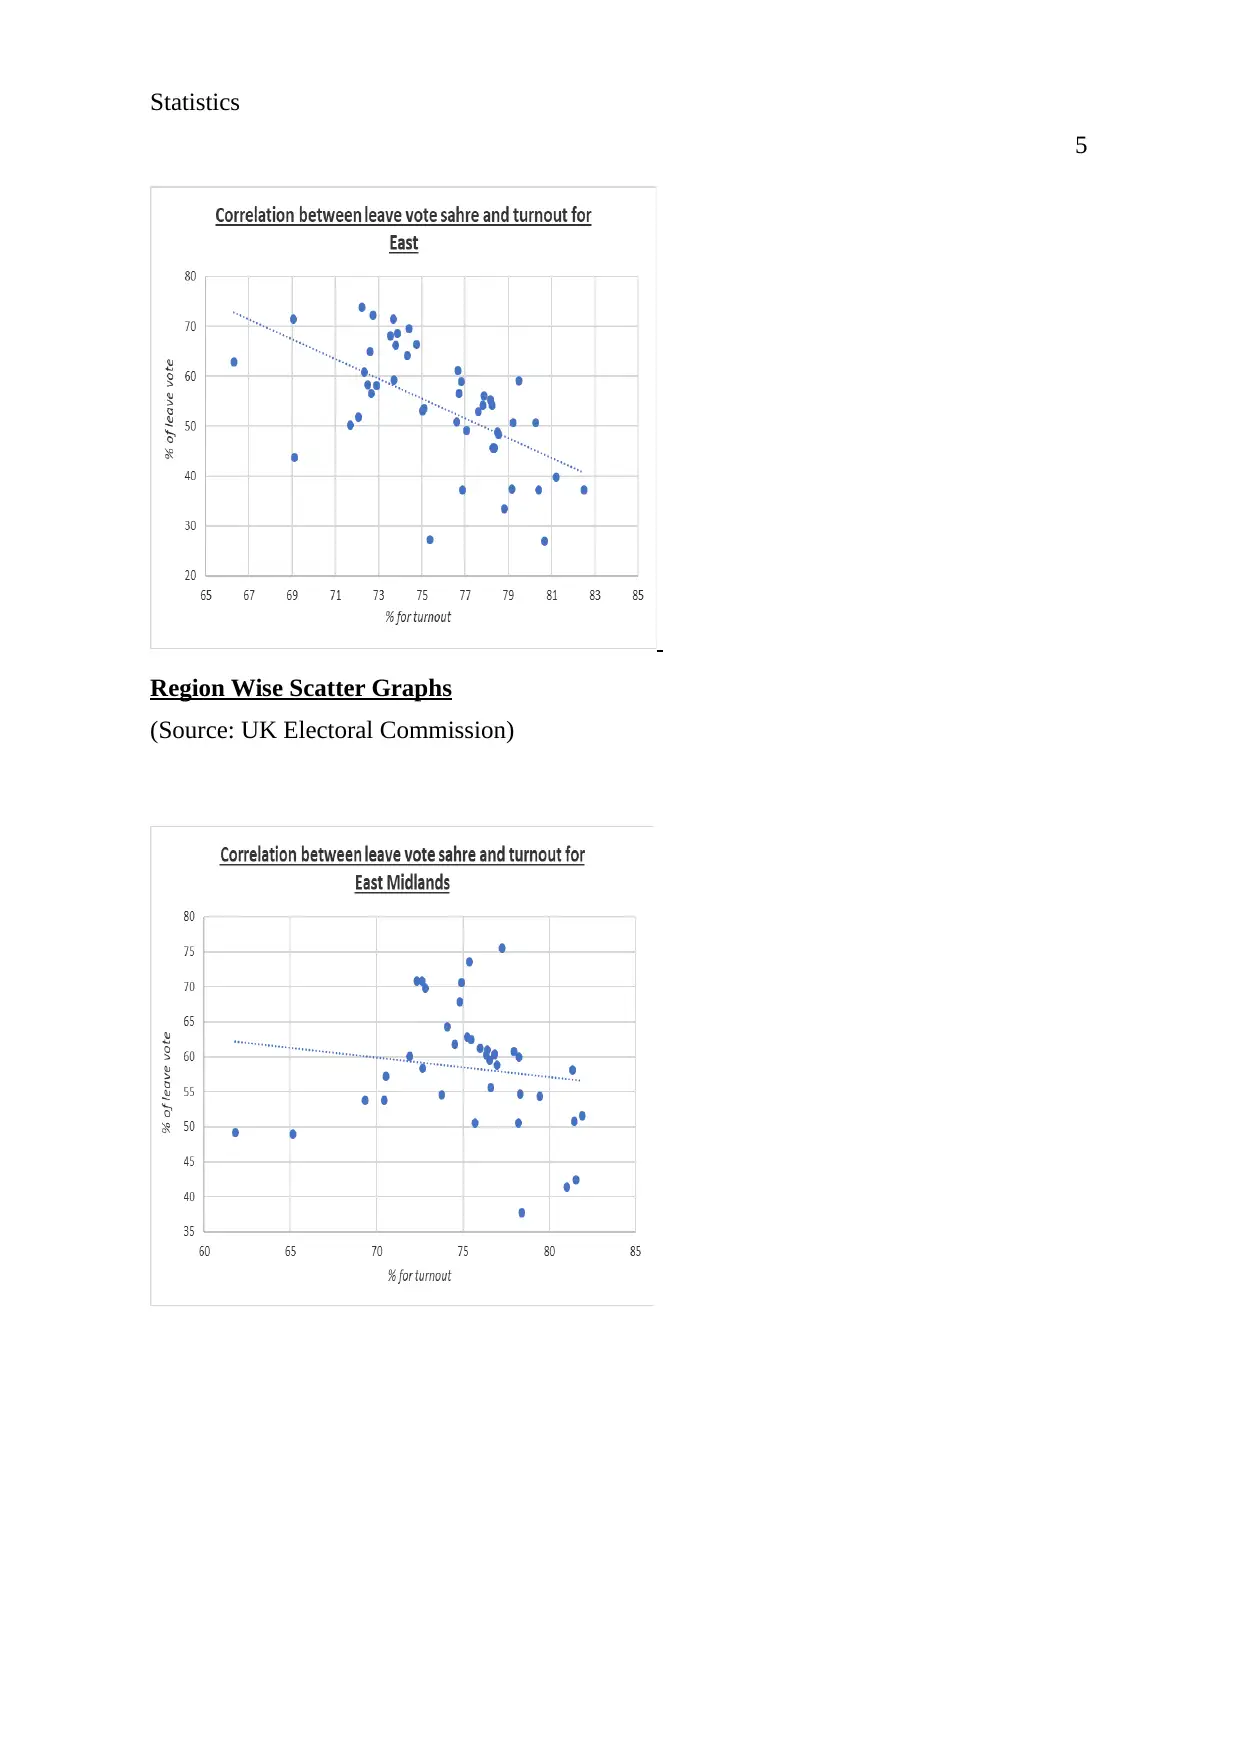
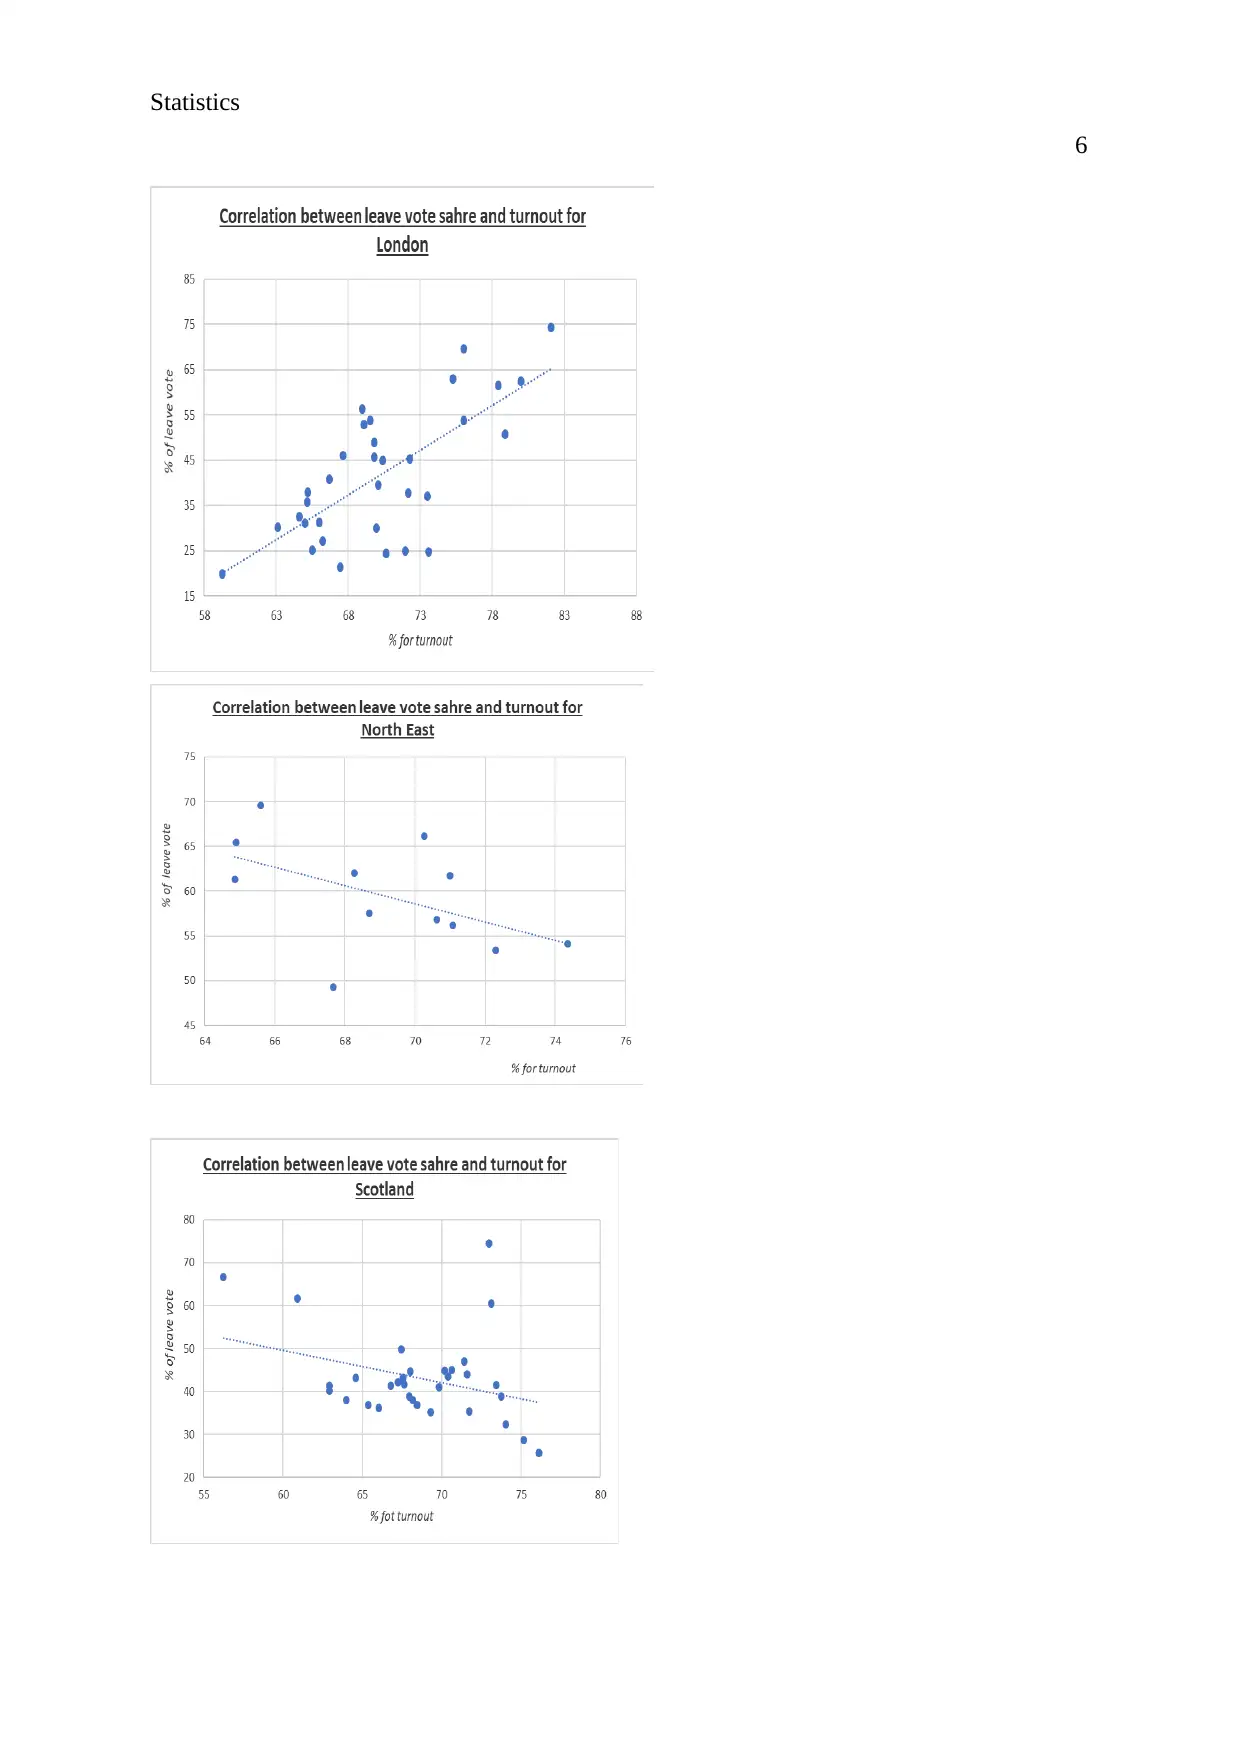
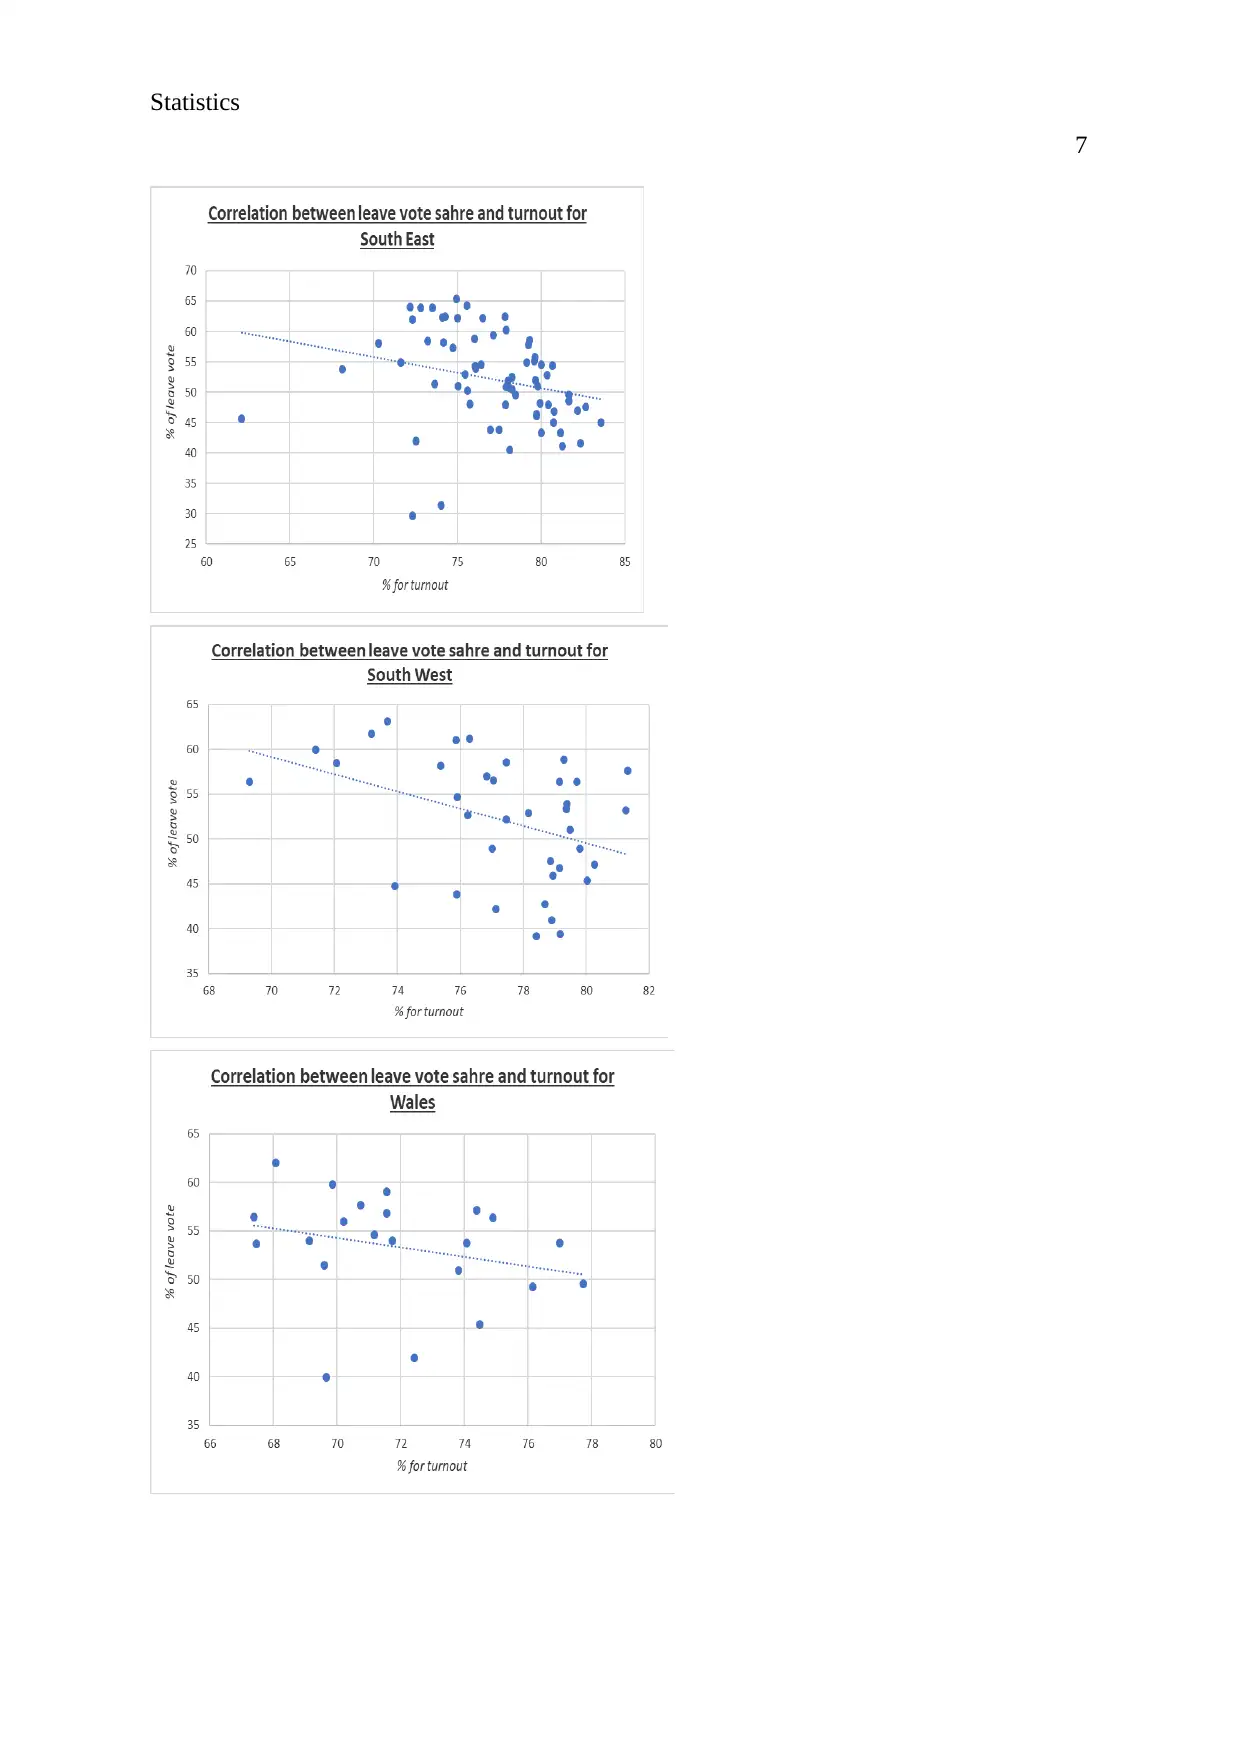
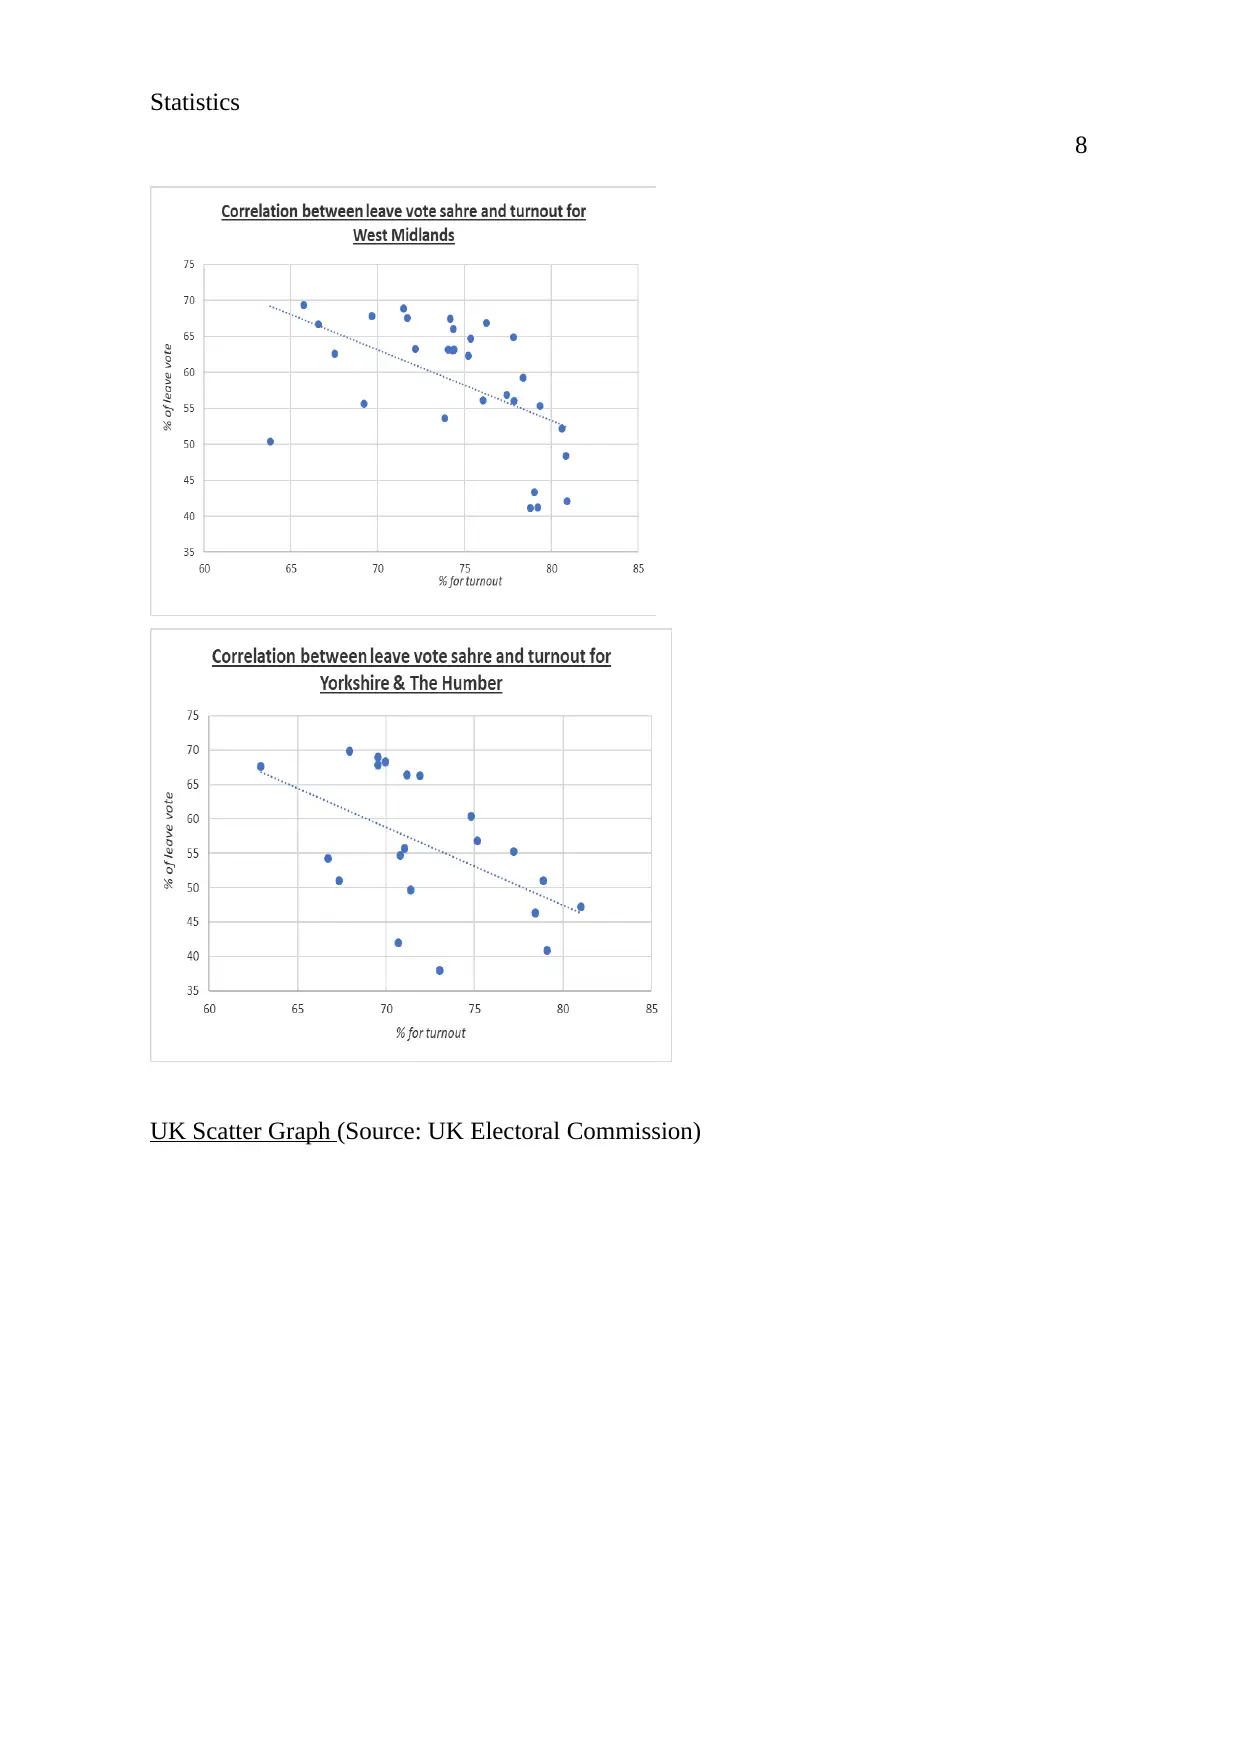
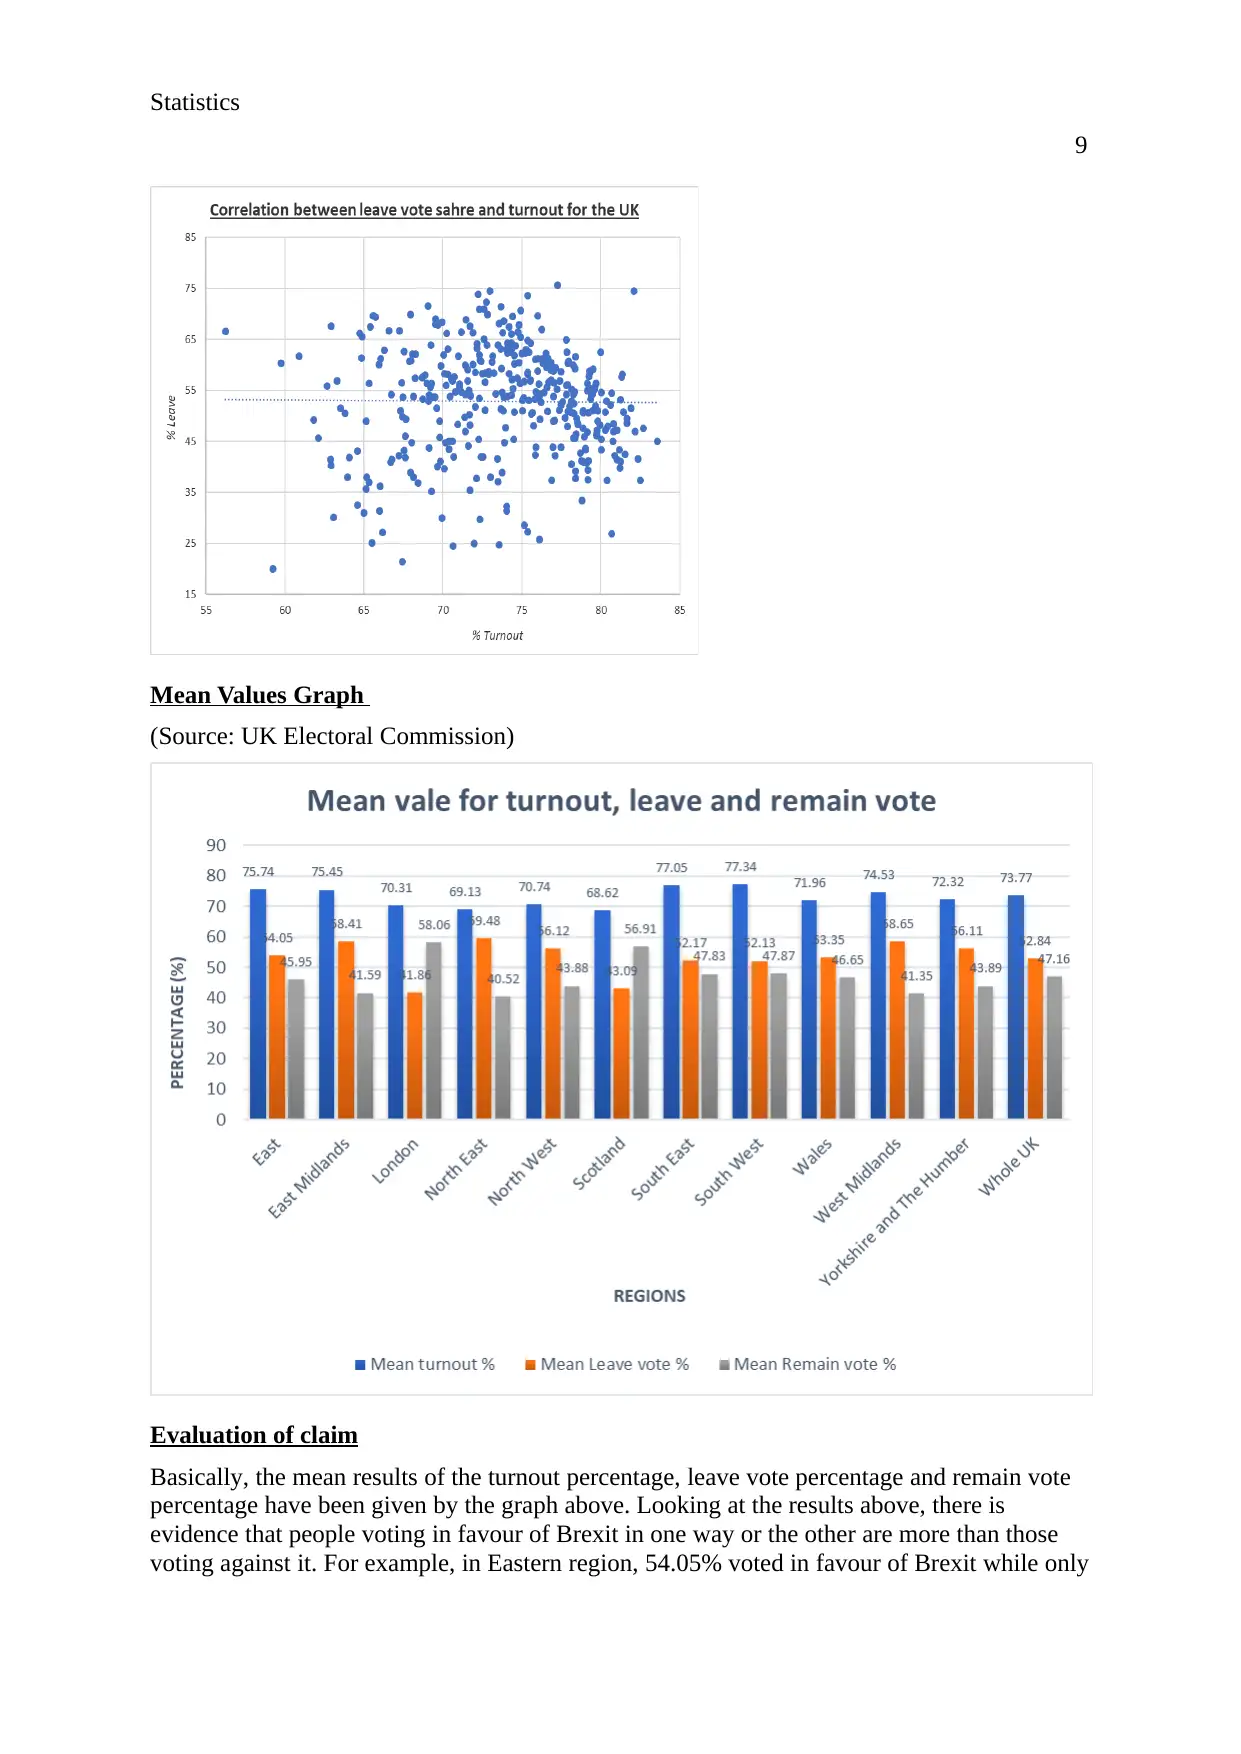
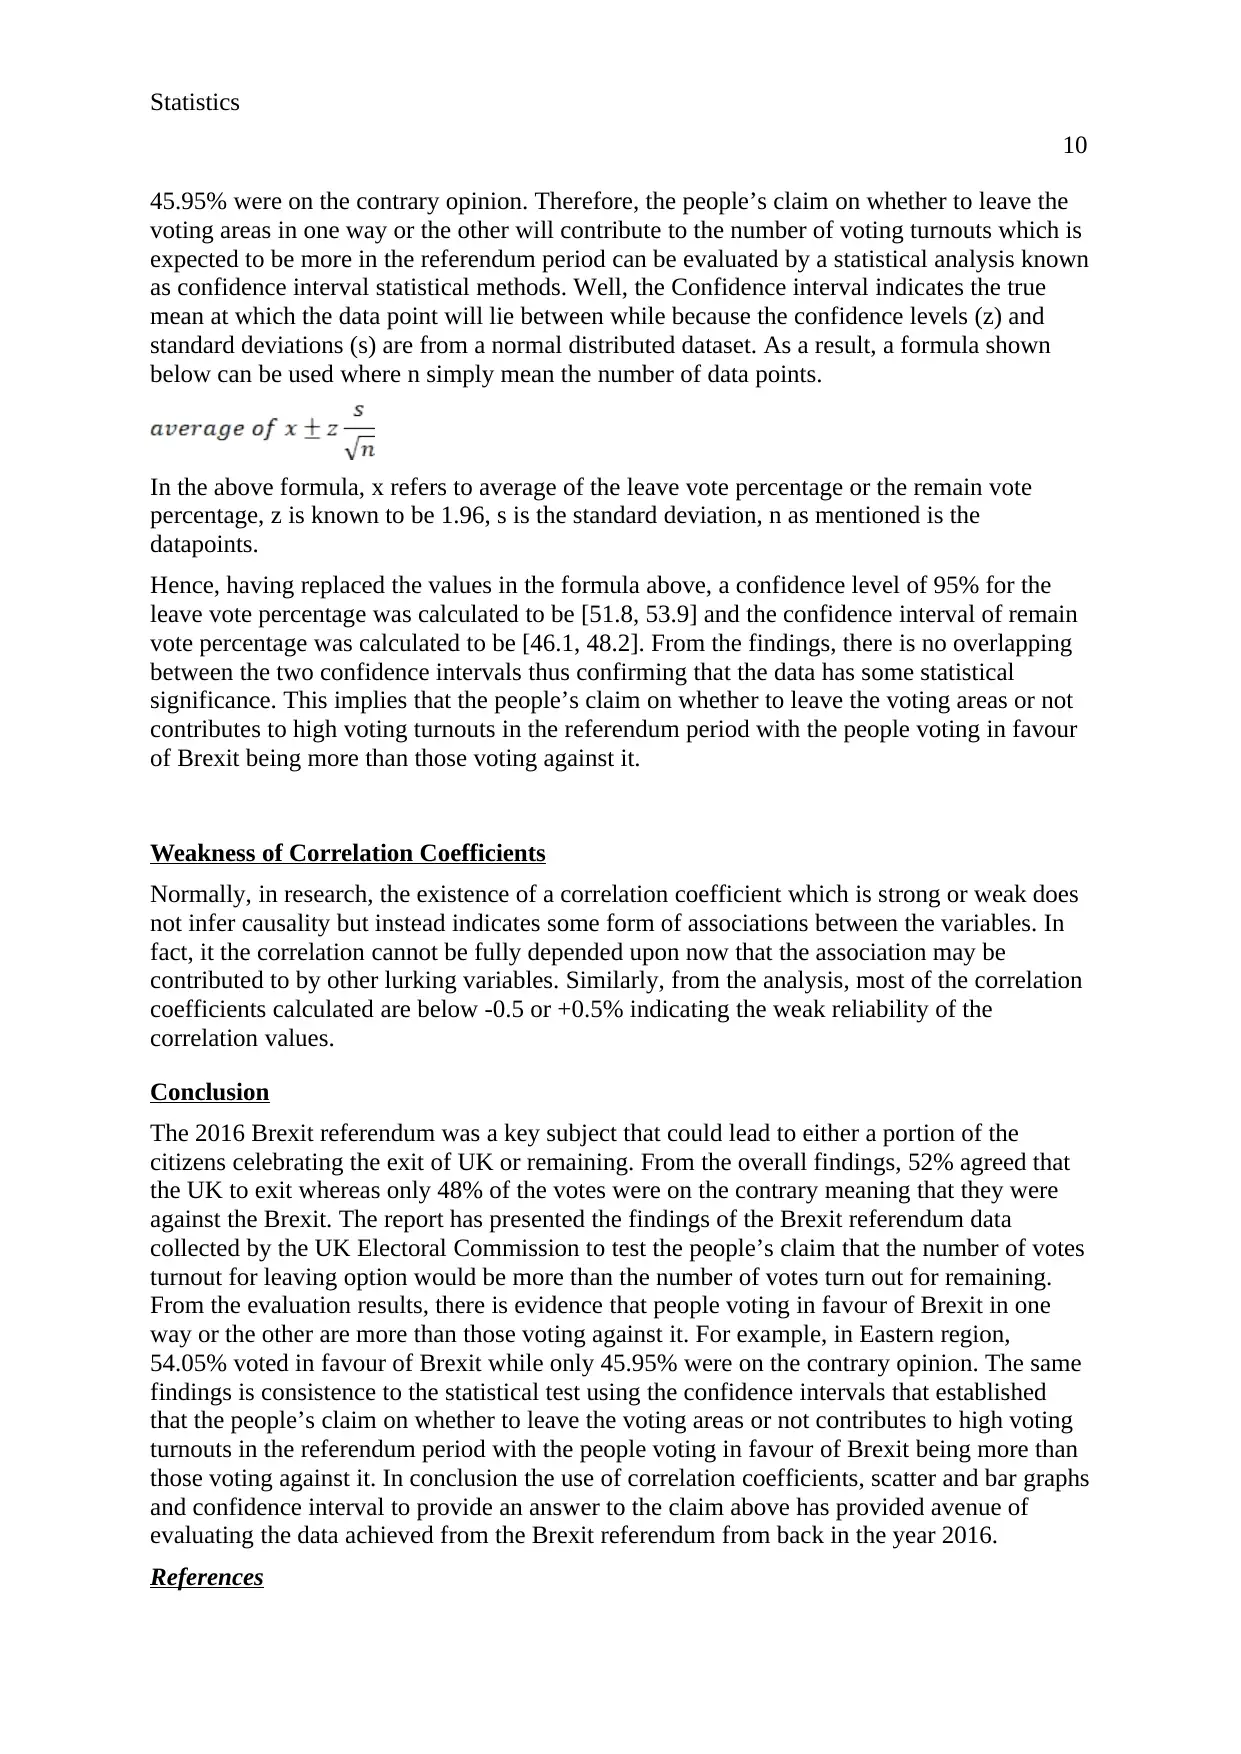
This report presents a statistical analysis of the 2016 Brexit referendum, examining the relationship between the leave vote share and voter turnout. The analysis includes an overview of the Brexit referendum, calculation of correlation coefficients for the UK as a whole and for each region, and the creation of scatter graphs to visualize the data. The report evaluates the claim that leave voting areas had a higher turnout, discussing the results and their implications. The analysis reveals a weak negative correlation between leave vote percentage and turnout percentage for the UK overall, with varied correlations across different regions, including a positive correlation in London. Scatter plots and mean value graphs are used to support the findings, and the limitations of correlation coefficients are also discussed, concluding with an evaluation of the initial claim based on the statistical evidence. The report also includes a discussion of the statistical significance of the findings using confidence intervals.
Document Page
Statistics
1
<University>
Statistics
<Author>
31 August 2024
<Professor’s name>
<Program of Study>
tabler-icon-diamond-filled.svg

Paraphrase This Document

Need a fresh take? Get an instant paraphrase of this document with our AI Paraphraser
Document Page
Statistics
2
Table of Contents
Introduction................................................................................................................................2
Overview of the Brexit Referendum..........................................................................................2
Summary of the Correlation Coefficient Values........................................................................2
Brief Explanation of the Correlation Coefficient.......................................................................2
UK Correlation Coefficient Table..............................................................................................3
Region Wise Correlation Coefficient Table...............................................................................3
Region Wise Scatter Graphs......................................................................................................4
Mean Values Graph....................................................................................................................8
Evaluation of claim....................................................................................................................8
Weakness of Correlation Coefficients........................................................................................9
Conclusion..................................................................................................................................9
Document Page
Statistics
3
Introduction
In the recent past, the most currently debated subjects in UK is the Brexit with the main areas
of interest being on the possible effects in terms of economy, social and political of the Brexit
in relation to United Kingdom, (Taylor-Gooby, 2017). Hence, the aim of the current report is to
present the analysis of the findings from the 2016 UK referendum results and evaluation of
the Brexit subject area of discussion, (Adler-Nissen, Galpin, and Rosamond, 2017). Through the
analysis, a decision can be reached based on the people’s claim on whether to leave the
voting areas in one way or the other will contribute to the number of voting turnouts which is
expected to be more in the referendum period. In order to accomplish the ascertained of the
claim, both the correlation coefficients and scatter graphs from the Microsoft office excel
have been produced while utilizing the datasets from the referendum evaluation analysis.
Overview of the Brexit Referendum
Before the presentation of the results on the above claim, the report presents the meaning of
the Brexit as a subject in United Kingdom. For to note, Brexit is an abbreviation from the
terminology known as the “British Exit” meaning the exit of the United Kingdom from the
European Union (Lalić-krstin and Silaški, p.3). On the same note, on 23rd June of 2016, a
referendum was conducted to find out whether it is necessarily for the United Kingdom to
exit the EU or not. From the overall analysis indicating the consensus of the voting pattern,
there was evidence that the UK is expected to exit the European Union as accounted for by
52% of the votes confirming that UK should exit whereas only 48% were on the contrary
with their counterparts meaning that the UK should not leave the EU (Ford and Goodwin,
p.17).
Summary of the Correlation Coefficient Values
In this section, the referendum Brexit findings were used to test the associations as well as
presenting the correlation values between the two variables of interest. The UK official
website was used to obtain the referendum results, (Hunt, and Wheeler, 2017). From the
analysis, the results of the leave vote percentage correlation coefficient and the turnout
percentage correlation coefficient in the UK is -0.0107 which confirms a weak, negative
relationship between the leave vote percentage and the turnout percentage. Moreover, the
results indicate the correlation coefficients for each region of the United Kingdom. From the
analysis, all the regions have a negative correlation coefficient value except London whose
coefficient correlation value is positive (0.7062) which indicates a moderate positive
correlation. For to note, the correlation coefficient values for the regions within UK ranges
from -0.1373 which is the correlation coefficient for the East Midlands to -0.58506
representing the correlation coefficient for east United Kingdom. Furthermore, the results
indicate that the Northern Ireland has a zero-correlation coefficient value between the leave
vote percentage and turnout percentage. This may be contributed to the fact that the Northern
Ireland has only one pair of data, yet two variables are a requirement while calculating
coefficient correlation values in excel.
Brief Explanation of the Correlation Coefficient
From the findings, the correlation coefficients between the leave vote percentage and turnout
percentage for the UK as a whole and the different regions within the United Kingdom have
been presented by the results in the Table below. Furthermore, results have been visualized
Document Page
Statistics
4
by use of scatter plots to show the association between the variables above. Generally, the
correlation coefficients play an important role while testing the strength of associations
between two variables of interest. For instance, the correlation coefficients normally ranges
from -1 to +1 where -1 indicates a very strong, negative linear relationship while +1 indicate
a very strong positive linear relationship. Zero (0) on the other hand indicate absence of
association between the variables of interest, (Goodwin and Leech, p.252). In summary, the
results shown in the table where the correlation coefficient values are negative have a
downward slope which indicates a negative gradient while positive correlation coefficient
values indicate an upward slope indicating a positive gradient. From the results, only London
have positive gradient while the rest of regions including UK as a country have negative
gradients. On the other hand, the gradient for the Northern Ireland is not generated because it
only has one pair of data points while at least two pairs of data points would have been ideal.
UK Correlation Coefficient Table
Correlation Coefficient
United Kingdom -0.0107652802626528
(Source: UK Electoral Commission)
Region Wise Correlation Coefficient Table
(Source: UK Electoral Commission)
Region Correlation Strength
East -0.58506 Moderate
East Midlands -0.13731 Very weak
London 0.706249 Strong
North East -0.5147 Moderate
North West -0.39718 Weak
Northern Ireland 0 None
Scotland -0.32524 Weak
South East -0.25209 Weak
South West -0.39053 Weak
Wales -0.26518 Weak
West Midlands -0.52353 Moderate
Yorkshire and The Humber -0.52354 Moderate
tabler-icon-diamond-filled.svg

Paraphrase This Document

Need a fresh take? Get an instant paraphrase of this document with our AI Paraphraser
Document Page
Statistics
5
Region Wise Scatter Graphs
(Source: UK Electoral Commission)
Document Page
Statistics
6
Document Page
Statistics
7
tabler-icon-diamond-filled.svg

Paraphrase This Document

Need a fresh take? Get an instant paraphrase of this document with our AI Paraphraser
Document Page
Statistics
8
UK Scatter Graph (Source: UK Electoral Commission)
Document Page
Statistics
9
Mean Values Graph
(Source: UK Electoral Commission)
Evaluation of claim
Basically, the mean results of the turnout percentage, leave vote percentage and remain vote
percentage have been given by the graph above. Looking at the results above, there is
evidence that people voting in favour of Brexit in one way or the other are more than those
voting against it. For example, in Eastern region, 54.05% voted in favour of Brexit while only
Document Page
Statistics
10
45.95% were on the contrary opinion. Therefore, the people’s claim on whether to leave the
voting areas in one way or the other will contribute to the number of voting turnouts which is
expected to be more in the referendum period can be evaluated by a statistical analysis known
as confidence interval statistical methods. Well, the Confidence interval indicates the true
mean at which the data point will lie between while because the confidence levels (z) and
standard deviations (s) are from a normal distributed dataset. As a result, a formula shown
below can be used where n simply mean the number of data points.
In the above formula, x refers to average of the leave vote percentage or the remain vote
percentage, z is known to be 1.96, s is the standard deviation, n as mentioned is the
datapoints.
Hence, having replaced the values in the formula above, a confidence level of 95% for the
leave vote percentage was calculated to be [51.8, 53.9] and the confidence interval of remain
vote percentage was calculated to be [46.1, 48.2]. From the findings, there is no overlapping
between the two confidence intervals thus confirming that the data has some statistical
significance. This implies that the people’s claim on whether to leave the voting areas or not
contributes to high voting turnouts in the referendum period with the people voting in favour
of Brexit being more than those voting against it.
Weakness of Correlation Coefficients
Normally, in research, the existence of a correlation coefficient which is strong or weak does
not infer causality but instead indicates some form of associations between the variables. In
fact, it the correlation cannot be fully depended upon now that the association may be
contributed to by other lurking variables. Similarly, from the analysis, most of the correlation
coefficients calculated are below -0.5 or +0.5% indicating the weak reliability of the
correlation values.
Conclusion
The 2016 Brexit referendum was a key subject that could lead to either a portion of the
citizens celebrating the exit of UK or remaining. From the overall findings, 52% agreed that
the UK to exit whereas only 48% of the votes were on the contrary meaning that they were
against the Brexit. The report has presented the findings of the Brexit referendum data
collected by the UK Electoral Commission to test the people’s claim that the number of votes
turnout for leaving option would be more than the number of votes turn out for remaining.
From the evaluation results, there is evidence that people voting in favour of Brexit in one
way or the other are more than those voting against it. For example, in Eastern region,
54.05% voted in favour of Brexit while only 45.95% were on the contrary opinion. The same
findings is consistence to the statistical test using the confidence intervals that established
that the people’s claim on whether to leave the voting areas or not contributes to high voting
turnouts in the referendum period with the people voting in favour of Brexit being more than
those voting against it. In conclusion the use of correlation coefficients, scatter and bar graphs
and confidence interval to provide an answer to the claim above has provided avenue of
evaluating the data achieved from the Brexit referendum from back in the year 2016.
References
tabler-icon-diamond-filled.svg

Paraphrase This Document

Need a fresh take? Get an instant paraphrase of this document with our AI Paraphraser
Document Page
Statistics
11
Document Page
Statistics
12
References
Adler-Nissen, R., Galpin, C. and Rosamond, B., 2017. Performing Brexit: How a post-Brexit
world is imagined outside the United Kingdom. The British Journal of Politics and
International Relations, 19(3), pp.573-591.
Ford, R. and Goodwin, M. (2017) A Nation Divided. Journal of Democracy. 28 (1), pp. 17-
30.
Goodwin, L.D. and Leech, N.L. (2006) Understanding Correlation: Factors That Affect the
Size of R. The Journal of Experimental Education. 74 (3), pp. 251-266.
Hunt, A. and Wheeler, B., 2017. Brexit: All you need to know about the UK leaving the EU.
BBC News, 25.
Lalić-krstin, G. and Silaški, N. (2018) From Brexit to Bregret: An Account of Some Brexit-
induced Neologisms in English. English Today. 34 (2), pp. 3-8.
Taylor-Gooby, P., 2017. Re-Doubling the Crises of the Welfare State: The impact of Brexit
on UK welfare politics. Journal of Social Policy, 46(4), pp.815-835.
The Electoral Commission (2016) EU referendum results, EU referendum results data (2016
version) [online]. Available from: https://www.electoralcommission.org.uk/find-information-
by-subject/elections-and-referendums/past-elections-and-referendums/eu-referendum/
electorate-and-count-information [Accessed 14 July 2019]
chevron_up_icon
1 out of 12
circle_padding
hide_on_mobile
zoom_out_icon
[object Object]