Brisbane Magnus Mall Project: Scenario & Sensitivity Analysis Report
VerifiedAdded on 2023/06/11
|25
|5510
|144
Report
AI Summary
This report presents a comprehensive scenario and sensitivity analysis for the Brisbane Magnus Mall project, a Build, Operate, and Transfer (BOT) agreement between Well Built Infrastructure Company (WBIC) and Queensland Investment Corporation (QIC). It examines two scenarios: outsourcing repairs and construction to Ae7 Private Limited (Scenario A) and not outsourcing, seeking an extension instead (Scenario B). The analysis considers cash inflows from REIT establishment, QIC funding, lease revenues, and parking lot fees, as well as cash outflows related to loan payments, operating costs, and taxes. Sensitivity analysis identifies key variables and investigates the impact of adverse changes on project profitability, evaluating break-even points under best, neutral, and worst economic conditions. The report concludes with an assessment of each scenario's financial viability, providing insights for decision-making and project evaluation. Desklib offers similar documents and study tools for students.
Contents
Introduction................................................................................................................................................................................................................................... 3
Scenario Analysis.......................................................................................................................................................................................................................... 3
Scenario A: Outsourcing the Repairs and Construction of the Mall..............................................................................................................................................3
Scenario B: Not Out Sourcing................................................................................................................................................................................................... 5
Cash Inflows................................................................................................................................................................................................................................... 7
Funding...................................................................................................................................................................................................................................... 7
Setting Up an REIT.................................................................................................................................................................................................................. 7
Revenues................................................................................................................................................................................................................................... 7
Cash Outflows................................................................................................................................................................................................................................ 9
Operation Phase.......................................................................................................................................................................................................................... 10
Cash Outflows During Operation Phase................................................................................................................................................................................... 10
Loan Payments.................................................................................................................................................................................................................... 10
Operating Costs................................................................................................................................................................................................................... 11
Taxes:.................................................................................................................................................................................................................................. 12
Depreciation........................................................................................................................................................................................................................ 12
SENSITIVITY ANALYSIS –............................................................................................................................................................................................................... 12
IDENTIFIED THE KEY VARIABLES –................................................................................................................................................................................................ 12
INVESTIGATION OF RESULT OF PROBABLE ADVERSE CHANGES –...............................................................................................................................................13
FOR DECISION MAKING AND EVALUATION OF PROJECT –..........................................................................................................................................................13
SENSITIVITY ANALYSIS OF THE COMPANY –................................................................................................................................................................................ 14
ORIGINAL COST AND BENEFIT OF THE PROJECT -........................................................................................................................................................................ 14
Paraphrase This Document
Need a fresh take? Get an instant paraphrase of this document with our AI Paraphraser
ECONOMIC CONDITION WISE ANALYSIS:..................................................................................................................................................................................... 16
BEST ECONOMIC CONDITION VALUATIONS -.............................................................................................................................................................................. 16
BREAK EVEN ANALYSIS -.............................................................................................................................................................................................................. 17
NEUTRAL ECONOMIC CONDITION:.............................................................................................................................................................................................. 18
BREAK EVEN ANALYSIS -.............................................................................................................................................................................................................. 19
Worst Economic Condition -........................................................................................................................................................................................................ 21
BREAK EVEN ANALYSIS -.............................................................................................................................................................................................................. 21
ANALYSIS –................................................................................................................................................................................................................................... 22
ANALYSIS OF BEST ECONOMIC CONDITIONS –............................................................................................................................................................................ 23
ANALYSIS OF NEUTRAL ECONOMIC CONDITIONS –..................................................................................................................................................................... 23
ANALYSIS OF WORST ECONOMIC CONDITIONS –........................................................................................................................................................................ 23
CONCLUSION –............................................................................................................................................................................................................................ 24
Bibliography................................................................................................................................................................................................................................. 24
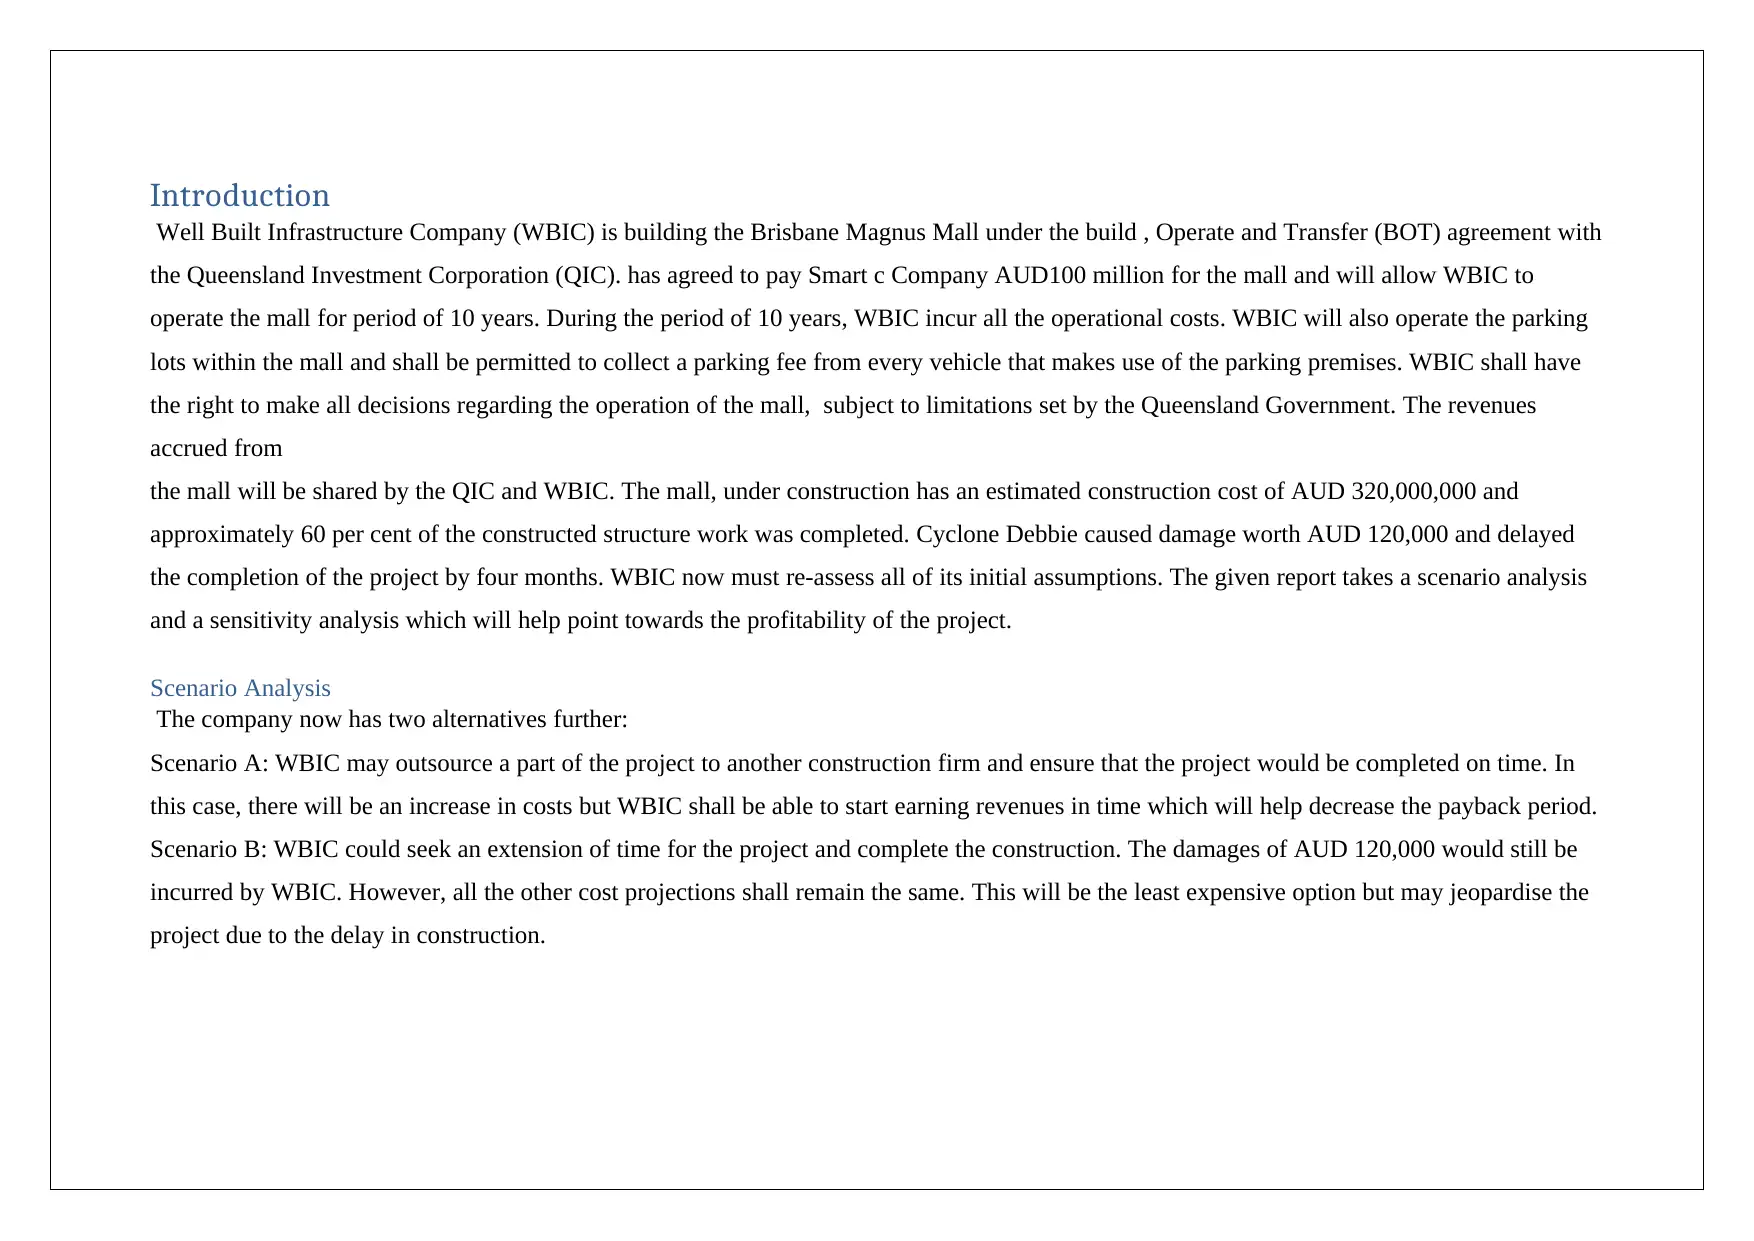
Introduction
Well Built Infrastructure Company (WBIC) is building the Brisbane Magnus Mall under the build , Operate and Transfer (BOT) agreement with
the Queensland Investment Corporation (QIC). has agreed to pay Smart c Company AUD100 million for the mall and will allow WBIC to
operate the mall for period of 10 years. During the period of 10 years, WBIC incur all the operational costs. WBIC will also operate the parking
lots within the mall and shall be permitted to collect a parking fee from every vehicle that makes use of the parking premises. WBIC shall have
the right to make all decisions regarding the operation of the mall, subject to limitations set by the Queensland Government. The revenues
accrued from
the mall will be shared by the QIC and WBIC. The mall, under construction has an estimated construction cost of AUD 320,000,000 and
approximately 60 per cent of the constructed structure work was completed. Cyclone Debbie caused damage worth AUD 120,000 and delayed
the completion of the project by four months. WBIC now must re-assess all of its initial assumptions. The given report takes a scenario analysis
and a sensitivity analysis which will help point towards the profitability of the project.
Scenario Analysis
The company now has two alternatives further:
Scenario A: WBIC may outsource a part of the project to another construction firm and ensure that the project would be completed on time. In
this case, there will be an increase in costs but WBIC shall be able to start earning revenues in time which will help decrease the payback period.
Scenario B: WBIC could seek an extension of time for the project and complete the construction. The damages of AUD 120,000 would still be
incurred by WBIC. However, all the other cost projections shall remain the same. This will be the least expensive option but may jeopardise the
project due to the delay in construction.
⊘ This is a preview!⊘
Do you want full access?
Subscribe today to unlock all pages.
Trusted by 1+ million students worldwide
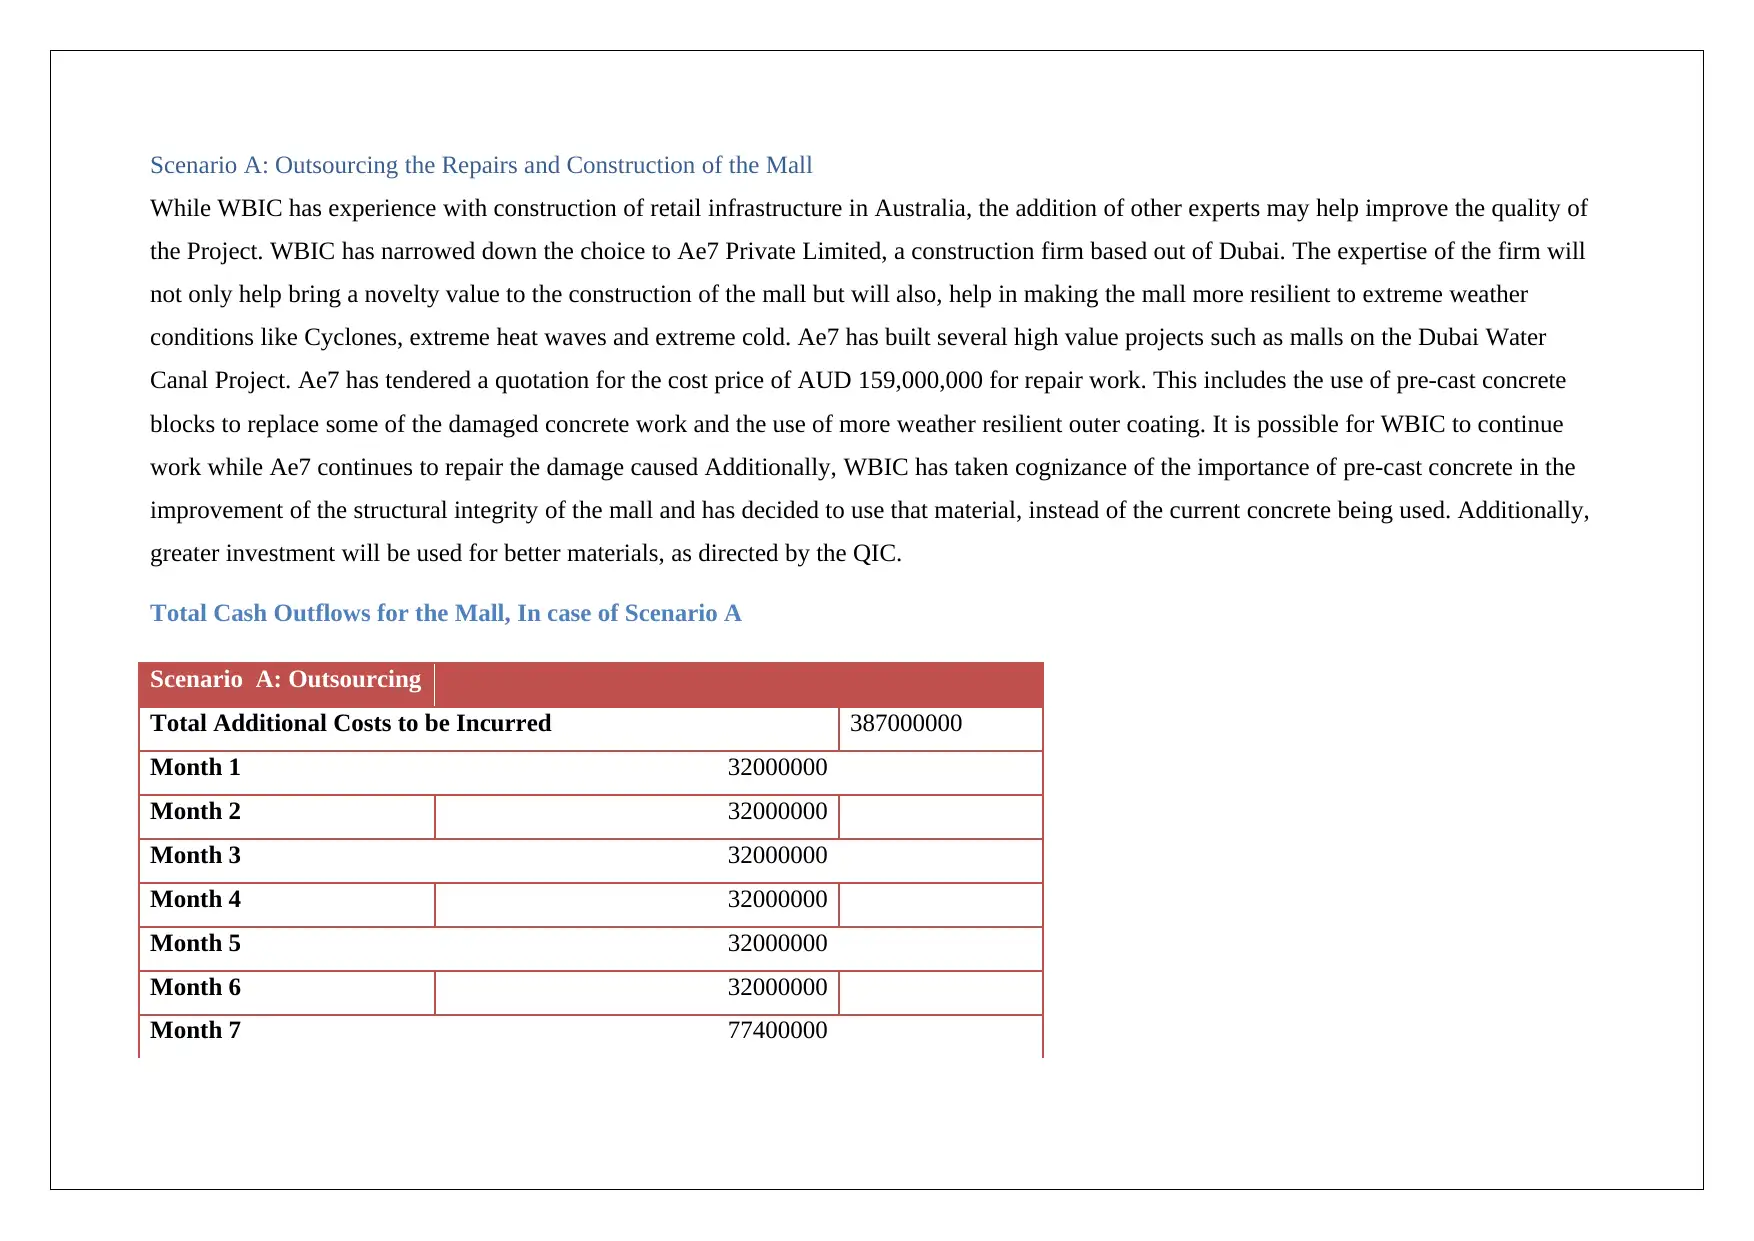
Scenario A: Outsourcing the Repairs and Construction of the Mall
While WBIC has experience with construction of retail infrastructure in Australia, the addition of other experts may help improve the quality of
the Project. WBIC has narrowed down the choice to Ae7 Private Limited, a construction firm based out of Dubai. The expertise of the firm will
not only help bring a novelty value to the construction of the mall but will also, help in making the mall more resilient to extreme weather
conditions like Cyclones, extreme heat waves and extreme cold. Ae7 has built several high value projects such as malls on the Dubai Water
Canal Project. Ae7 has tendered a quotation for the cost price of AUD 159,000,000 for repair work. This includes the use of pre-cast concrete
blocks to replace some of the damaged concrete work and the use of more weather resilient outer coating. It is possible for WBIC to continue
work while Ae7 continues to repair the damage caused Additionally, WBIC has taken cognizance of the importance of pre-cast concrete in the
improvement of the structural integrity of the mall and has decided to use that material, instead of the current concrete being used. Additionally,
greater investment will be used for better materials, as directed by the QIC.
Total Cash Outflows for the Mall, In case of Scenario A
Scenario A: Outsourcing
Total Additional Costs to be Incurred 387000000
Month 1 32000000
Month 2 32000000
Month 3 32000000
Month 4 32000000
Month 5 32000000
Month 6 32000000
Month 7 77400000
Paraphrase This Document
Need a fresh take? Get an instant paraphrase of this document with our AI Paraphraser
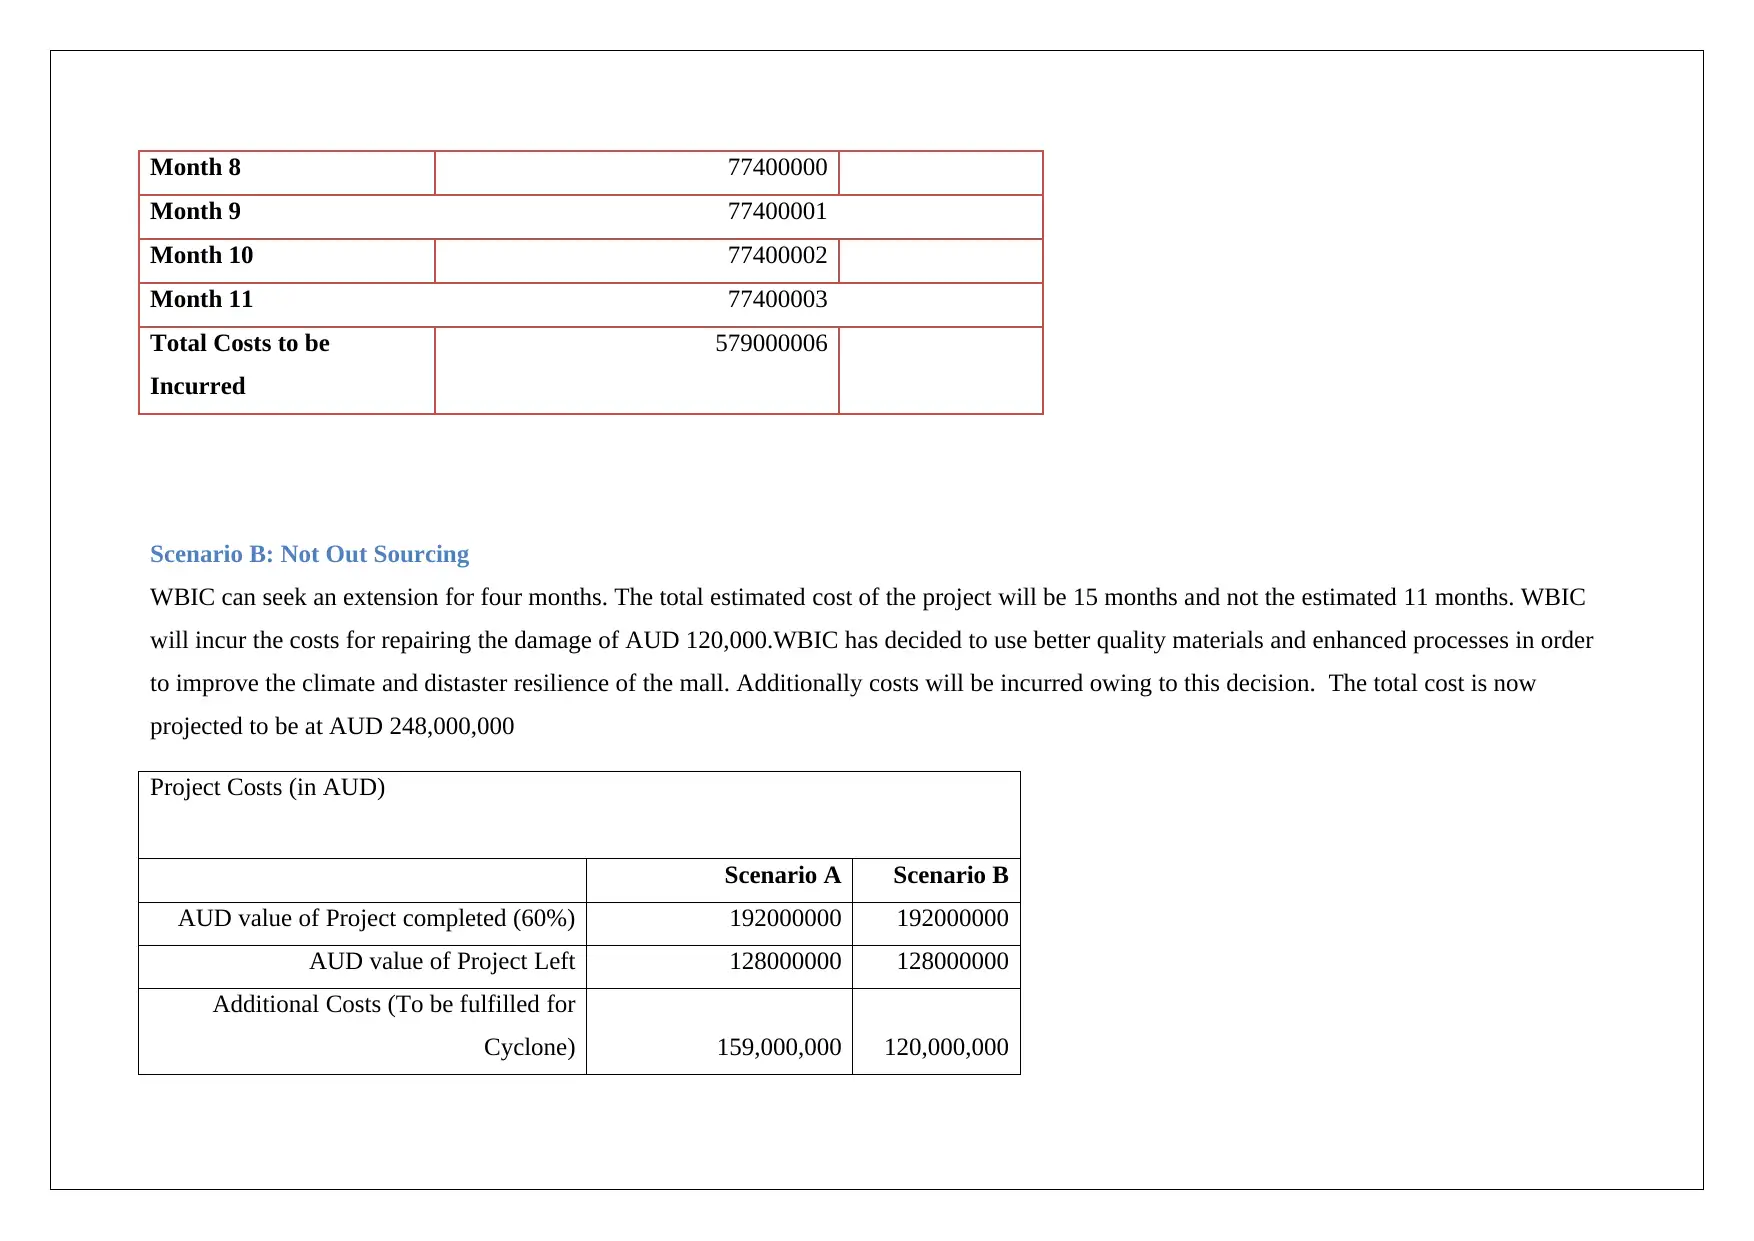
Month 8 77400000
Month 9 77400001
Month 10 77400002
Month 11 77400003
Total Costs to be
Incurred
579000006
Scenario B: Not Out Sourcing
WBIC can seek an extension for four months. The total estimated cost of the project will be 15 months and not the estimated 11 months. WBIC
will incur the costs for repairing the damage of AUD 120,000.WBIC has decided to use better quality materials and enhanced processes in order
to improve the climate and distaster resilience of the mall. Additionally costs will be incurred owing to this decision. The total cost is now
projected to be at AUD 248,000,000
Project Costs (in AUD)
Scenario A Scenario B
AUD value of Project completed (60%) 192000000 192000000
AUD value of Project Left 128000000 128000000
Additional Costs (To be fulfilled for
Cyclone) 159,000,000 120,000,000
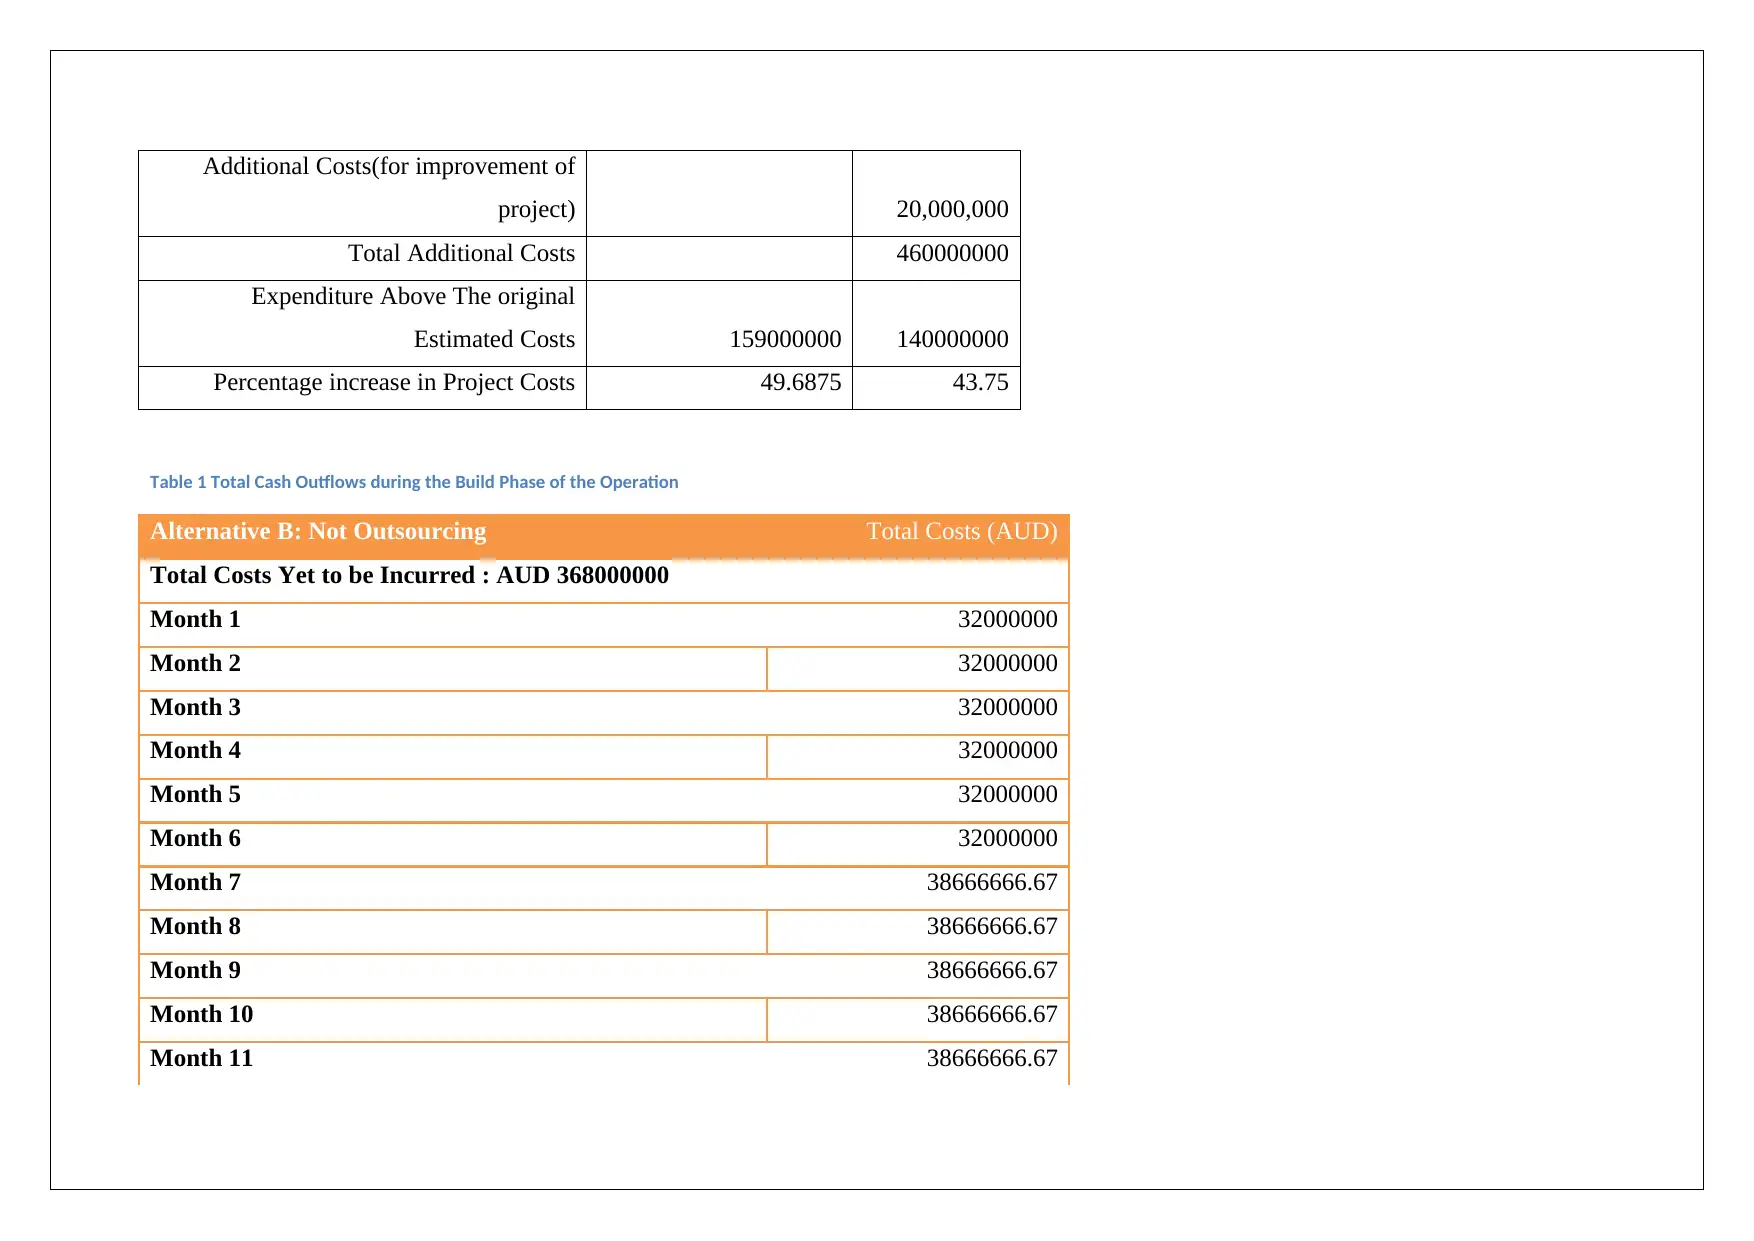
Additional Costs(for improvement of
project) 20,000,000
Total Additional Costs 460000000
Expenditure Above The original
Estimated Costs 159000000 140000000
Percentage increase in Project Costs 49.6875 43.75
Table 1 Total Cash Outflows during the Build Phase of the Operation
Alternative B: Not Outsourcing Total Costs (AUD)
Total Costs Yet to be Incurred : AUD 368000000
Month 1 32000000
Month 2 32000000
Month 3 32000000
Month 4 32000000
Month 5 32000000
Month 6 32000000
Month 7 38666666.67
Month 8 38666666.67
Month 9 38666666.67
Month 10 38666666.67
Month 11 38666666.67
⊘ This is a preview!⊘
Do you want full access?
Subscribe today to unlock all pages.
Trusted by 1+ million students worldwide
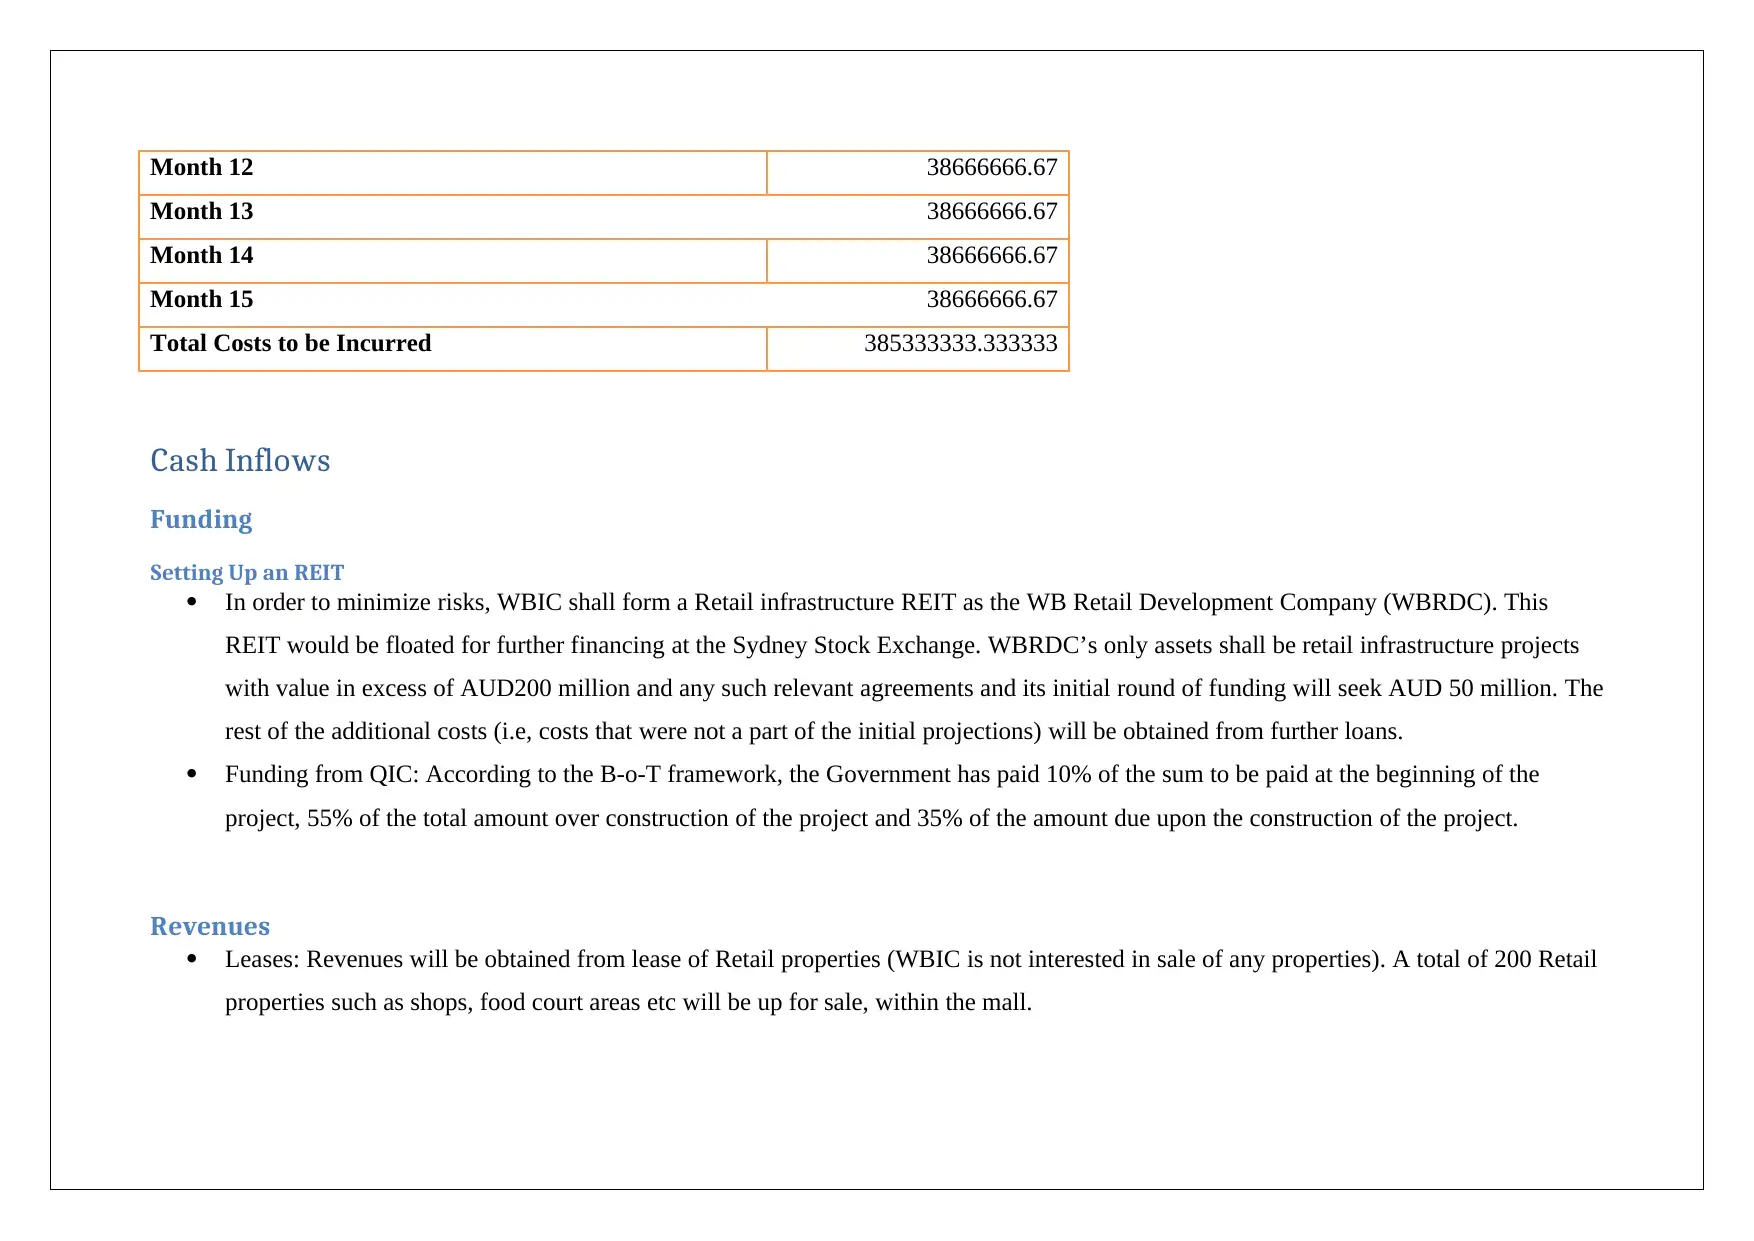
Month 12 38666666.67
Month 13 38666666.67
Month 14 38666666.67
Month 15 38666666.67
Total Costs to be Incurred 385333333.333333
Cash Inflows
Funding
Setting Up an REIT
In order to minimize risks, WBIC shall form a Retail infrastructure REIT as the WB Retail Development Company (WBRDC). This
REIT would be floated for further financing at the Sydney Stock Exchange. WBRDC’s only assets shall be retail infrastructure projects
with value in excess of AUD200 million and any such relevant agreements and its initial round of funding will seek AUD 50 million. The
rest of the additional costs (i.e, costs that were not a part of the initial projections) will be obtained from further loans.
Funding from QIC: According to the B-o-T framework, the Government has paid 10% of the sum to be paid at the beginning of the
project, 55% of the total amount over construction of the project and 35% of the amount due upon the construction of the project.
Revenues
Leases: Revenues will be obtained from lease of Retail properties (WBIC is not interested in sale of any properties). A total of 200 Retail
properties such as shops, food court areas etc will be up for sale, within the mall.
Paraphrase This Document
Need a fresh take? Get an instant paraphrase of this document with our AI Paraphraser
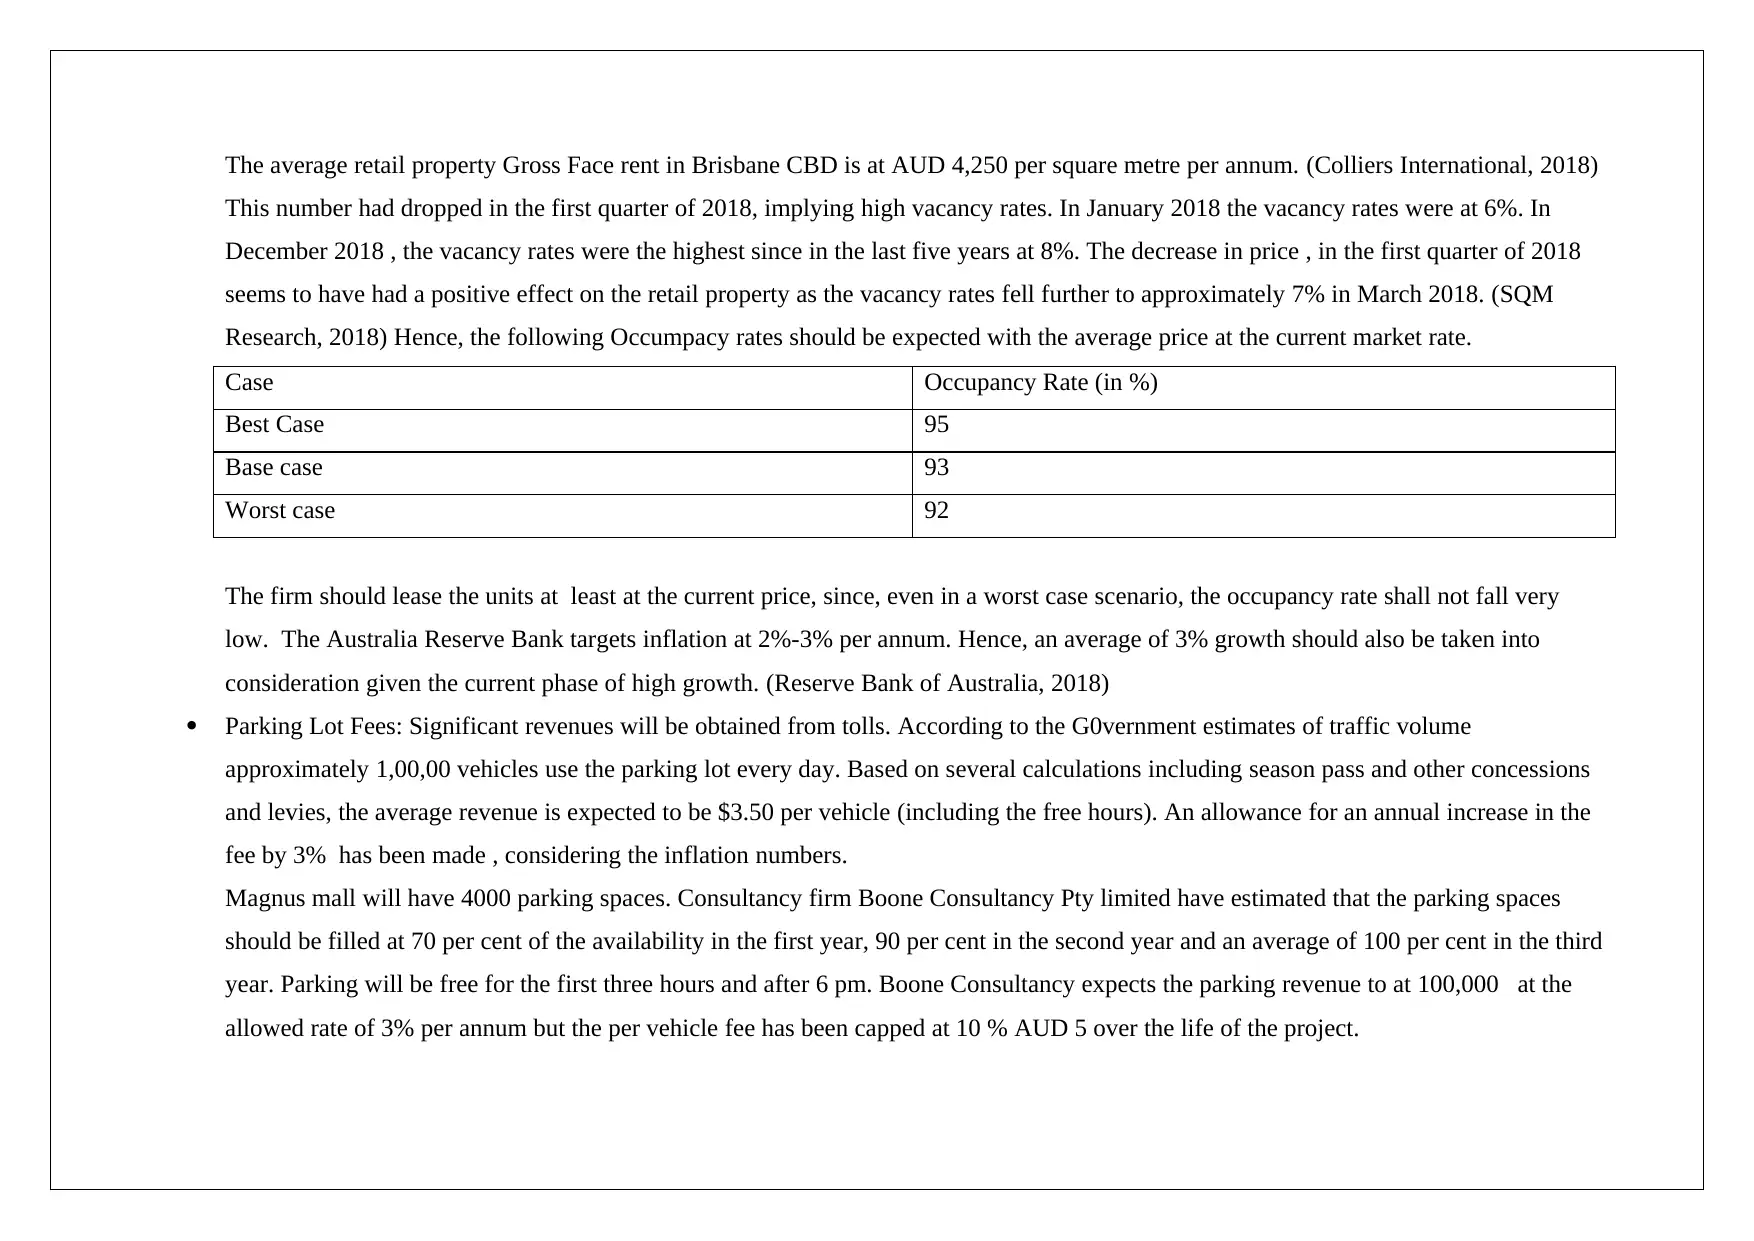
The average retail property Gross Face rent in Brisbane CBD is at AUD 4,250 per square metre per annum. (Colliers International, 2018)
This number had dropped in the first quarter of 2018, implying high vacancy rates. In January 2018 the vacancy rates were at 6%. In
December 2018 , the vacancy rates were the highest since in the last five years at 8%. The decrease in price , in the first quarter of 2018
seems to have had a positive effect on the retail property as the vacancy rates fell further to approximately 7% in March 2018. (SQM
Research, 2018) Hence, the following Occumpacy rates should be expected with the average price at the current market rate.
Case Occupancy Rate (in %)
Best Case 95
Base case 93
Worst case 92
The firm should lease the units at least at the current price, since, even in a worst case scenario, the occupancy rate shall not fall very
low. The Australia Reserve Bank targets inflation at 2%-3% per annum. Hence, an average of 3% growth should also be taken into
consideration given the current phase of high growth. (Reserve Bank of Australia, 2018)
Parking Lot Fees: Significant revenues will be obtained from tolls. According to the G0vernment estimates of traffic volume
approximately 1,00,00 vehicles use the parking lot every day. Based on several calculations including season pass and other concessions
and levies, the average revenue is expected to be $3.50 per vehicle (including the free hours). An allowance for an annual increase in the
fee by 3% has been made , considering the inflation numbers.
Magnus mall will have 4000 parking spaces. Consultancy firm Boone Consultancy Pty limited have estimated that the parking spaces
should be filled at 70 per cent of the availability in the first year, 90 per cent in the second year and an average of 100 per cent in the third
year. Parking will be free for the first three hours and after 6 pm. Boone Consultancy expects the parking revenue to at 100,000 at the
allowed rate of 3% per annum but the per vehicle fee has been capped at 10 % AUD 5 over the life of the project.
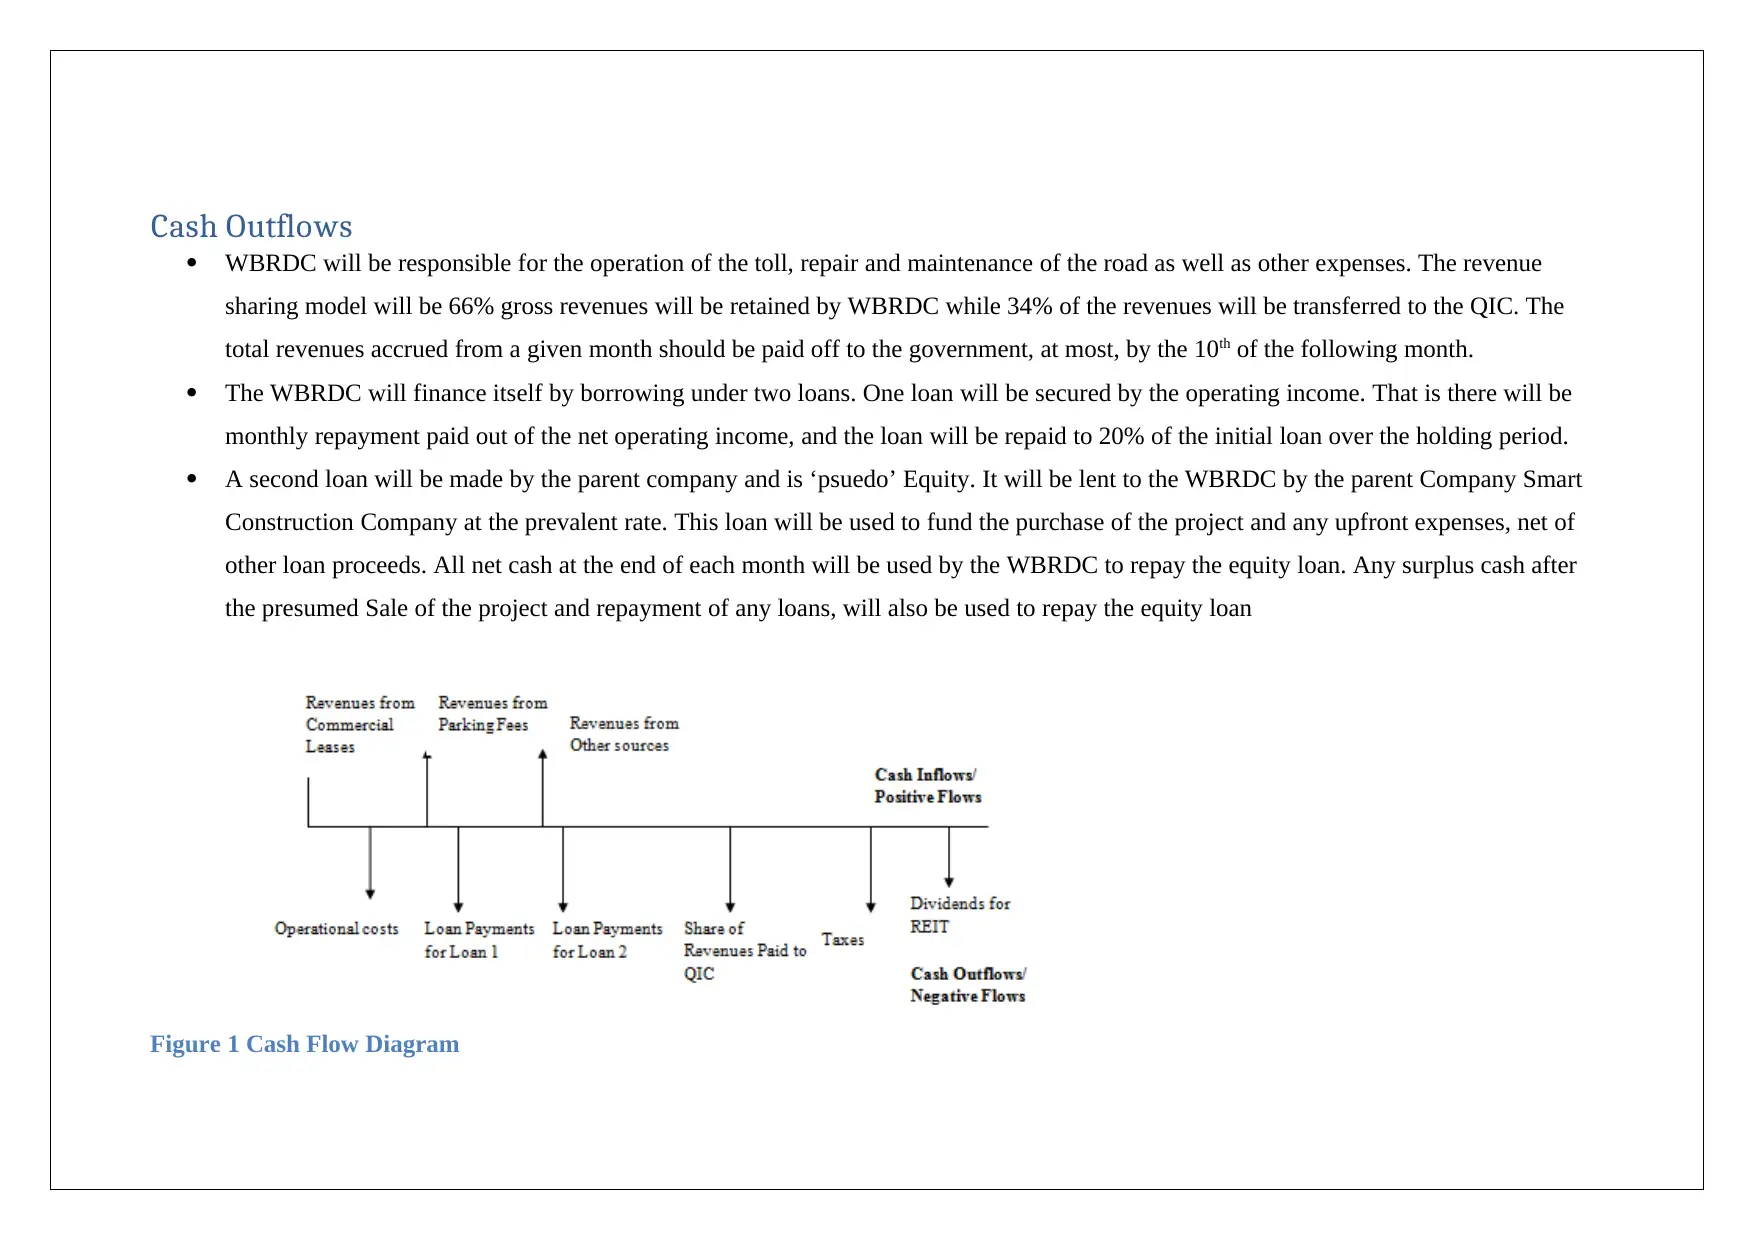
Cash Outflows
WBRDC will be responsible for the operation of the toll, repair and maintenance of the road as well as other expenses. The revenue
sharing model will be 66% gross revenues will be retained by WBRDC while 34% of the revenues will be transferred to the QIC. The
total revenues accrued from a given month should be paid off to the government, at most, by the 10th of the following month.
The WBRDC will finance itself by borrowing under two loans. One loan will be secured by the operating income. That is there will be
monthly repayment paid out of the net operating income, and the loan will be repaid to 20% of the initial loan over the holding period.
A second loan will be made by the parent company and is ‘psuedo’ Equity. It will be lent to the WBRDC by the parent Company Smart
Construction Company at the prevalent rate. This loan will be used to fund the purchase of the project and any upfront expenses, net of
other loan proceeds. All net cash at the end of each month will be used by the WBRDC to repay the equity loan. Any surplus cash after
the presumed Sale of the project and repayment of any loans, will also be used to repay the equity loan
Figure 1 Cash Flow Diagram
⊘ This is a preview!⊘
Do you want full access?
Subscribe today to unlock all pages.
Trusted by 1+ million students worldwide
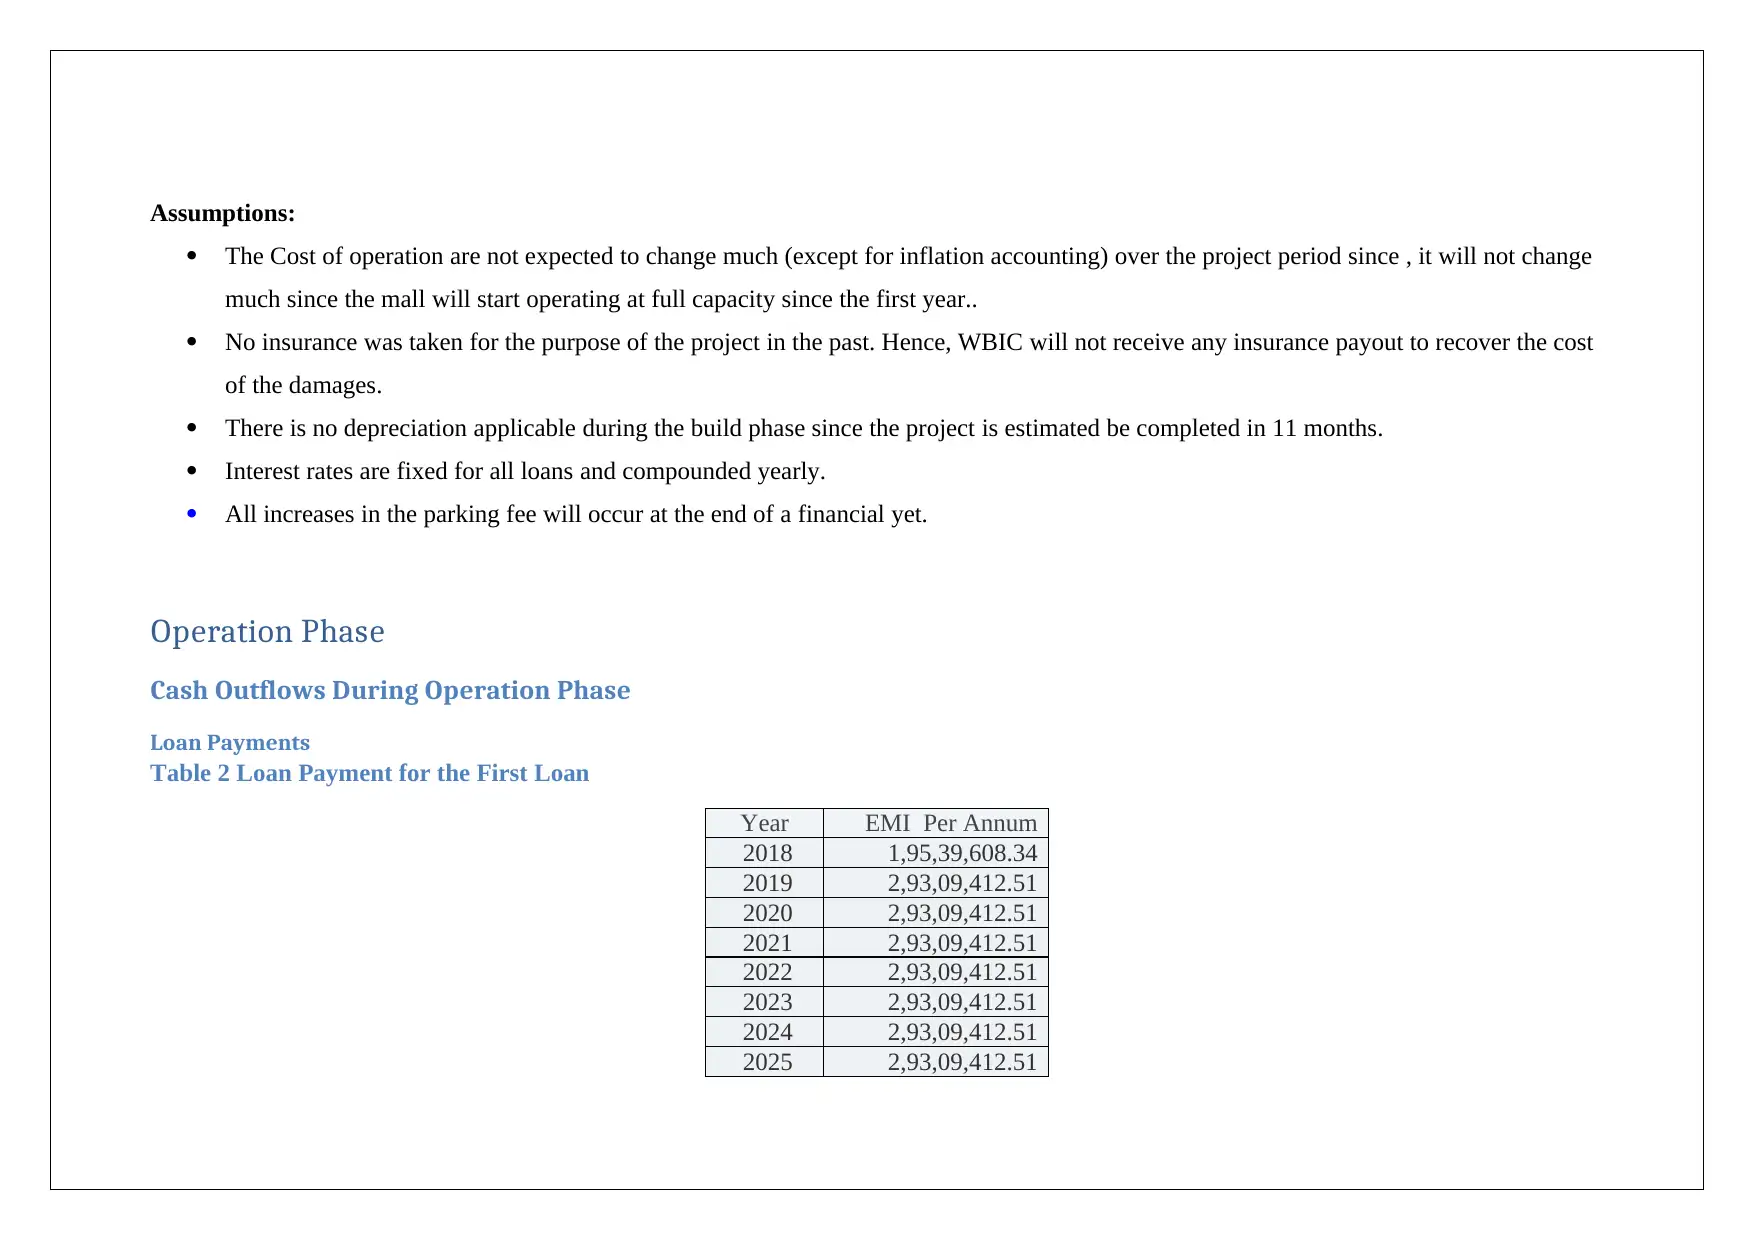
Assumptions:
The Cost of operation are not expected to change much (except for inflation accounting) over the project period since , it will not change
much since the mall will start operating at full capacity since the first year..
No insurance was taken for the purpose of the project in the past. Hence, WBIC will not receive any insurance payout to recover the cost
of the damages.
There is no depreciation applicable during the build phase since the project is estimated be completed in 11 months.
Interest rates are fixed for all loans and compounded yearly.
All increases in the parking fee will occur at the end of a financial yet.
Operation Phase
Cash Outflows During Operation Phase
Loan Payments
Table 2 Loan Payment for the First Loan
Year EMI Per Annum
2018 1,95,39,608.34
2019 2,93,09,412.51
2020 2,93,09,412.51
2021 2,93,09,412.51
2022 2,93,09,412.51
2023 2,93,09,412.51
2024 2,93,09,412.51
2025 2,93,09,412.51
Paraphrase This Document
Need a fresh take? Get an instant paraphrase of this document with our AI Paraphraser
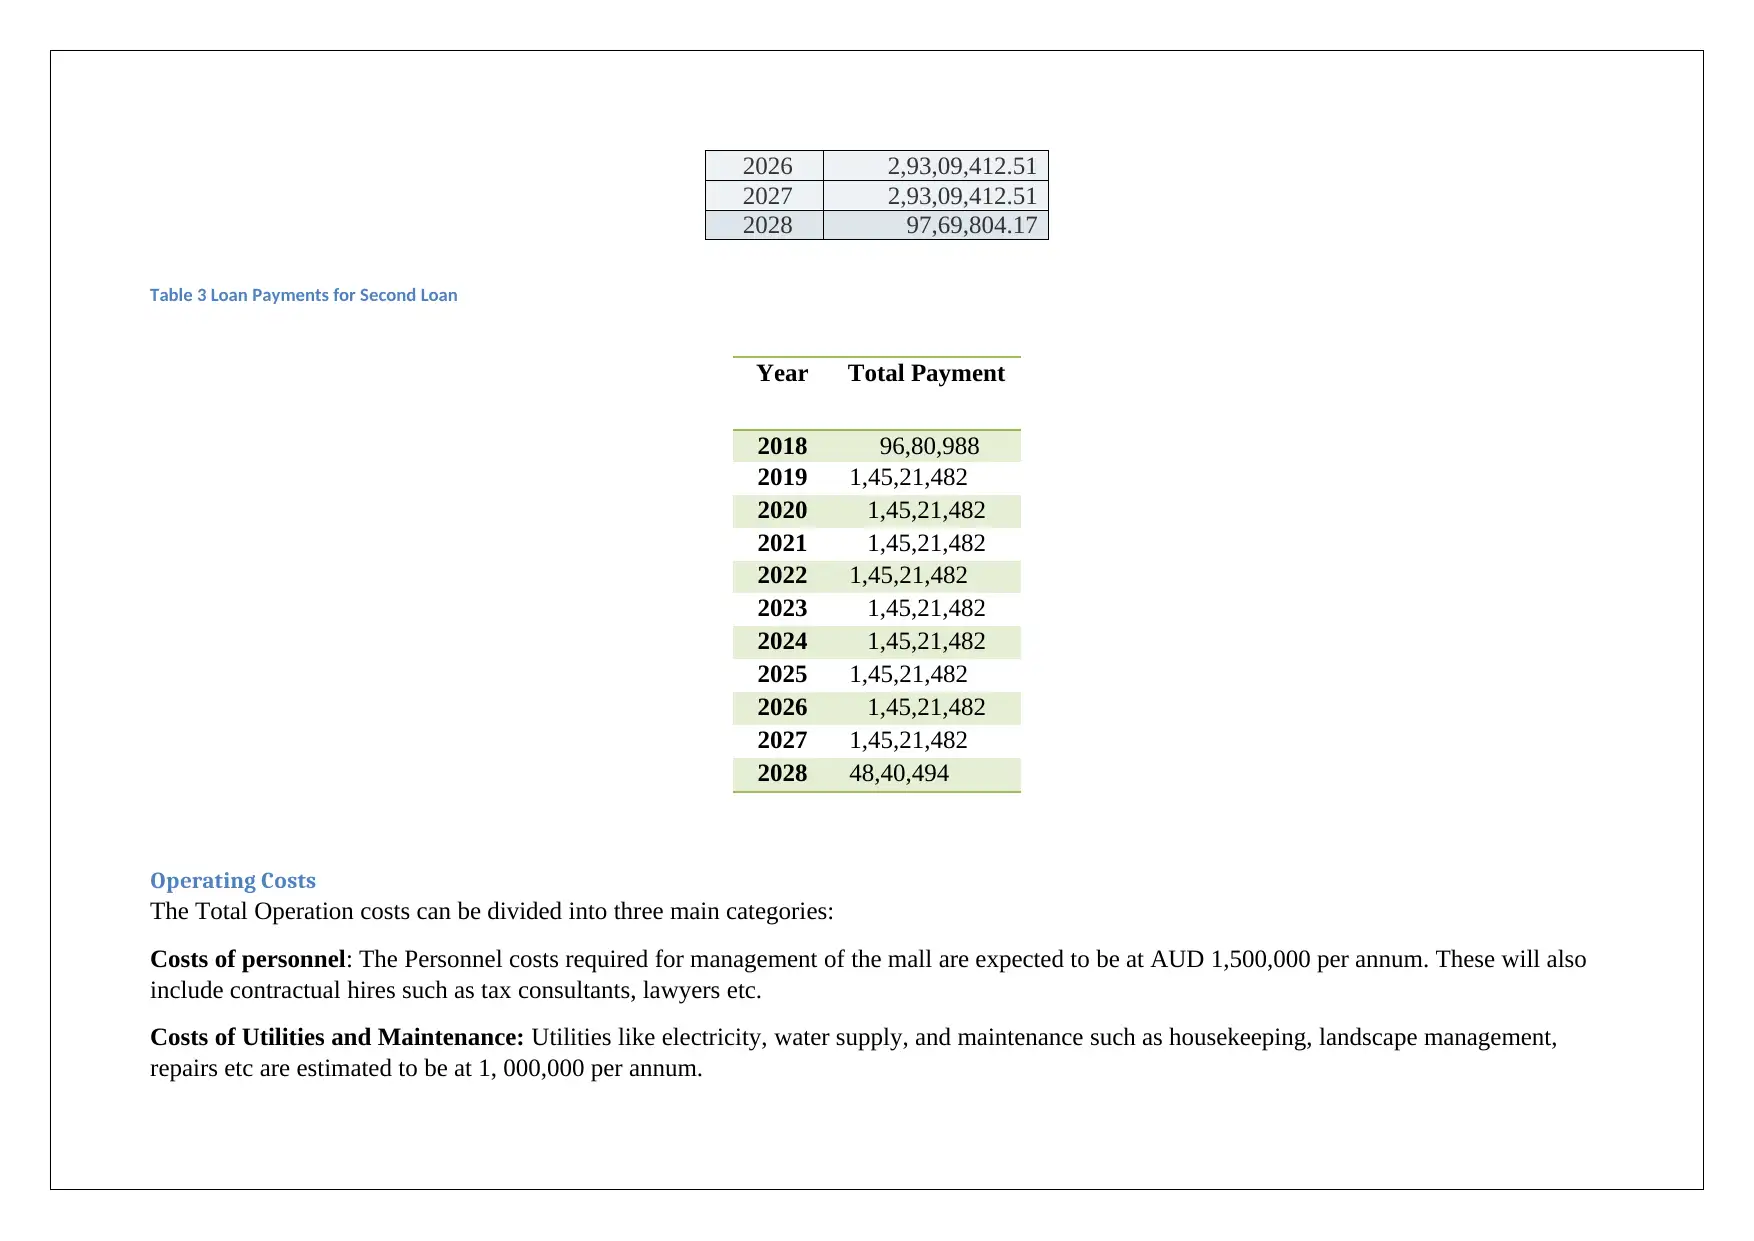
2026 2,93,09,412.51
2027 2,93,09,412.51
2028 97,69,804.17
Table 3 Loan Payments for Second Loan
Operating Costs
The Total Operation costs can be divided into three main categories:
Costs of personnel: The Personnel costs required for management of the mall are expected to be at AUD 1,500,000 per annum. These will also
include contractual hires such as tax consultants, lawyers etc.
Costs of Utilities and Maintenance: Utilities like electricity, water supply, and maintenance such as housekeeping, landscape management,
repairs etc are estimated to be at 1, 000,000 per annum.
Year Total Payment
2018 96,80,988
2019 1,45,21,482
2020 1,45,21,482
2021 1,45,21,482
2022 1,45,21,482
2023 1,45,21,482
2024 1,45,21,482
2025 1,45,21,482
2026 1,45,21,482
2027 1,45,21,482
2028 48,40,494
Other costs: Other costs such as book keeping , management of permissions and contracts etc. are estimated to be at AUD 100,000 a month.
These costs will increase by 3% per annum over the life of the project, according to the current inflation targeting by Reserve Bank of Australia
Taxes:
An expected 30% tax will be incurred during the operation phase. These are
Depreciation
The mall will require an initial investment of over AUD 550,000 in both cases. The depreciation of the mall is estimated on a straight line basis
for every year over the life of the project. It is valued at 3% of the total cost of the project. It is important to note here that the mall is expected
to have a life of at least 30 years while the project holding period is for 10 years.
SENSITIVITY ANALYSIS –
The financial and economic benefit for cost analysis of investment project is based on forecast of quantifiable variables based on the approximately
predicted forecast the value of these variables estimated and which cover a long time of period. The value of these variables for the most probable
outcomes scenario or influenced by a great number of factors and the real value can be differ considerably from forecasted value depending on future
development. The main purpose of the sensitivity analysis is to investigate the effect of the changes in project variable on forecasted based lines. It helps
into following purposes –
IDENTIFIED THE KEY VARIABLES –
The profitability of the mall is dependent on consumer spending. Australia’s economy is expected to grow by 3% per annum in 2018. The previous trend in
the Australian economy has shown that the economy of Australia, generally, has growth rates of about 2% to 3%. Given these economic conditions, the best
case will be when the economy grows at 3%. (Organization for Economic Co-operation and Development, 2017)At this rate, according to Boone Consultancy
Pty Ltd report developed for WBIC, the firm will be able to recover 200% of its Operation and Project development costs. The economic benefits will be at
⊘ This is a preview!⊘
Do you want full access?
Subscribe today to unlock all pages.
Trusted by 1+ million students worldwide
1 out of 25


Your All-in-One AI-Powered Toolkit for Academic Success.
+13062052269
info@desklib.com
Available 24*7 on WhatsApp / Email
![[object Object]](/_next/static/media/star-bottom.7253800d.svg)
Unlock your academic potential
Copyright © 2020–2026 A2Z Services. All Rights Reserved. Developed and managed by ZUCOL.