Numeracy and Data Analysis Report: Bristol Humidity and Prediction

Verified

Added on  2023/01/17

|11
|1348
|27
Report
AI Summary
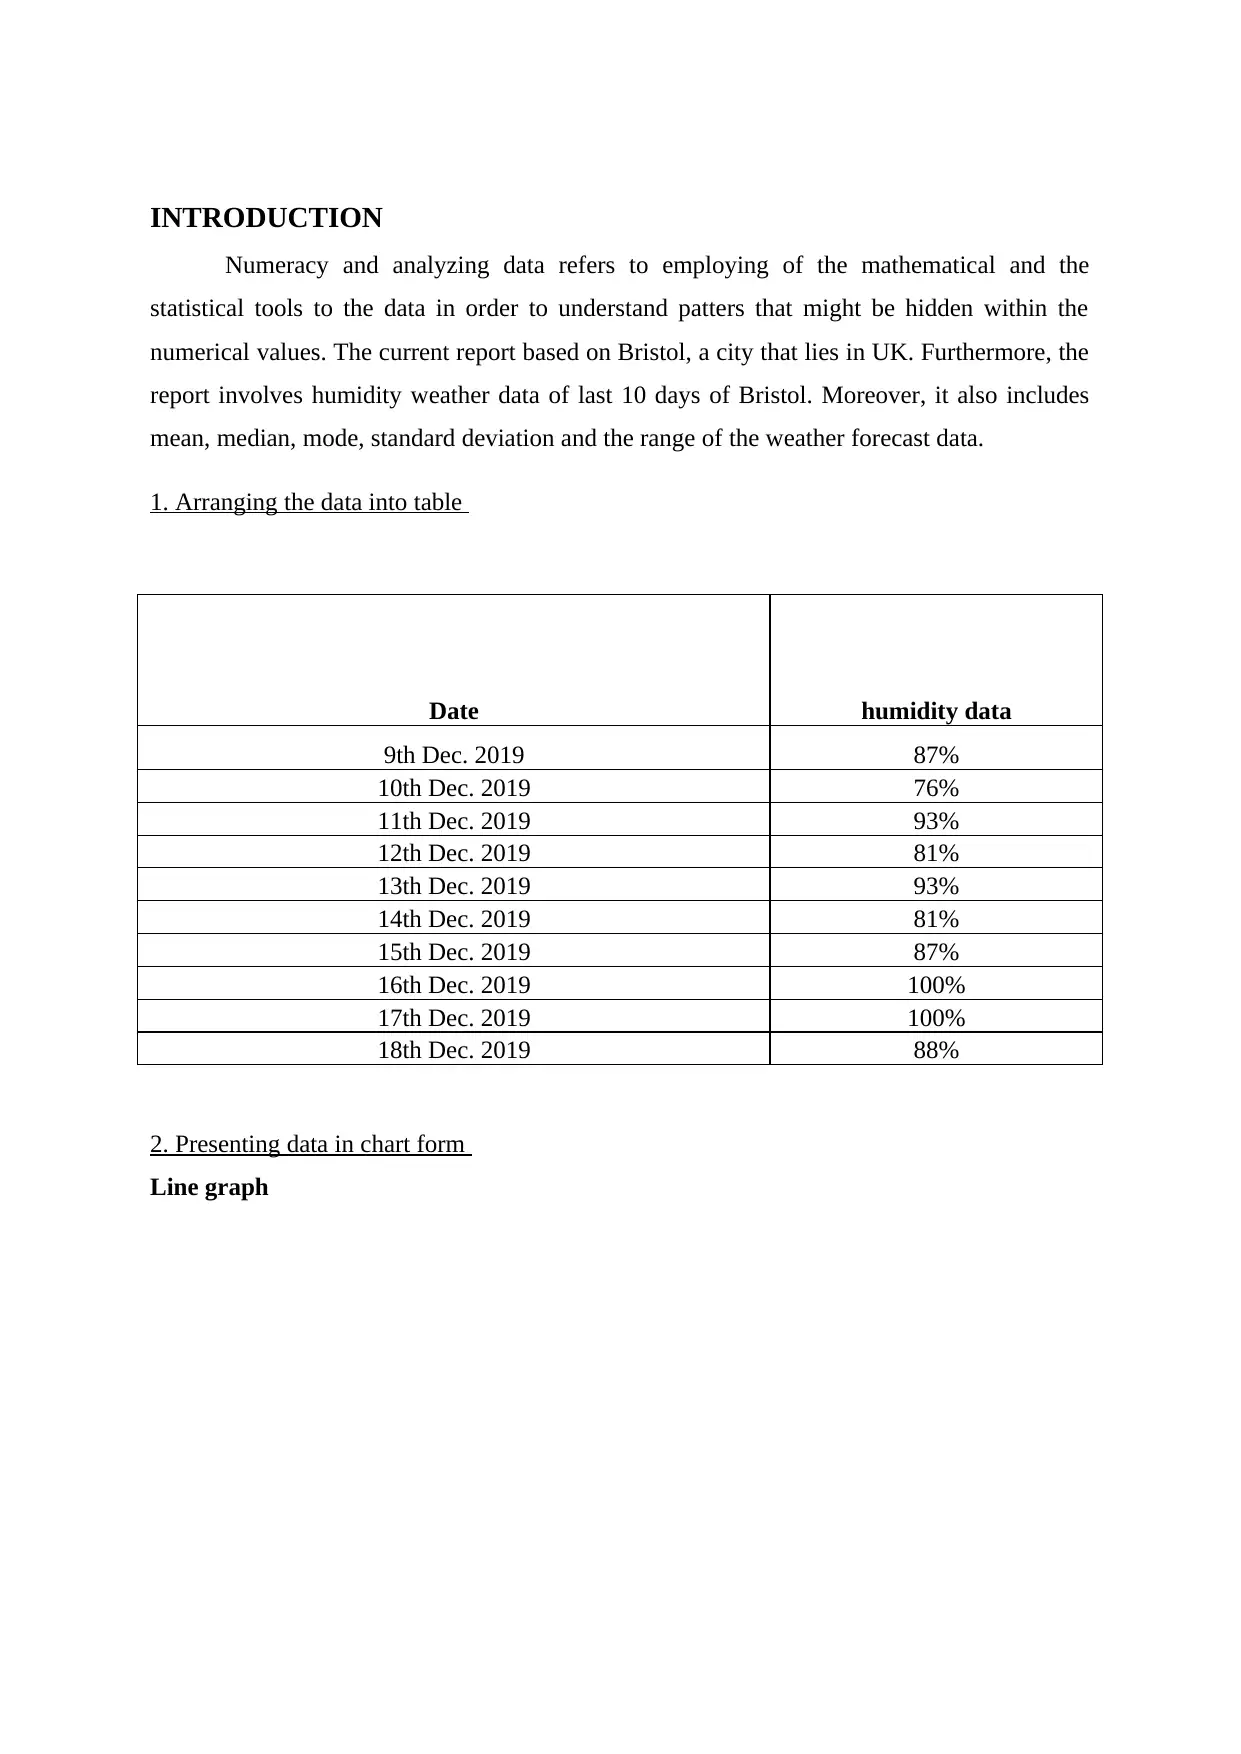
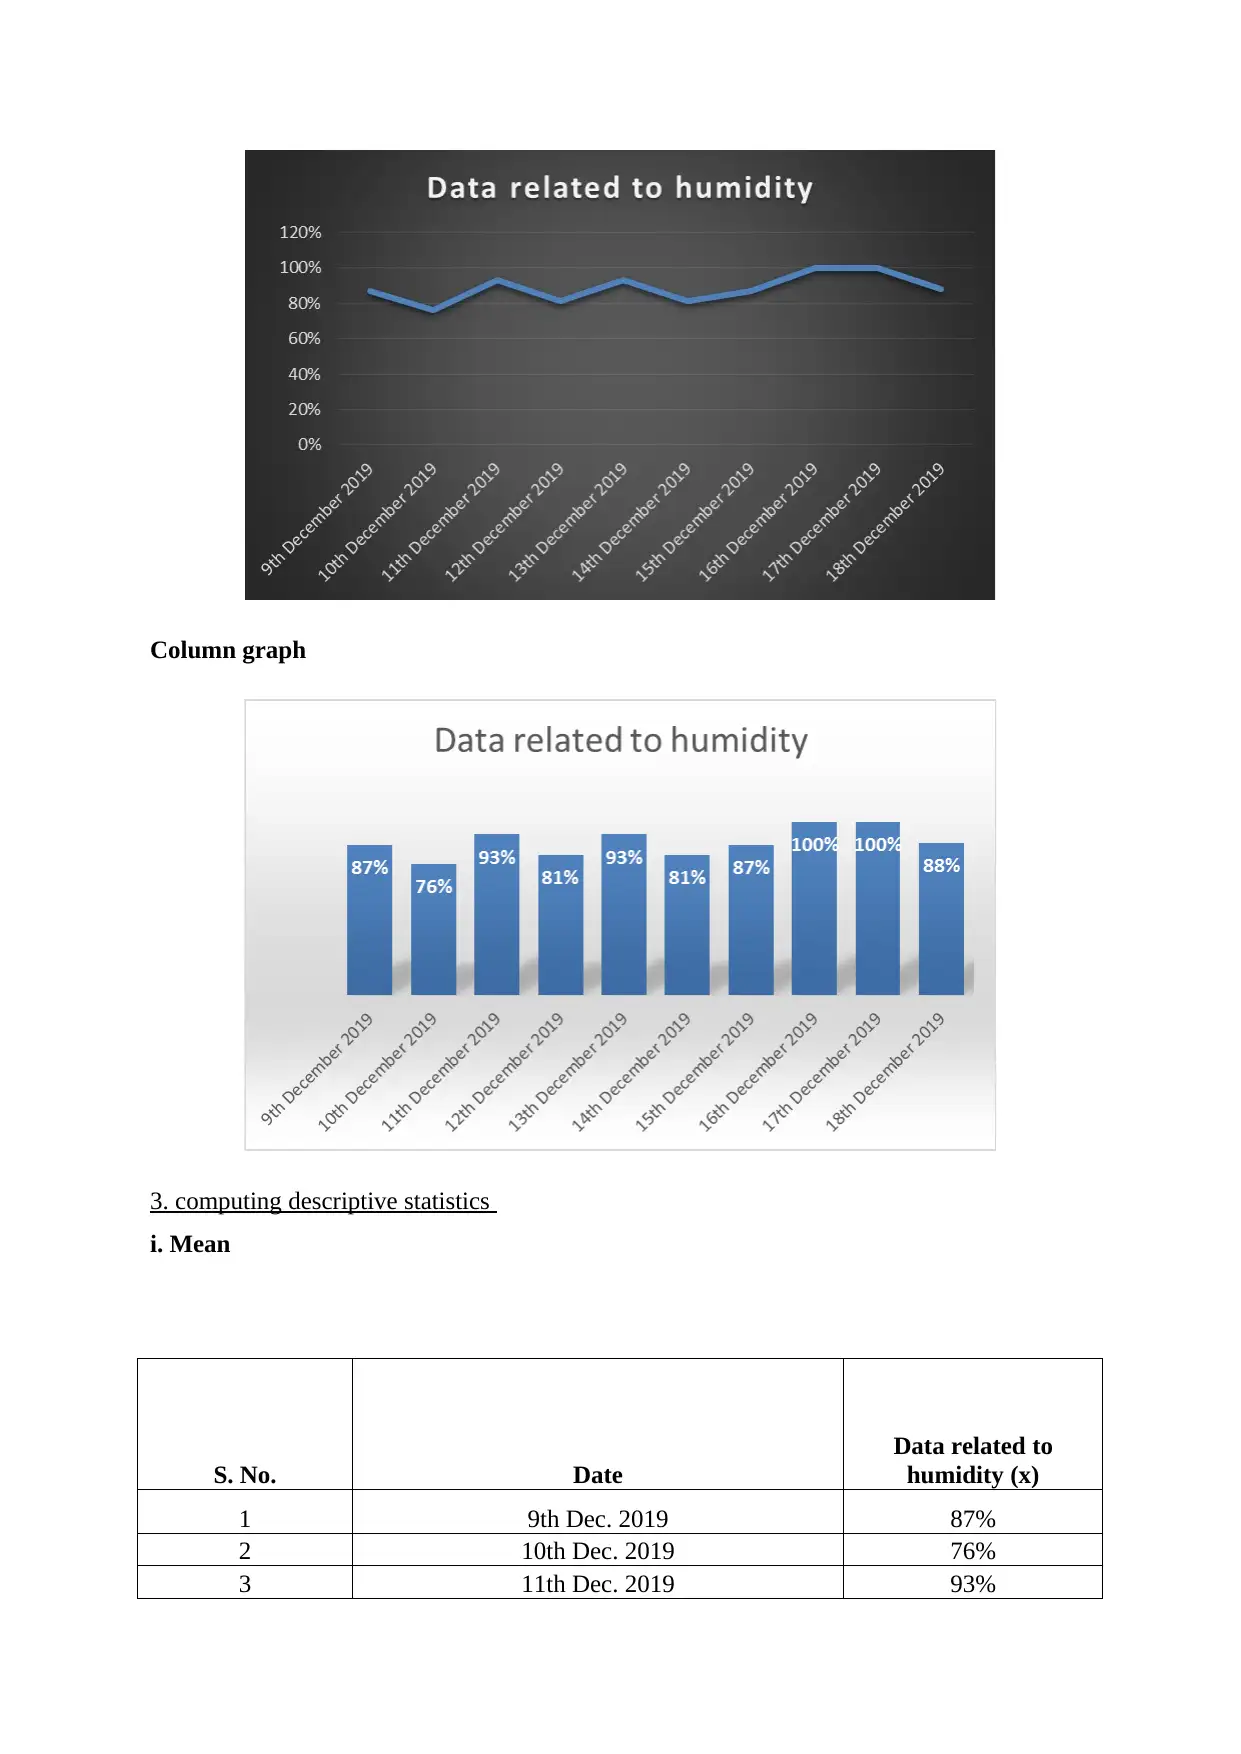
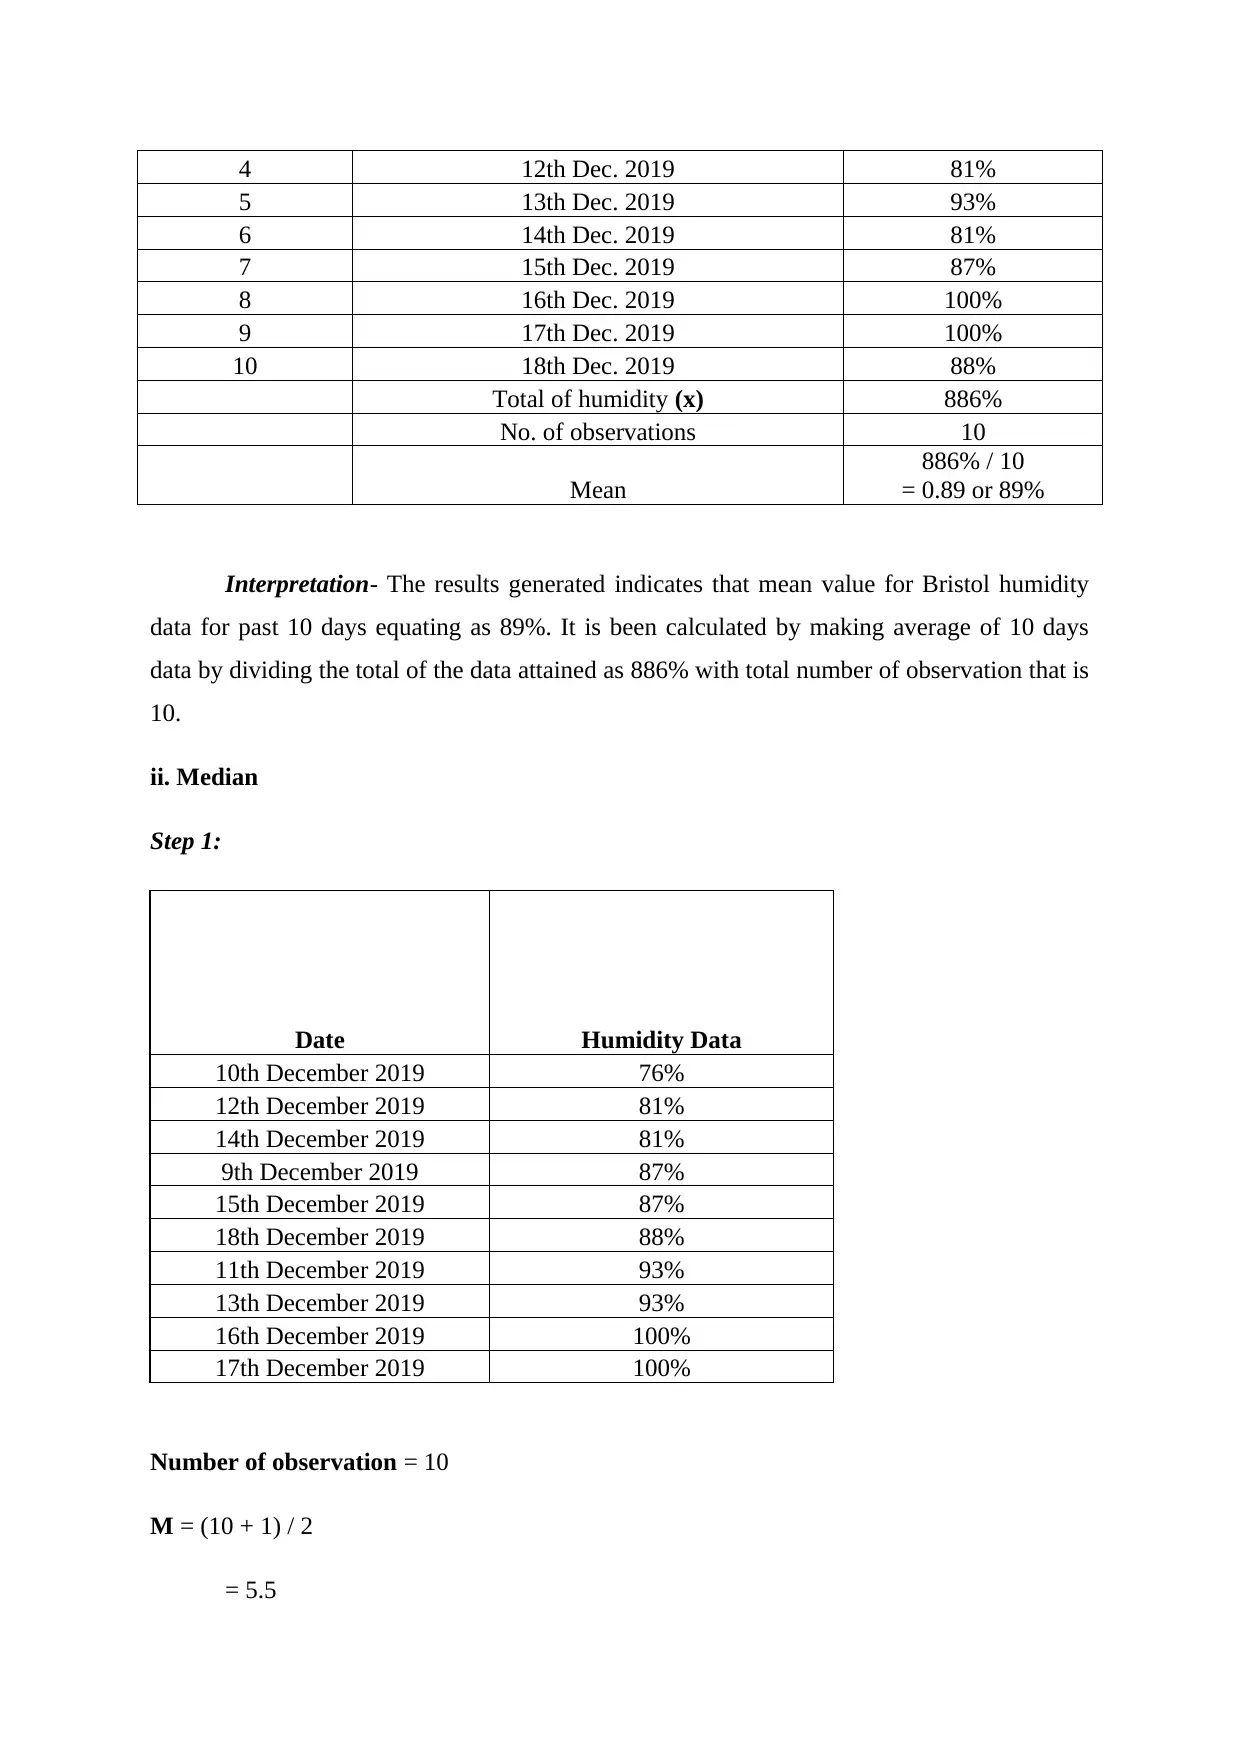
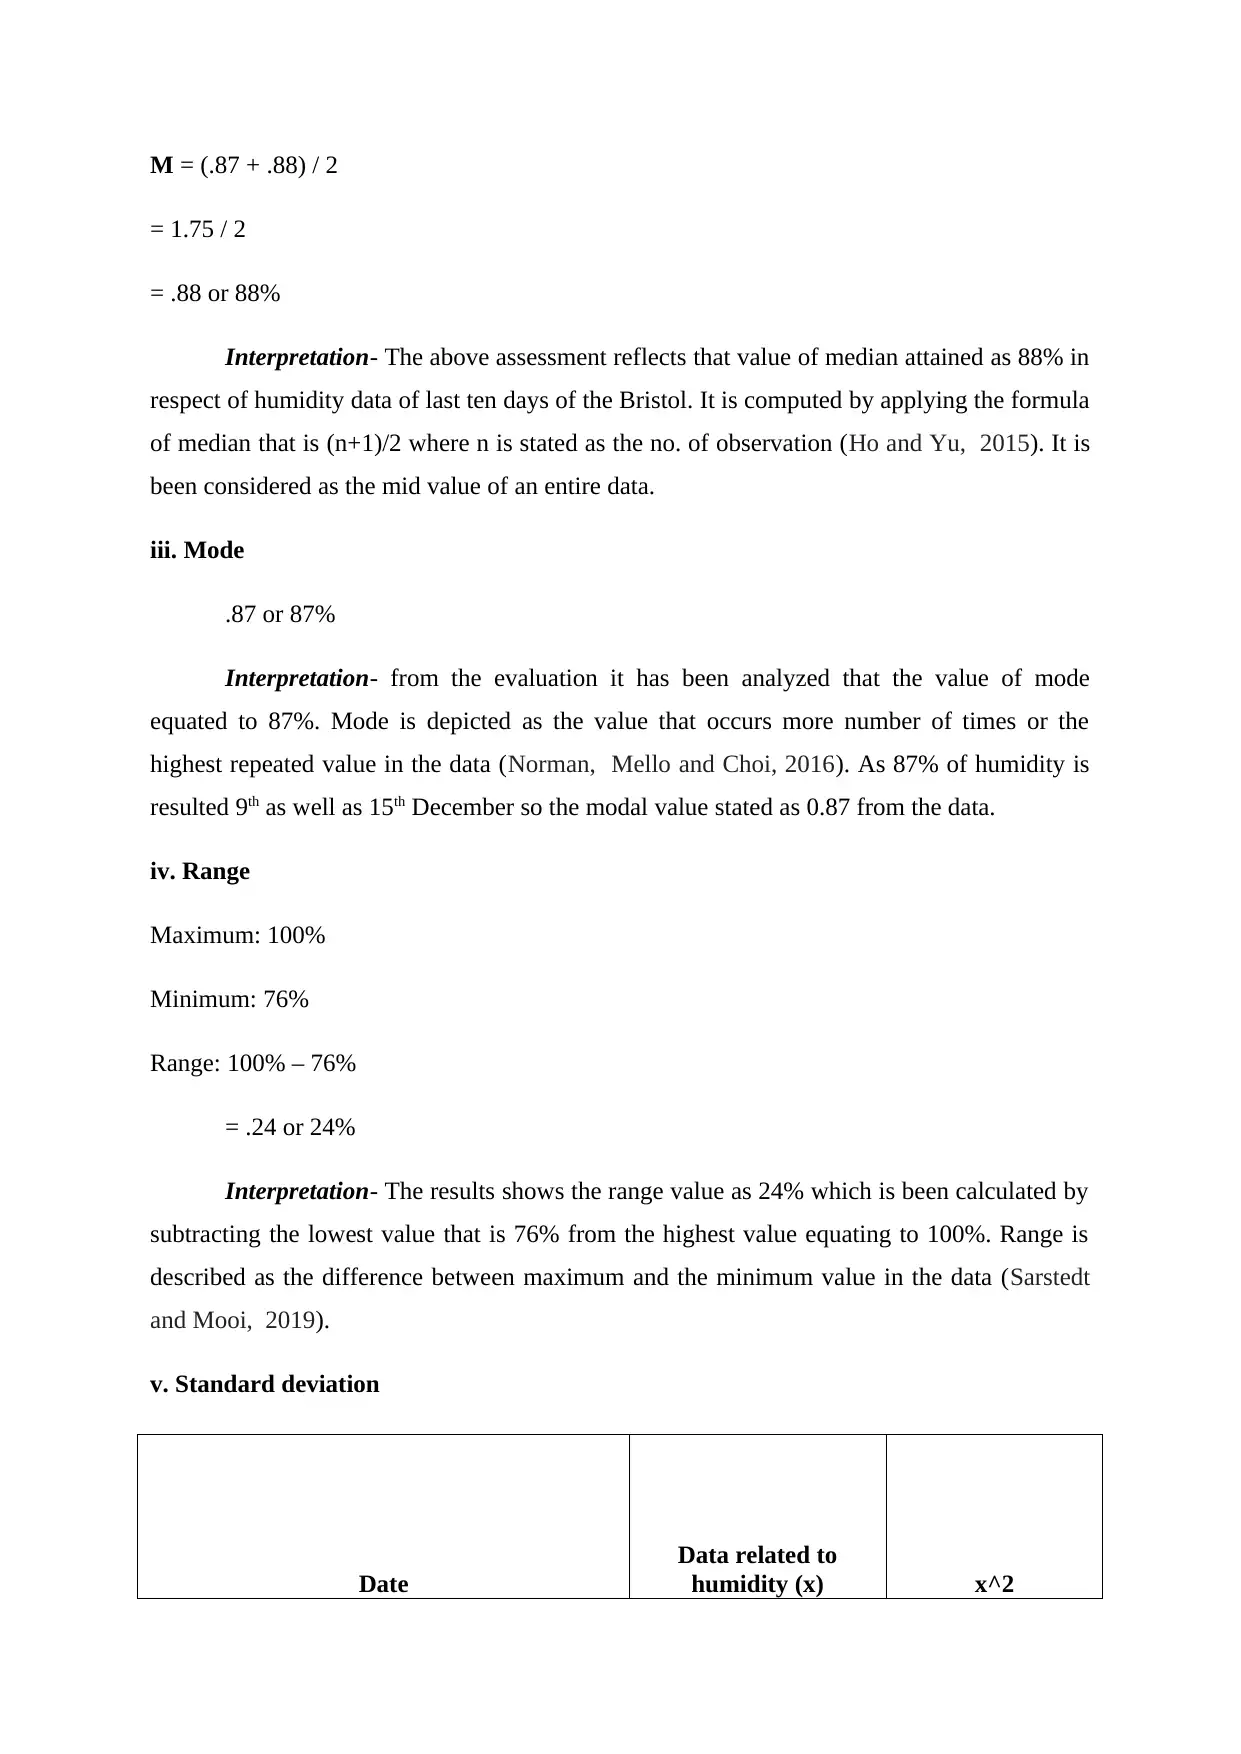
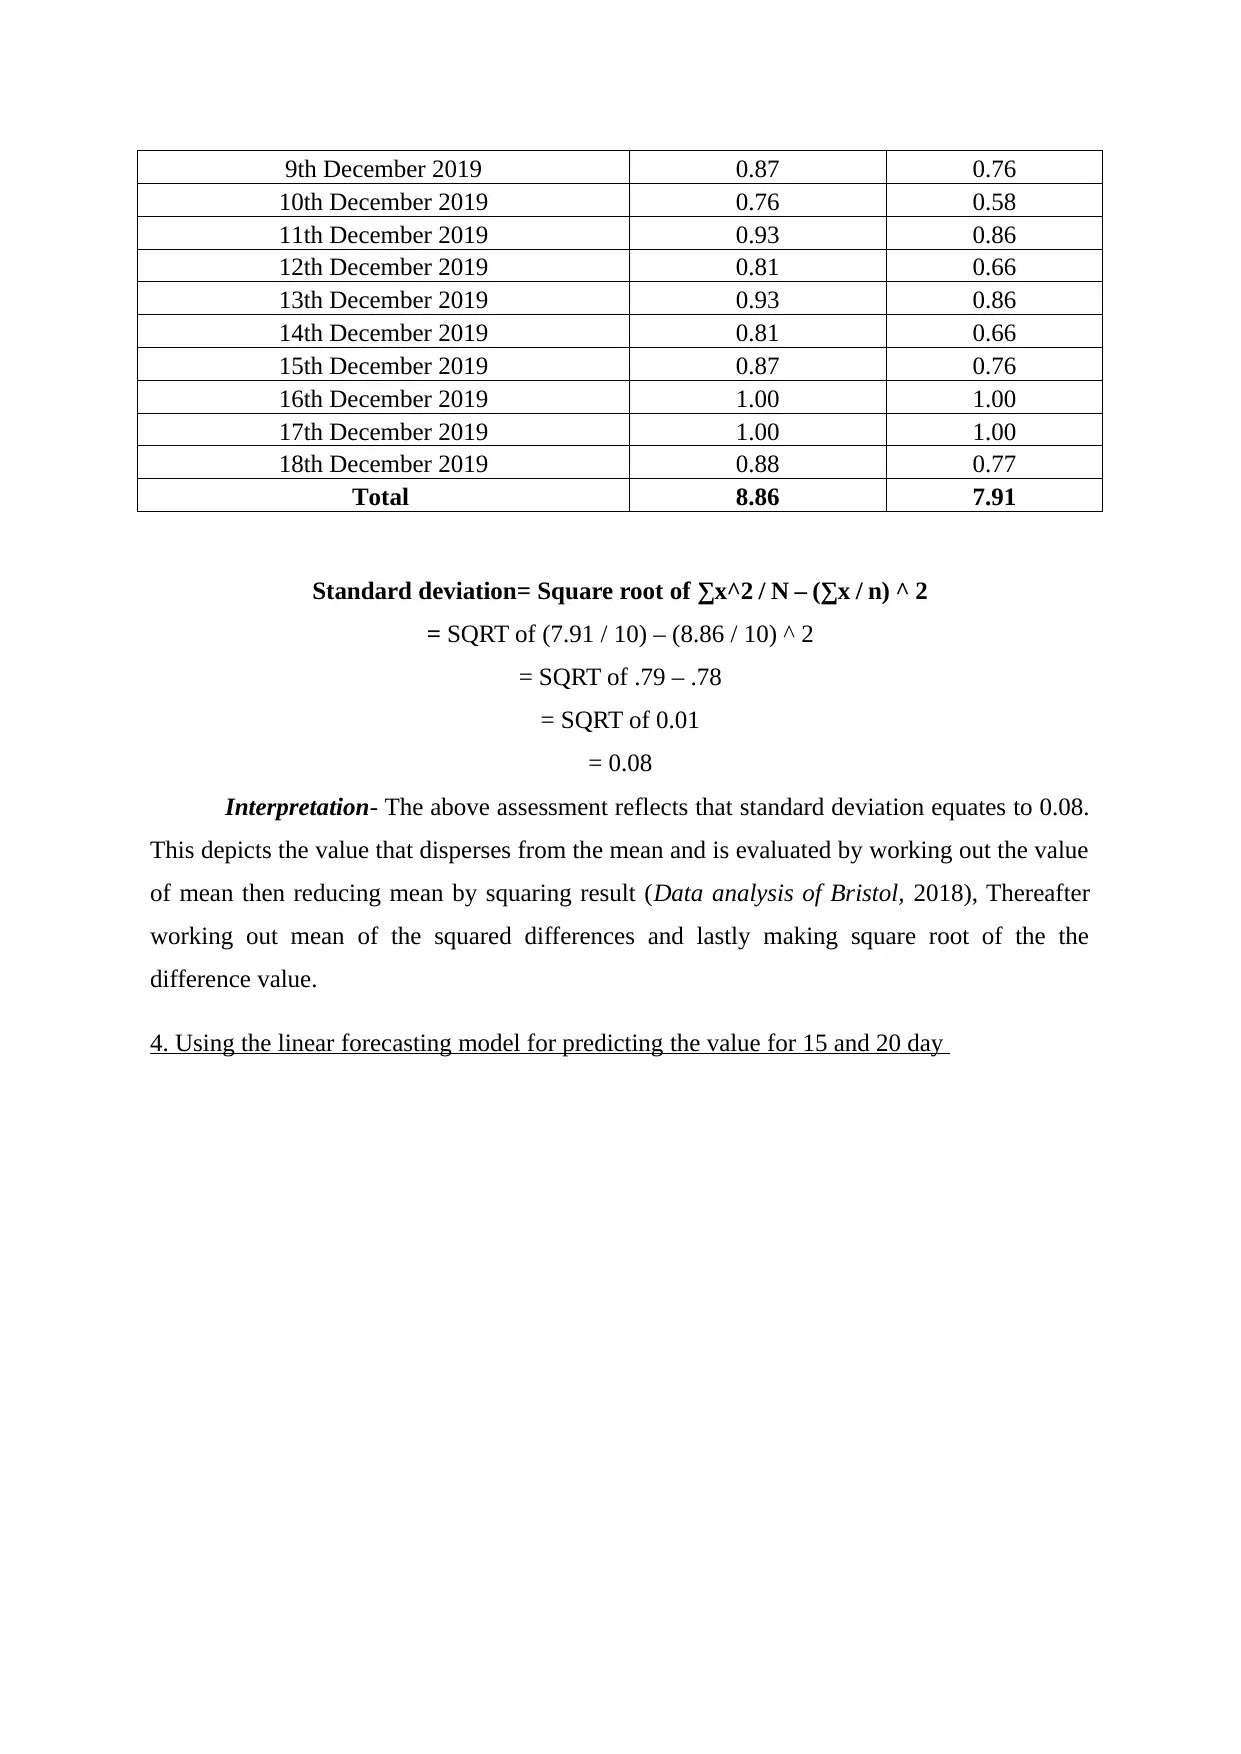
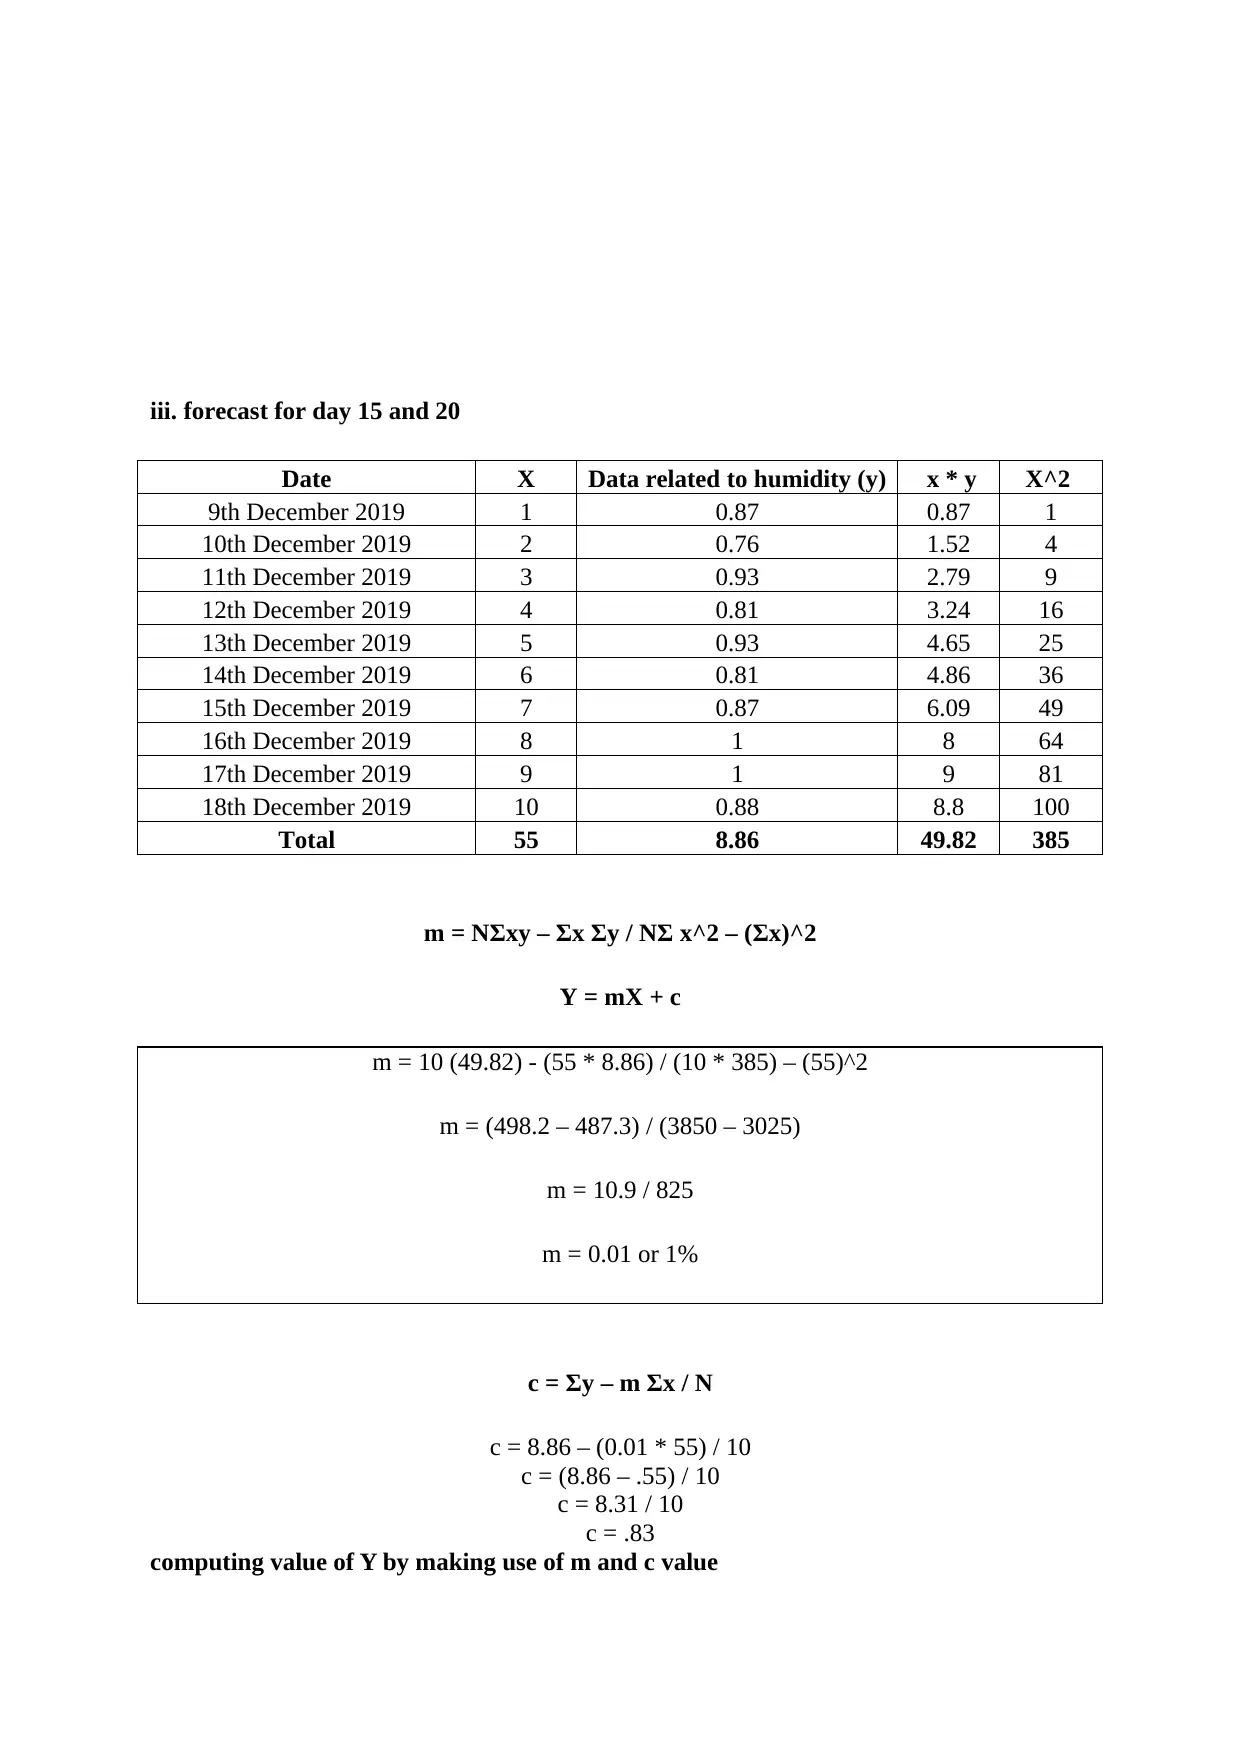
This report presents a comprehensive analysis of humidity data in Bristol, UK, over a ten-day period. It begins by organizing the data into tables and charts, followed by the computation of descriptive statistics, including mean, median, mode, range, and standard deviation. The mean humidity is calculated to be 89%, while the median is 88%, and the mode is 87%. The range is found to be 24%, and the standard deviation is 0.08, indicating the dispersion of the data from the mean. Furthermore, the report employs a linear forecasting model to predict humidity levels for days 15 and 20, resulting in predicted values of 0.98 and 1.03, respectively. The analysis concludes with a summary of findings, highlighting the increasing trend in Bristol's humidity, and emphasizes the utility of statistical techniques in understanding and predicting weather patterns. The report references several academic sources to support the analysis.
Document Page
Numeracy and Data Analysis
tabler-icon-diamond-filled.svg

Paraphrase This Document

Need a fresh take? Get an instant paraphrase of this document with our AI Paraphraser
Document Page
Document Page
INTRODUCTION
Numeracy and analyzing data refers to employing of the mathematical and the
statistical tools to the data in order to understand patters that might be hidden within the
numerical values. The current report based on Bristol, a city that lies in UK. Furthermore, the
report involves humidity weather data of last 10 days of Bristol. Moreover, it also includes
mean, median, mode, standard deviation and the range of the weather forecast data.
1. Arranging the data into table
Date humidity data
9th Dec. 2019 87%
10th Dec. 2019 76%
11th Dec. 2019 93%
12th Dec. 2019 81%
13th Dec. 2019 93%
14th Dec. 2019 81%
15th Dec. 2019 87%
16th Dec. 2019 100%
17th Dec. 2019 100%
18th Dec. 2019 88%
2. Presenting data in chart form
Line graph
Document Page
Column graph
3. computing descriptive statistics
i. Mean
S. No. Date
Data related to
humidity (x)
1 9th Dec. 2019 87%
2 10th Dec. 2019 76%
3 11th Dec. 2019 93%
tabler-icon-diamond-filled.svg

Paraphrase This Document

Need a fresh take? Get an instant paraphrase of this document with our AI Paraphraser
Document Page
4 12th Dec. 2019 81%
5 13th Dec. 2019 93%
6 14th Dec. 2019 81%
7 15th Dec. 2019 87%
8 16th Dec. 2019 100%
9 17th Dec. 2019 100%
10 18th Dec. 2019 88%
Total of humidity (x) 886%
No. of observations 10
Mean
886% / 10
= 0.89 or 89%
Interpretation- The results generated indicates that mean value for Bristol humidity
data for past 10 days equating as 89%. It is been calculated by making average of 10 days
data by dividing the total of the data attained as 886% with total number of observation that is
10.
ii. Median
Step 1:
Date Humidity Data
10th December 2019 76%
12th December 2019 81%
14th December 2019 81%
9th December 2019 87%
15th December 2019 87%
18th December 2019 88%
11th December 2019 93%
13th December 2019 93%
16th December 2019 100%
17th December 2019 100%
Number of observation = 10
M = (10 + 1) / 2
= 5.5
Document Page
M = (.87 + .88) / 2
= 1.75 / 2
= .88 or 88%
Interpretation- The above assessment reflects that value of median attained as 88% in
respect of humidity data of last ten days of the Bristol. It is computed by applying the formula
of median that is (n+1)/2 where n is stated as the no. of observation (Ho and Yu, 2015). It is
been considered as the mid value of an entire data.
iii. Mode
.87 or 87%
Interpretation- from the evaluation it has been analyzed that the value of mode
equated to 87%. Mode is depicted as the value that occurs more number of times or the
highest repeated value in the data (Norman, Mello and Choi, 2016). As 87% of humidity is
resulted 9th as well as 15th December so the modal value stated as 0.87 from the data.
iv. Range
Maximum: 100%
Minimum: 76%
Range: 100% – 76%
= .24 or 24%
Interpretation- The results shows the range value as 24% which is been calculated by
subtracting the lowest value that is 76% from the highest value equating to 100%. Range is
described as the difference between maximum and the minimum value in the data (Sarstedt
and Mooi, 2019).
v. Standard deviation
Date
Data related to
humidity (x) x^2
Document Page
9th December 2019 0.87 0.76
10th December 2019 0.76 0.58
11th December 2019 0.93 0.86
12th December 2019 0.81 0.66
13th December 2019 0.93 0.86
14th December 2019 0.81 0.66
15th December 2019 0.87 0.76
16th December 2019 1.00 1.00
17th December 2019 1.00 1.00
18th December 2019 0.88 0.77
Total 8.86 7.91
Standard deviation= Square root of ∑x^2 / N – (∑x / n) ^ 2
= SQRT of (7.91 / 10) – (8.86 / 10) ^ 2
= SQRT of .79 – .78
= SQRT of 0.01
= 0.08
Interpretation- The above assessment reflects that standard deviation equates to 0.08.
This depicts the value that disperses from the mean and is evaluated by working out the value
of mean then reducing mean by squaring result (Data analysis of Bristol, 2018), Thereafter
working out mean of the squared differences and lastly making square root of the the
difference value.
4. Using the linear forecasting model for predicting the value for 15 and 20 day
tabler-icon-diamond-filled.svg

Paraphrase This Document

Need a fresh take? Get an instant paraphrase of this document with our AI Paraphraser
Document Page
iii. forecast for day 15 and 20
Date X Data related to humidity (y) x * y X^2
9th December 2019 1 0.87 0.87 1
10th December 2019 2 0.76 1.52 4
11th December 2019 3 0.93 2.79 9
12th December 2019 4 0.81 3.24 16
13th December 2019 5 0.93 4.65 25
14th December 2019 6 0.81 4.86 36
15th December 2019 7 0.87 6.09 49
16th December 2019 8 1 8 64
17th December 2019 9 1 9 81
18th December 2019 10 0.88 8.8 100
Total 55 8.86 49.82 385
m = NΣxy – Σx Σy / NΣ x^2 – (Σx)^2
Y = mX + c
m = 10 (49.82) - (55 * 8.86) / (10 * 385) – (55)^2
m = (498.2 – 487.3) / (3850 – 3025)
m = 10.9 / 825
m = 0.01 or 1%
c = Σy – m Σx / N
c = 8.86 – (0.01 * 55) / 10
c = (8.86 – .55) / 10
c = 8.31 / 10
c = .83
computing value of Y by making use of m and c value
Document Page
For 15 days-
Y = mX + c
= 0.01(15)+0.83
= 0.15+0.83
= 0.98
For 20 days -
Y = mX + c
= 0.01(20)+0.83
= 0.2+0.83
= 1.03
Interpretation- From the above calculation it has been indicated that by making use
of the linear forecasting method, the humidity value for day 15 ascertained as 0.98 and for
day 20 equated as 1.03. This value is been computed by multiplying the value of m with
x(day) and adding it to the value of c. This model helps in making forecasting of the humidity
weather for the future periods in an effective manner.
CONCLUSION
From the above report, it has been concluded that humidity forecast of Bristol in the
ten days shown a rising trend which in turn means that humidity has been increased in the
climate of Bristol, UK. Application of statistical techniques helps in knowing the average,
mid value, repeated value and range of the data.
Document Page
REFERENCES
Books and journals
Ho, A. D. and Yu, C. C., 2015. Descriptive statistics for modern test score distributions:
Skewness, kurtosis, discreteness, and ceiling effects. Educational and Psychological
Measurement. 75(3). pp.365-388.
Norman, C., Mello, M. and Choi, B., 2016. Identifying frequent users of an urban emergency
medical service using descriptive statistics and regression analyses. Western Journal of
Emergency Medicine. 17(1). p.39.
Sarstedt, M. and Mooi, E., 2019. Descriptive Statistics. In A Concise Guide to Market
Research (pp. 91-150). Springer, Berlin, Heidelberg.
Online
Data analysis of Bristol. 2018. [Online]. Avaialble
through:<https://www.timeanddate.com/weather/uk/bristol/historic>
tabler-icon-diamond-filled.svg

Paraphrase This Document

Need a fresh take? Get an instant paraphrase of this document with our AI Paraphraser
Document Page
chevron_up_icon
1 out of 11
circle_padding
hide_on_mobile
zoom_out_icon