Wind Speed Data Analysis and Linear Forecasting for Bristol, UK

Verified

Added on  2023/06/10

|11
|1494
|55
Practical Assignment
AI Summary
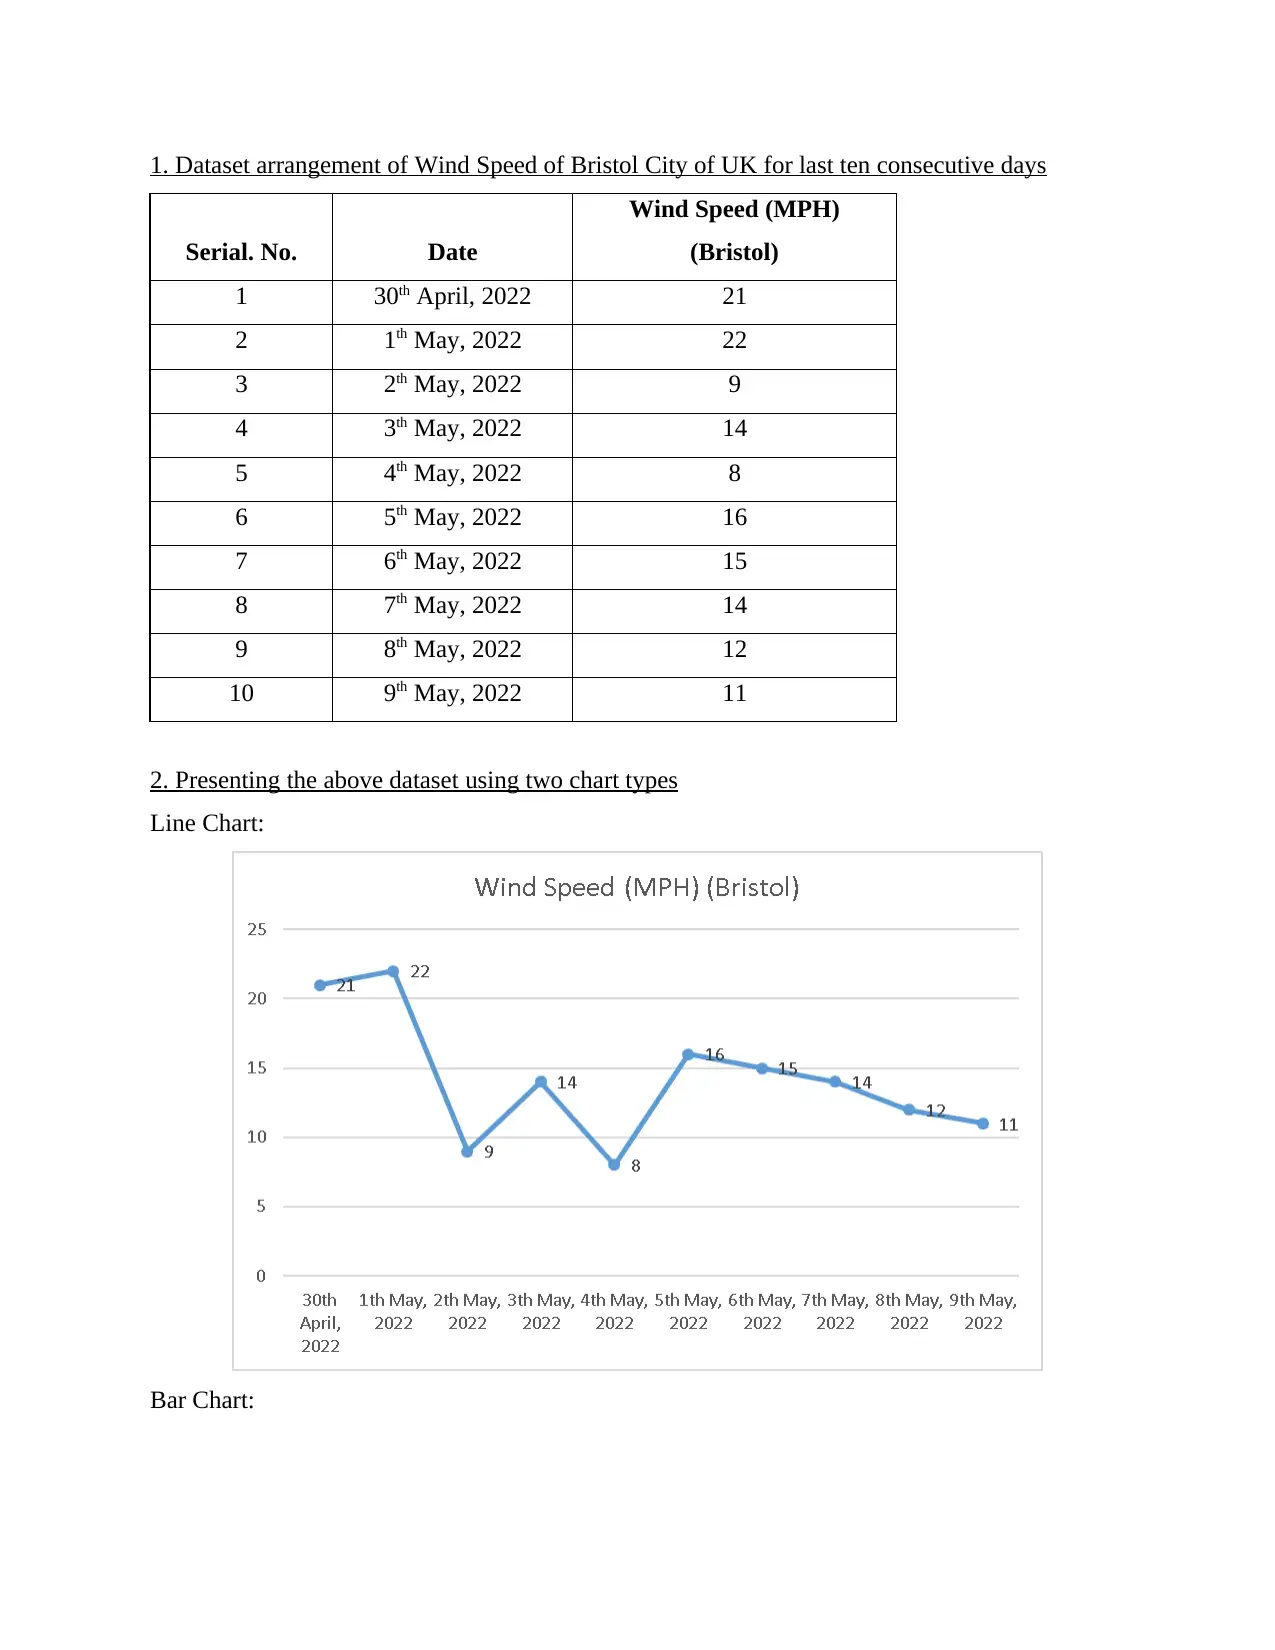
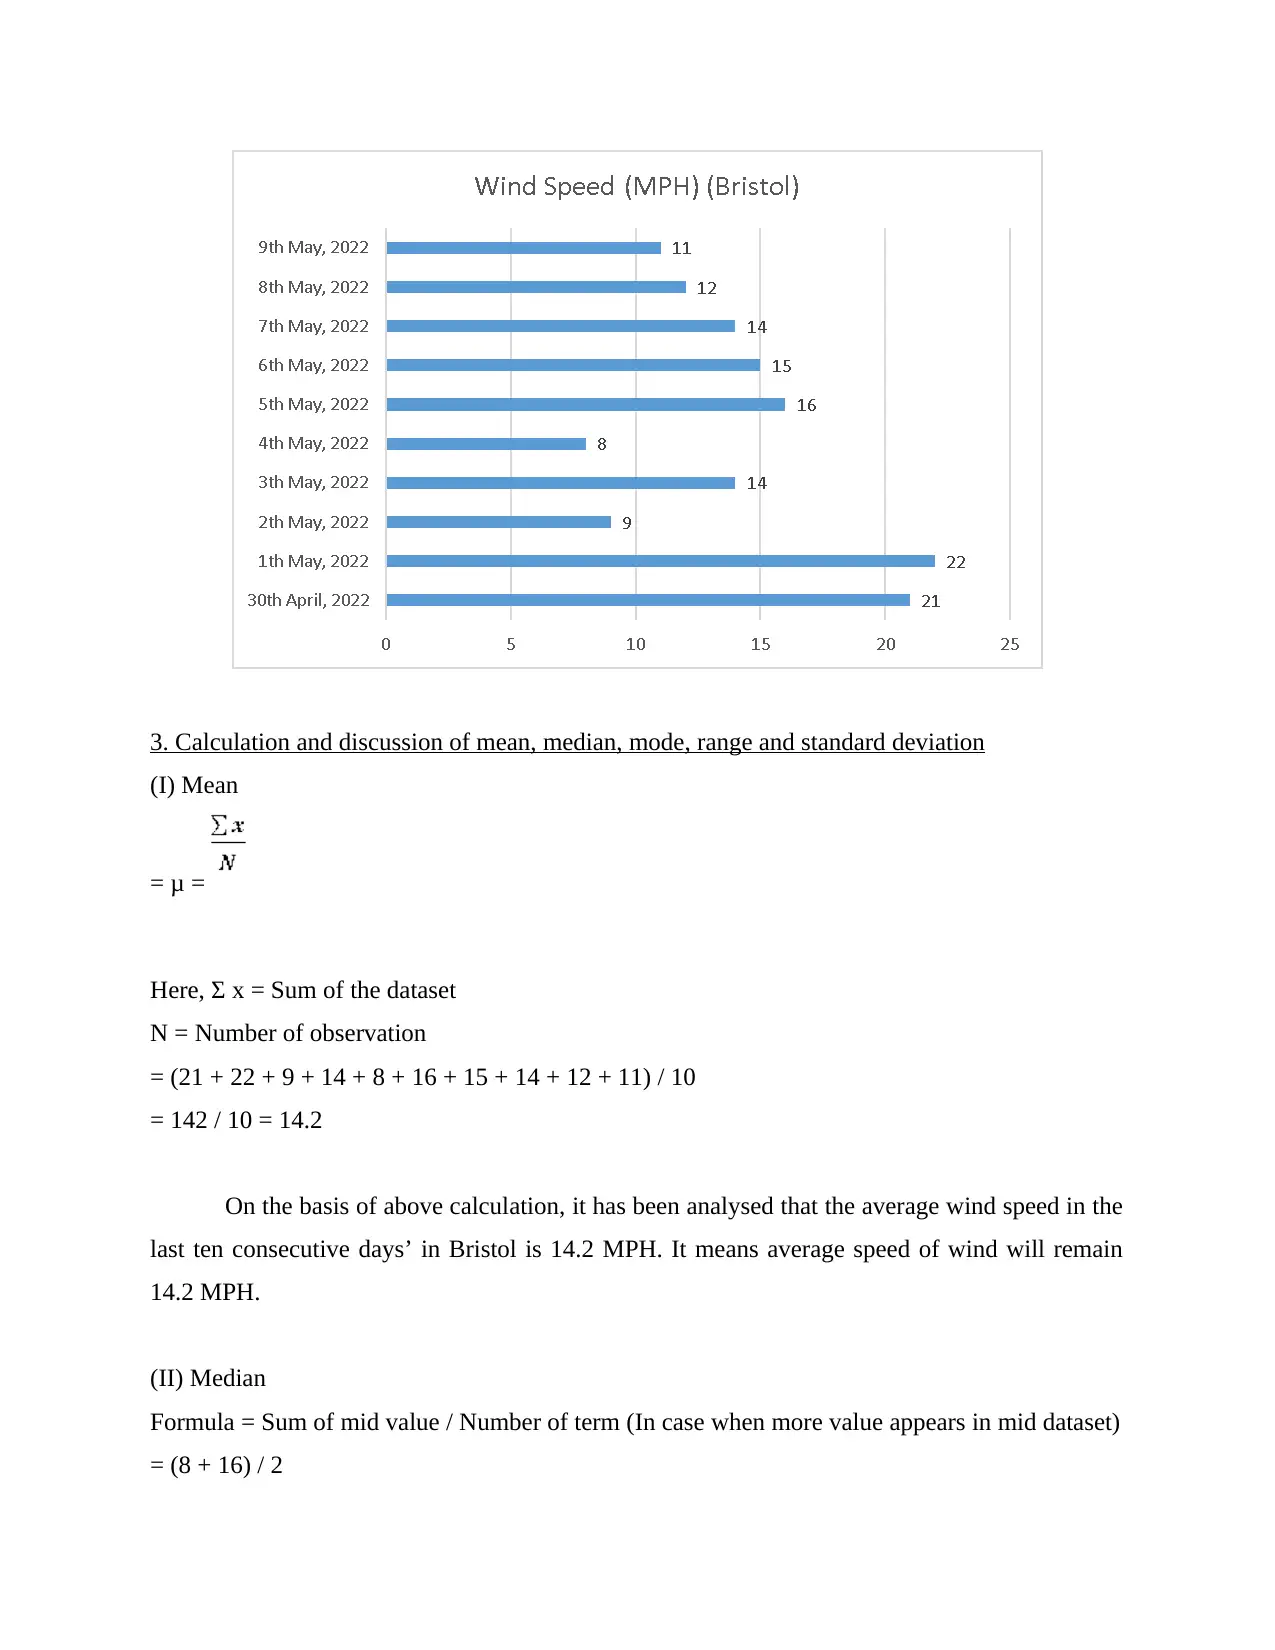
This assignment presents a comprehensive analysis of wind speed data collected from Bristol, UK, over a ten-day period. The analysis begins with the arrangement of the dataset, followed by its visual representation using both line and bar charts. Statistical measures, including mean, median, mode, range, and standard deviation, are calculated and discussed to provide insights into the data's characteristics and distribution. The assignment then employs a linear forecasting model to predict wind speeds on the 12th and 14th days. The calculation of the slope (m) and intercept (c) values of the model are detailed, and the predicted wind speeds for the specified days are presented, offering a practical application of the forecasting technique. References to relevant literature are also provided, supporting the methodologies and concepts applied in the analysis.
tabler-icon-diamond-filled.svg

Contribute Materials

Your contribution can guide someone’s learning journey. Share your documents today.
Document Page
Data Analysis and
Forecasting
tabler-icon-diamond-filled.svg

Secure Best Marks with AI Grader

Need help grading? Try our AI Grader for instant feedback on your assignments.
Document Page
Table of Contents
1. Dataset arrangement of Wind Speed of Bristol City of UK for last ten consecutive days......3
2. Presenting the above dataset using two chart types.................................................................3
3. Calculation and discussion of mean, median, mode, range and standard deviation................4
4. Calculation and discussion of m, c 12th and 14th day value of data set using linear forecasting
model...........................................................................................................................................6
(I) Calculation of m value............................................................................................................8
(II) Calculation of c value............................................................................................................8
(III) Forecasting wind speed on 12th and 14th day of Bristol, UK................................................9
REFERENCES................................................................................................................................1
Document Page
1. Dataset arrangement of Wind Speed of Bristol City of UK for last ten consecutive days
Serial. No. Date
Wind Speed (MPH)
(Bristol)
1 30th April, 2022 21
2 1th May, 2022 22
3 2th May, 2022 9
4 3th May, 2022 14
5 4th May, 2022 8
6 5th May, 2022 16
7 6th May, 2022 15
8 7th May, 2022 14
9 8th May, 2022 12
10 9th May, 2022 11
2. Presenting the above dataset using two chart types
Line Chart:
Bar Chart:
Document Page
3. Calculation and discussion of mean, median, mode, range and standard deviation
(I) Mean
= μ =
Here, Σ x = Sum of the dataset
N = Number of observation
= (21 + 22 + 9 + 14 + 8 + 16 + 15 + 14 + 12 + 11) / 10
= 142 / 10 = 14.2
On the basis of above calculation, it has been analysed that the average wind speed in the
last ten consecutive days’ in Bristol is 14.2 MPH. It means average speed of wind will remain
14.2 MPH.
(II) Median
Formula = Sum of mid value / Number of term (In case when more value appears in mid dataset)
= (8 + 16) / 2
tabler-icon-diamond-filled.svg

Secure Best Marks with AI Grader

Need help grading? Try our AI Grader for instant feedback on your assignments.
Document Page
= 12
On the basis of above calculation, it has been analysed that the mid value of the dataset is
12. It means the middle value of wind speed in last ten days is 12 MPH.
(III) Mode
The value that appear that appear frequently in dataset
= 14
The mode is a statistical measure which state the value within the dataset that appear
frequently that is more time. On this basis, 14 MPH is a wind speed that appear two time in the
dataset thus the mode value is 14 (Bacit, 2019).
(IV) Range
Formula = Upper Value – Lower Value
= 21 – 11
= 10
The difference between upper value and lower value of dataset is known as range. On the
basis of above calculation, the range is 10 MPH.
(V) Standard Deviation
Formula:
σ =
Date Wind Speed (MPH)
(Bristol) (X- Mean) (X-Mean)^2
Document Page
30th April, 2022 21 6.8 46.24
1th May, 2022 22 7.8 60.84
2th May, 2022 9 -5.2 27.04
3th May, 2022 14 -0.2 0.04
4th May, 2022 8 -6.2 38.44
5th May, 2022 16 1.8 3.24
6th May, 2022 15 0.8 0.64
7th May, 2022 14 -0.2 0.04
8th May, 2022 12 -2.2 4.84
9th May, 2022 11 -3.2 10.24
Mean 14.2 191.6
σ = √191.6 / 10
= 4.3772
Standard deviation is value that express the dispersion of the dataset relative to its mean and
basically computed as a square root of the variance. The standard deviation of current dataset as
per above calculation is 4.3772. This indicate that each day wind speed is 4.3772 time differ than
the mean of the wind speed such as 14.2. The standard deviation helps in the study of the data
and also make the interpretation of dataset easier. With the help of SD, the amount of data that is
clustered around the mean value is shown (Schreiber-Barsch, Curdt and Gundlach, 2020).
Document Page
4. Calculation and discussion of m, c 12th and 14th day value of data set using linear forecasting
model
Linear Forecasting Model Formula
Y = mx + c
This is one of the best model to forecast the future value of the dataset and with the help of this
model, the 12th and 14th day of wind speed is easily computed.
Serial.
No.
(X)
Date
Wind Speed
(MPH)
(Bristol) (Y)
xy x^2
1 30th April, 2022 21 21 1
2 1th May, 2022 22 44 4
3 2th May, 2022 9 27 9
4 3th May, 2022 14 56 16
5 4th May, 2022 8 40 25
6 5th May, 2022 16 96 36
7 6th May, 2022 15 105 49
8 7th May, 2022 14 112 64
tabler-icon-diamond-filled.svg

Paraphrase This Document

Need a fresh take? Get an instant paraphrase of this document with our AI Paraphraser
Document Page
9 8th May, 2022 12 108 81
10 9th May, 2022 11 110 100
55 142 719 385
(I) Calculation of m value
Formula =
m = (10 * 719) – (55 * 142) / (10 * 385) – (55)2
m = 7190 – 7810 / 3850 – 3025
m = -620 / 825
m = -0.7515
The above calculation indicates the m value is -0.7515 which is basically the slope of linear
forecasting mode (Lüssenhop and Kaiser, 2020). The slope is negative which indicate negative
correlation between days and wind speed variable.
(II) Calculation of c value
Formula =
c = 142 – (-0.7515 * 55) / 10
c = 142 – (-41.3325) / 10
c = 183.3325/ 10
c = 18.3332
Document Page
According to above calculation, it has been analysed that the c value of linear forecasting
model is 18.3332 which is intercept value. This is also known as constant that represent the mean
value of responses variable when other predictor value is zero (Aunio and et.al., 2019).
(III) Forecasting wind speed on 12th and 14th day of Bristol, UK
Expected Wind speed on 12th day
Formula = Y = mx + c
Here, m = -0.7515
x = 12
c = 18.3332
Y = (-0.7515 * 12) + 18.3332
= -9.018 + 18.3332
= 9.3152 or 9 MPH approx.
On the basis of above calculation using linear forecasting model, it has been forecasted
that the wind speed on 12th day of Bristol will be 9 MPH approx. It means on 11th May 2022, the
wind speed will reduce to 9 MPH from 11 MPH on 10th day i.e., 9th May 2022.
Expected wind speed on 14th day
Formula = Y = mx + c
Here, m = -0.7515
x = 14
c = 18.3332
Y = (-0.7515 * 14) + 18.3332
= -10.521 + 18.3332
= 7.8122 or 8 MPH approx.
Also, with the use of linear forecasting model, it has been forecasted that the wind speed
will further reduce to 8 MPH on 14th day i.e., 13th May 2022. This means that on 14th day the
wind speed will reduce as per trend (Zeuner, Pabst and Benz-Gydat, 2020).
Document Page
tabler-icon-diamond-filled.svg

Secure Best Marks with AI Grader

Need help grading? Try our AI Grader for instant feedback on your assignments.
Document Page
REFERENCES
Books and journals
Bacit, J. K., 2019. Impact Assessment of Numeracy Assessment tools with E-games in the
Performance in Mathematics of Grade 8 Students of Bilaran National High
School. Ascendens Asia Journal of Multidisciplinary Research Abstracts. 3(2E).
Schreiber-Barsch, S., Curdt, W. and Gundlach, H., 2020. Whose voices matter? Adults with
learning difficulties and the emancipatory potential of numeracy practices. ZDM. 52(3).
pp.581-592.
Lüssenhop, M. and Kaiser, G., 2020. Refugees and numeracy: what can we learn from
international large-scale assessments, especially from TIMSS?. ZDM. 52(3). pp.541-555.
Zeuner, C., Pabst, A. and Benz-Gydat, M., 2020. Numeracy practices and vulnerability in old
age: Interdependencies and reciprocal effects. ZDM.52(3). pp.501-513.
Aunio, P. and et.al., 2019. Multi-factorial approach to early numeracy—The effects of cognitive
skills, language factors and kindergarten attendance on early numeracy performance of
South African first graders. International Journal of Educational Research. 97. pp.65-76.
1
chevron_up_icon
1 out of 11
circle_padding
hide_on_mobile
zoom_out_icon
logo.png

Your All-in-One AI-Powered Toolkit for Academic Success.

Available 24*7 on WhatsApp / Email

[object Object]