Insights Report: Descriptive Statistics for British Airways (CA4051)
VerifiedAdded on 2023/01/12
|12
|2812
|86
Report
AI Summary
This report presents a statistical analysis of British Airways data, focusing on travel patterns to England. The research utilizes descriptive statistics to address key questions, including the most frequent age groups, employment statuses, and travel months. The methodology involves data collection from the GB Tourism Survey archive, selecting the "England - All Trip Purposes 2017" dataset. Data analysis employs cross-sectional research design and statistical software like Microsoft Excel to determine mean, mode, median, standard deviation, range, and maximum values for each variable. Findings reveal that the 45-54 age group travels to England most frequently, with full-time employed individuals showing the highest travel rates and spending. Based on these findings, the report recommends targeted marketing strategies to enhance customer satisfaction and increase revenue by focusing on specific demographics and optimizing flight offerings during peak travel periods. This analysis provides valuable insights for British Airways to refine its market positioning and address the needs of its target customers effectively.

Statistics
Paraphrase This Document
Need a fresh take? Get an instant paraphrase of this document with our AI Paraphraser
Contents
INTRODUCTION...........................................................................................................................1
Client Description........................................................................................................................1
Research Questions......................................................................................................................1
Practical Importance....................................................................................................................1
METHOD........................................................................................................................................2
Data Collection............................................................................................................................2
Data Analysis...............................................................................................................................3
FINDINGS.......................................................................................................................................4
INTRODUCTION
Client Description
British Airways is an aviation organisation of United Kingdom which has headquarters in
London, England. This company is one of the most successful airlines of all the times. But
recently this company is facing various issues due to poor customer service. According to the
customer reviews and declining number of passengers, it has been analysed that the service
quality of this company is continuously degrading. British Airways is our client which is
concerned that their competitors will take advantage of this situation. For this purpose, an
investigation is conducted to determine who the target customers of this company are and what
the time of their travel is so that they can be provided with exciting offers along with quality
service so that British Airways can regain their position in market and enhance their brand
image. It has been also analysed that the major complaints of passengers are acquired who were
travelling to England.
This research is conducted to identify the elements and approaches which can help British
Airways to regain their market position and satisfy their customer’s needs. As British Airways
has its headquarters in England, it is even more important to satisfy customers travelling to this
region. Data for all purposes trip visits in England is considered for this purpose.
Research Questions
1. Which age group (16-24, 25-34, 35-44, 45-54, 55-64 and 65+) travels the most in England?
2. People of which employment status (Full time, Part time and other) visit England and spends
the most?
3. In which month people travel most in England?
Practical Importance
The three research questions which are developed above are set in such a way that it will
provide categorical information to British Airways regarding when, how and to whom, promote
the offers for travelling England and by this way British Airways can sustain their market image
and can satisfy the needs of their consumers.
1
⊘ This is a preview!⊘
Do you want full access?
Subscribe today to unlock all pages.
Trusted by 1+ million students worldwide
The first question is developed in a way that it will provide insights regarding the age
group of people who travel the most in England. Using this information, British Airways can
target that age group only and provide special offers and discounts to them while travelling.
The second question which is developed will provide insights of the employment status of
people which travels the most in England along with their speeding’s while travelling, by this
British Airways can identify which people are willing to pay for their flights and to which people
they must provide their offers to and set their positioning strategy accordingly.
The third question will help in providing the insights for the time period in which people
travels the most in England. By using this information, British Airways can launch additional
flights to England so that customer needs will be satisfied and company will also be able to earn
huge revenue.
Using the insights gained from above three question results, British Airways can develop
their positioning strategy regarding in which month, to whom and carrying what employment
status, they must provide attractive offers. In all three questions, “number of passengers
travelling to England” is a dependent variable with fout distinctive independent variables which
are “age group”, “employment status” & “spending at the time of travel” and “month of travel”.
METHOD
Data Collection
The data in this report is collected from GB Tourism Survey archive. Among various data
sets available, data set of “England - All Trip Purposes 2017” is selected. This database contains
data survey which was taken by adults aged 16 and over and accompanying children aged up to
15 in 2017. The population of this survey is people who have travelled to England in 2017.
Instead of carrying primary data, this data set contains classified information. There are various
variables in this data set which are Purpose of trip, Destination type, Regions visited,
Accommodation, Month Trip Started, Lifecycle, Car, Children, Working, Marital status, Social
Grade and Age. Among all these variables, only three are selected for this research.
The selected data is a medium sized data not having too many variables and complexities.
The quality, reliability and viability of the data are high as it has been collected by tourism
authority of Great Britain which is “visitbritain.org”.
2
Paraphrase This Document
Need a fresh take? Get an instant paraphrase of this document with our AI Paraphraser
The size of the population using which this data set is prepared is not disclosed but it has
been estimated that the probable size of this data set includes each individual who has travelled
England in the year 2017. The minimal sample size for this dataset is 18 million with 95% of
confidence interval and 5% of error margin. The data set was constructed using travel
information of all the people who has visited in England. There is a limitation in this data set that
no resources are given from where this information was gained but this limitation will not
influence the present investigation.
Data Analysis
Data analysis is a process of analysing the data so that relevant information can be gained
from that data. Before analysing the data, it is important to identify the research design which
will be used while analysing the data. Broadly there are two types of research designs which are
cross sectional and longitudinal.
Which age group (16-24, 25-34, 35-44, 45-54, 55-64 and 65+) travels the most in England?
The above question represents a single cross sectional research design as the data which
is been collected does not involves any time frames. Using this design and research question, two
variables will be used at once which are number of trips (dependent variable) and age group
(discrete independent variable). Both of the variables are recorded at a single time due to which
it utilises single cross sectional design.
In order to answer this question, a statistical software will be used which is Microsoft
Excel. Using this software, descriptive statistics of the both the variables will be gained. This
statistics will include mean, mode, media, minimum, maximum, range and standard deviation.
Using mean, it can be analysed what is the average age group of people who visit England. The
most important descriptive analysis tools which will be used are mode and maximum. Using
maximum, it will be analysed which age group has maximum recoded trips to England and mode
will provide the result of highest recurring trips record. The end result will be considered by
maximum tool.
People of which employment status (Full time, Part time and other) visit England and
spends the most?
The above question also represents cross sectional research design having a dependent
variable of number of trips and independent discrete variables of employment status and
3
spending at the time travel. For this question, the descriptive statistics will be used. The results
for this question will be based upon maximum values of people which travel the most in England
and the people who spend the most while travelling. If in case answers to these two variables are
different, then other tools such as mean, mode, median and minimum will be used as well.
In which month people travel most in England?
The third question also represents cross sectional research design in which two variables
that are number of trips (dependent) and month of travel (discrete independent variable) is used
to analyse the month in which highest trips to England has been taken place. To answer this
question, Micro Excel will be used as statistical software. Among all the tools of descriptive
analysis, maximum will be used to interpret end result.
FINDINGS
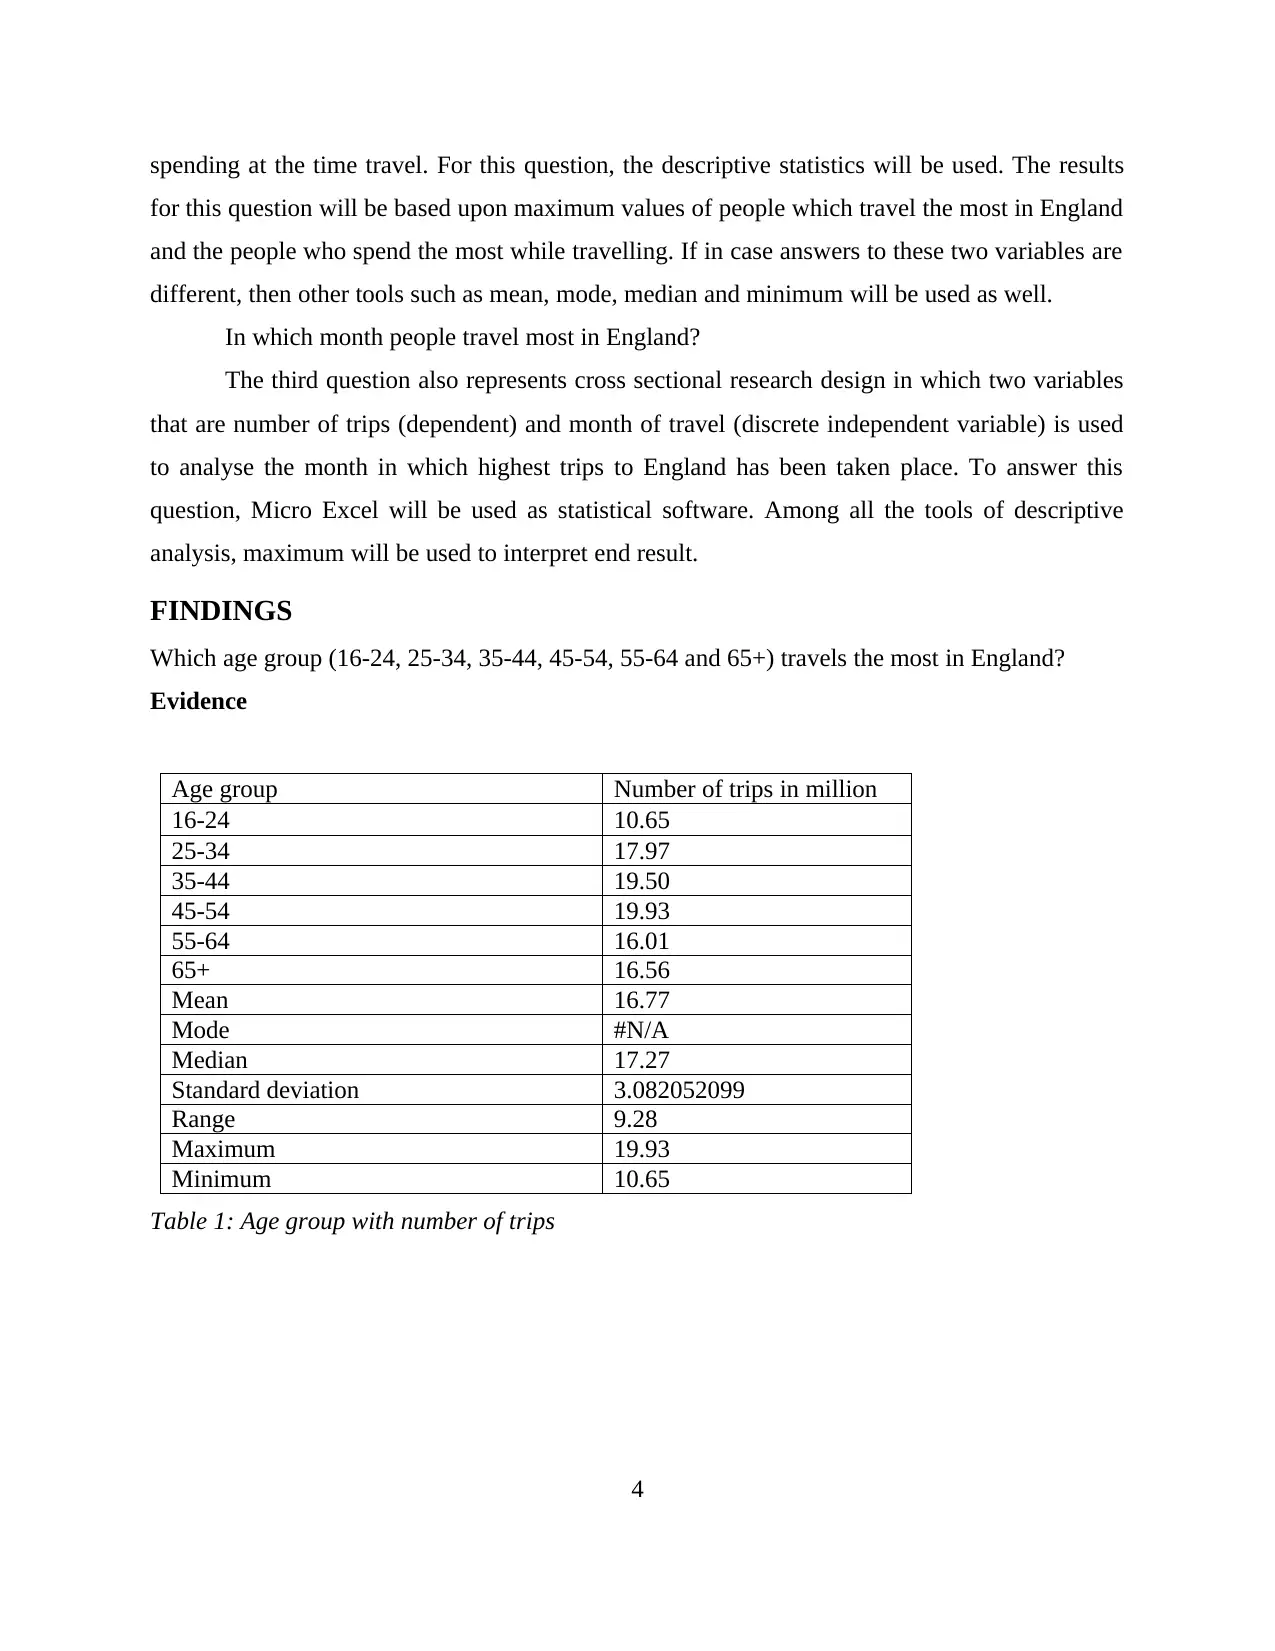
Which age group (16-24, 25-34, 35-44, 45-54, 55-64 and 65+) travels the most in England?
Evidence
Age group Number of trips in million
16-24 10.65
25-34 17.97
35-44 19.50
45-54 19.93
55-64 16.01
65+ 16.56
Mean 16.77
Mode #N/A
Median 17.27
Standard deviation 3.082052099
Range 9.28
Maximum 19.93
Minimum 10.65
Table 1: Age group with number of trips
4
for this question will be based upon maximum values of people which travel the most in England
and the people who spend the most while travelling. If in case answers to these two variables are
different, then other tools such as mean, mode, median and minimum will be used as well.
In which month people travel most in England?
The third question also represents cross sectional research design in which two variables
that are number of trips (dependent) and month of travel (discrete independent variable) is used
to analyse the month in which highest trips to England has been taken place. To answer this
question, Micro Excel will be used as statistical software. Among all the tools of descriptive
analysis, maximum will be used to interpret end result.
FINDINGS
Which age group (16-24, 25-34, 35-44, 45-54, 55-64 and 65+) travels the most in England?
Evidence
Age group Number of trips in million
16-24 10.65
25-34 17.97
35-44 19.50
45-54 19.93
55-64 16.01
65+ 16.56
Mean 16.77
Mode #N/A
Median 17.27
Standard deviation 3.082052099
Range 9.28
Maximum 19.93
Minimum 10.65
Table 1: Age group with number of trips
4
⊘ This is a preview!⊘
Do you want full access?
Subscribe today to unlock all pages.
Trusted by 1+ million students worldwide
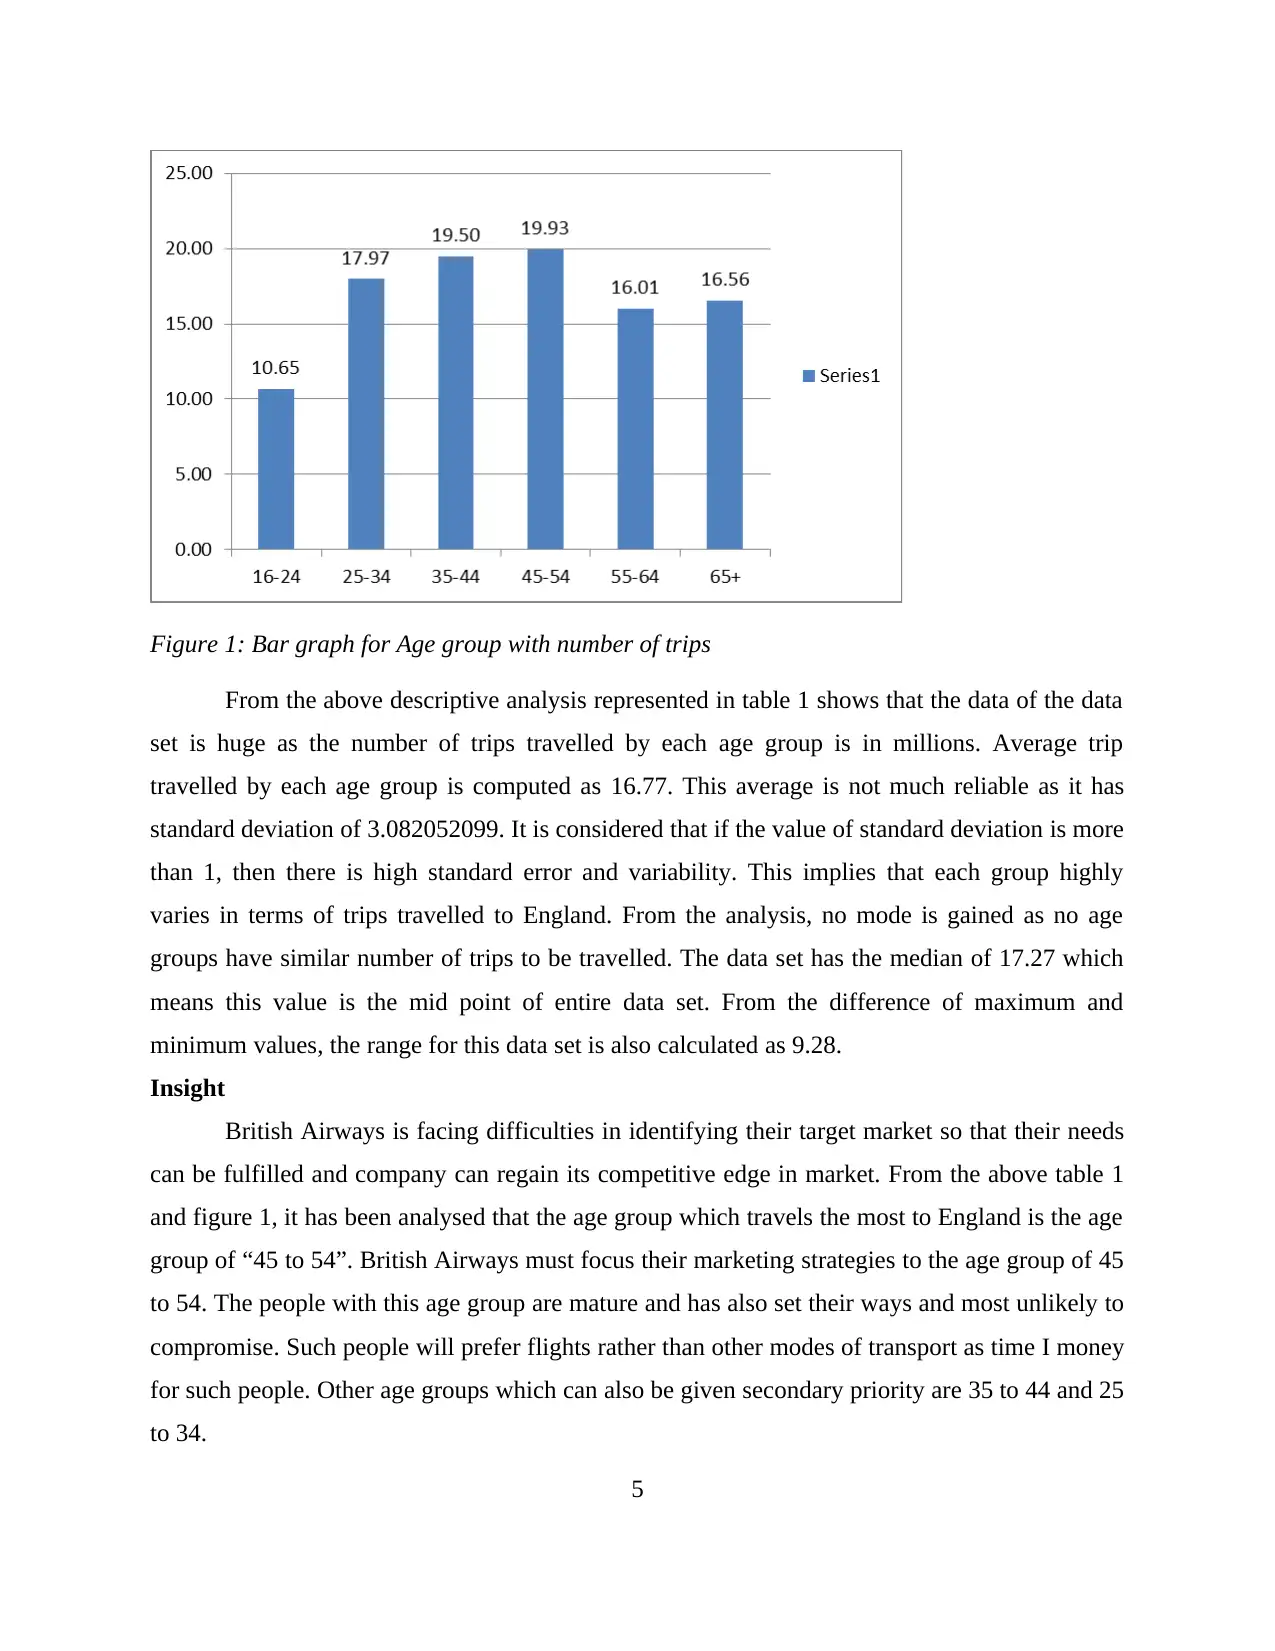
Figure 1: Bar graph for Age group with number of trips
From the above descriptive analysis represented in table 1 shows that the data of the data
set is huge as the number of trips travelled by each age group is in millions. Average trip
travelled by each age group is computed as 16.77. This average is not much reliable as it has
standard deviation of 3.082052099. It is considered that if the value of standard deviation is more
than 1, then there is high standard error and variability. This implies that each group highly
varies in terms of trips travelled to England. From the analysis, no mode is gained as no age
groups have similar number of trips to be travelled. The data set has the median of 17.27 which
means this value is the mid point of entire data set. From the difference of maximum and
minimum values, the range for this data set is also calculated as 9.28.
Insight
British Airways is facing difficulties in identifying their target market so that their needs
can be fulfilled and company can regain its competitive edge in market. From the above table 1
and figure 1, it has been analysed that the age group which travels the most to England is the age
group of “45 to 54”. British Airways must focus their marketing strategies to the age group of 45
to 54. The people with this age group are mature and has also set their ways and most unlikely to
compromise. Such people will prefer flights rather than other modes of transport as time I money
for such people. Other age groups which can also be given secondary priority are 35 to 44 and 25
to 34.
5
Paraphrase This Document
Need a fresh take? Get an instant paraphrase of this document with our AI Paraphraser
Strategy
Considering above evidence and insights gained from descriptive analysis, it has been
concluded that the people of age group 35 to 44 and 45 to 54 are the major travellers in England.
Considering this conclusion, it has been recommended to British Airways that they should
position their brand in such a way that it will attract people from these age groups. British
Airways can enhance their food plans in flights as people with these age groups are usually strict
when it comes to their food preferences. Also, British Airways can provide them yearly
discounts by which revenue of company will enhance and their customers will also be satisfied.
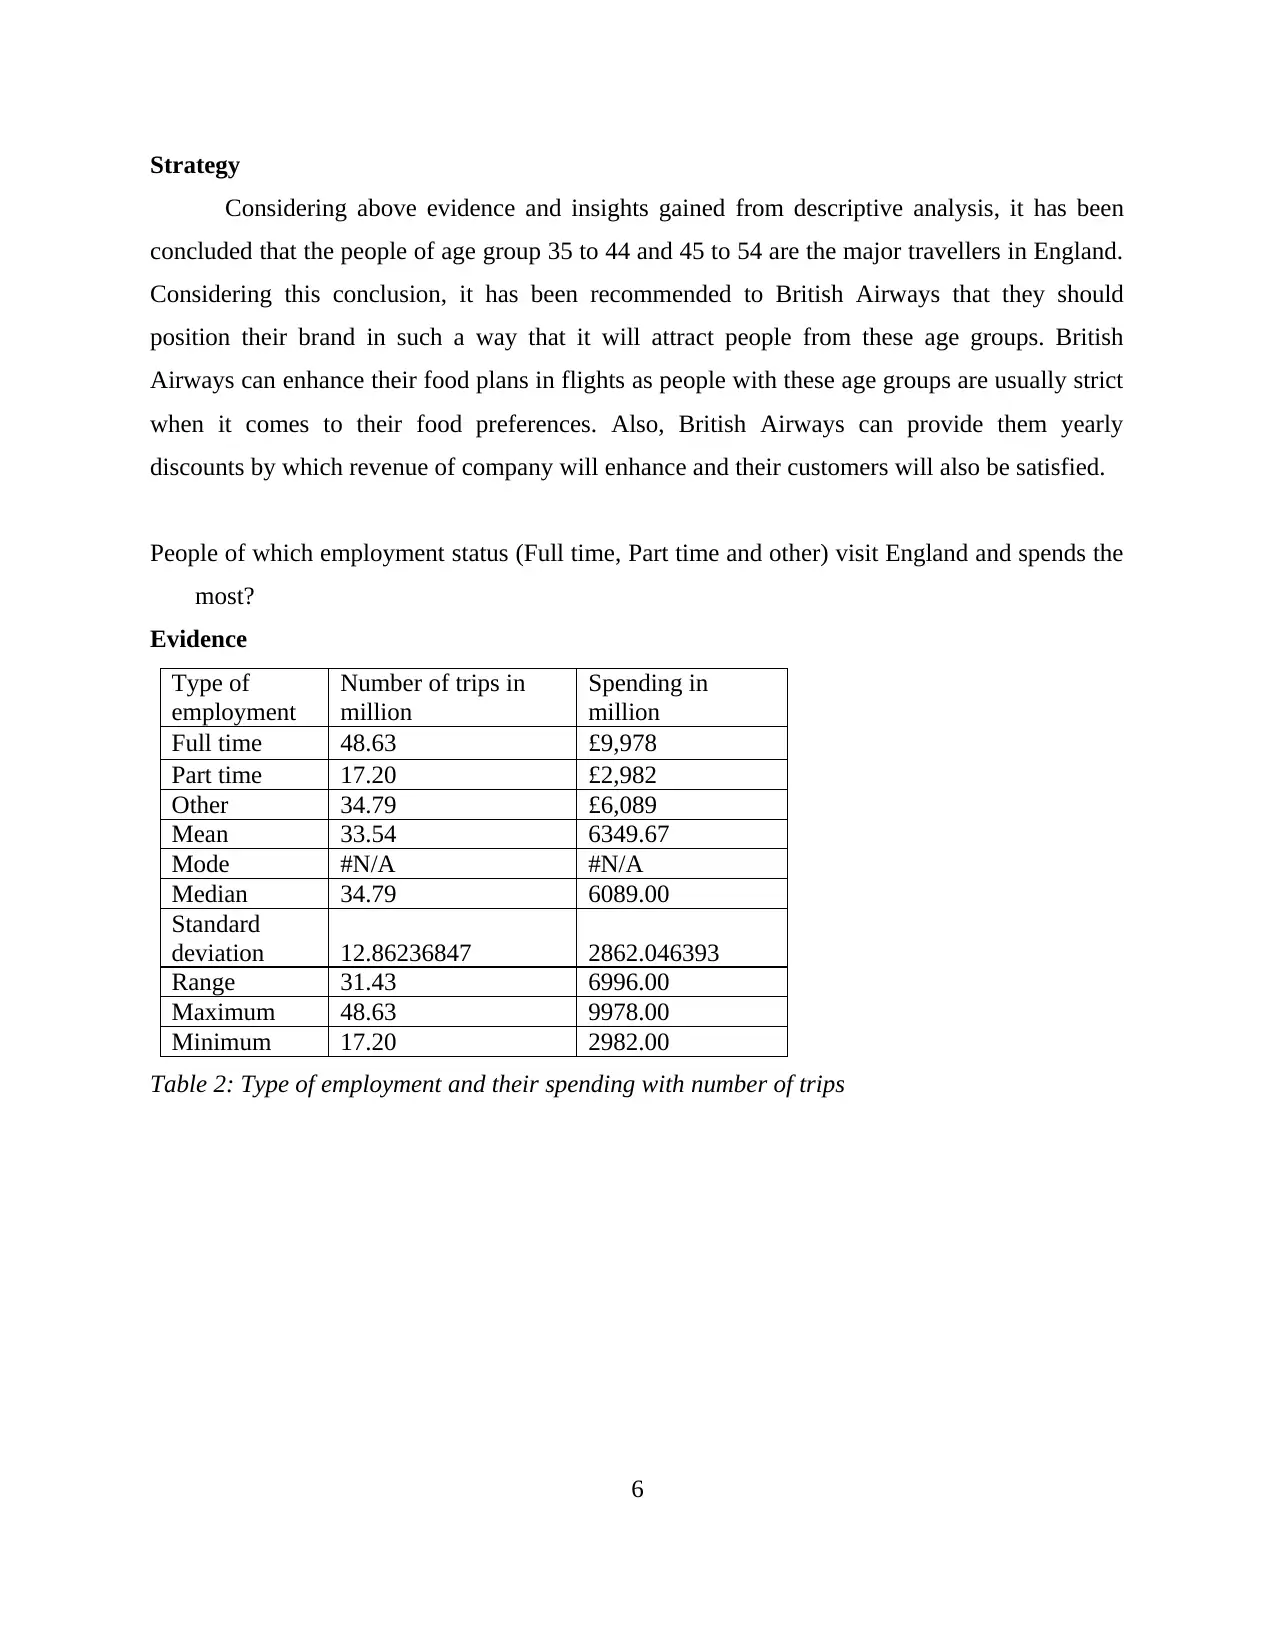
People of which employment status (Full time, Part time and other) visit England and spends the
most?
Evidence
Type of
employment
Number of trips in
million
Spending in
million
Full time 48.63 £9,978
Part time 17.20 £2,982
Other 34.79 £6,089
Mean 33.54 6349.67
Mode #N/A #N/A
Median 34.79 6089.00
Standard
deviation 12.86236847 2862.046393
Range 31.43 6996.00
Maximum 48.63 9978.00
Minimum 17.20 2982.00
Table 2: Type of employment and their spending with number of trips
6
Considering above evidence and insights gained from descriptive analysis, it has been
concluded that the people of age group 35 to 44 and 45 to 54 are the major travellers in England.
Considering this conclusion, it has been recommended to British Airways that they should
position their brand in such a way that it will attract people from these age groups. British
Airways can enhance their food plans in flights as people with these age groups are usually strict
when it comes to their food preferences. Also, British Airways can provide them yearly
discounts by which revenue of company will enhance and their customers will also be satisfied.
People of which employment status (Full time, Part time and other) visit England and spends the
most?
Evidence
Type of
employment
Number of trips in
million
Spending in
million
Full time 48.63 £9,978
Part time 17.20 £2,982
Other 34.79 £6,089
Mean 33.54 6349.67
Mode #N/A #N/A
Median 34.79 6089.00
Standard
deviation 12.86236847 2862.046393
Range 31.43 6996.00
Maximum 48.63 9978.00
Minimum 17.20 2982.00
Table 2: Type of employment and their spending with number of trips
6
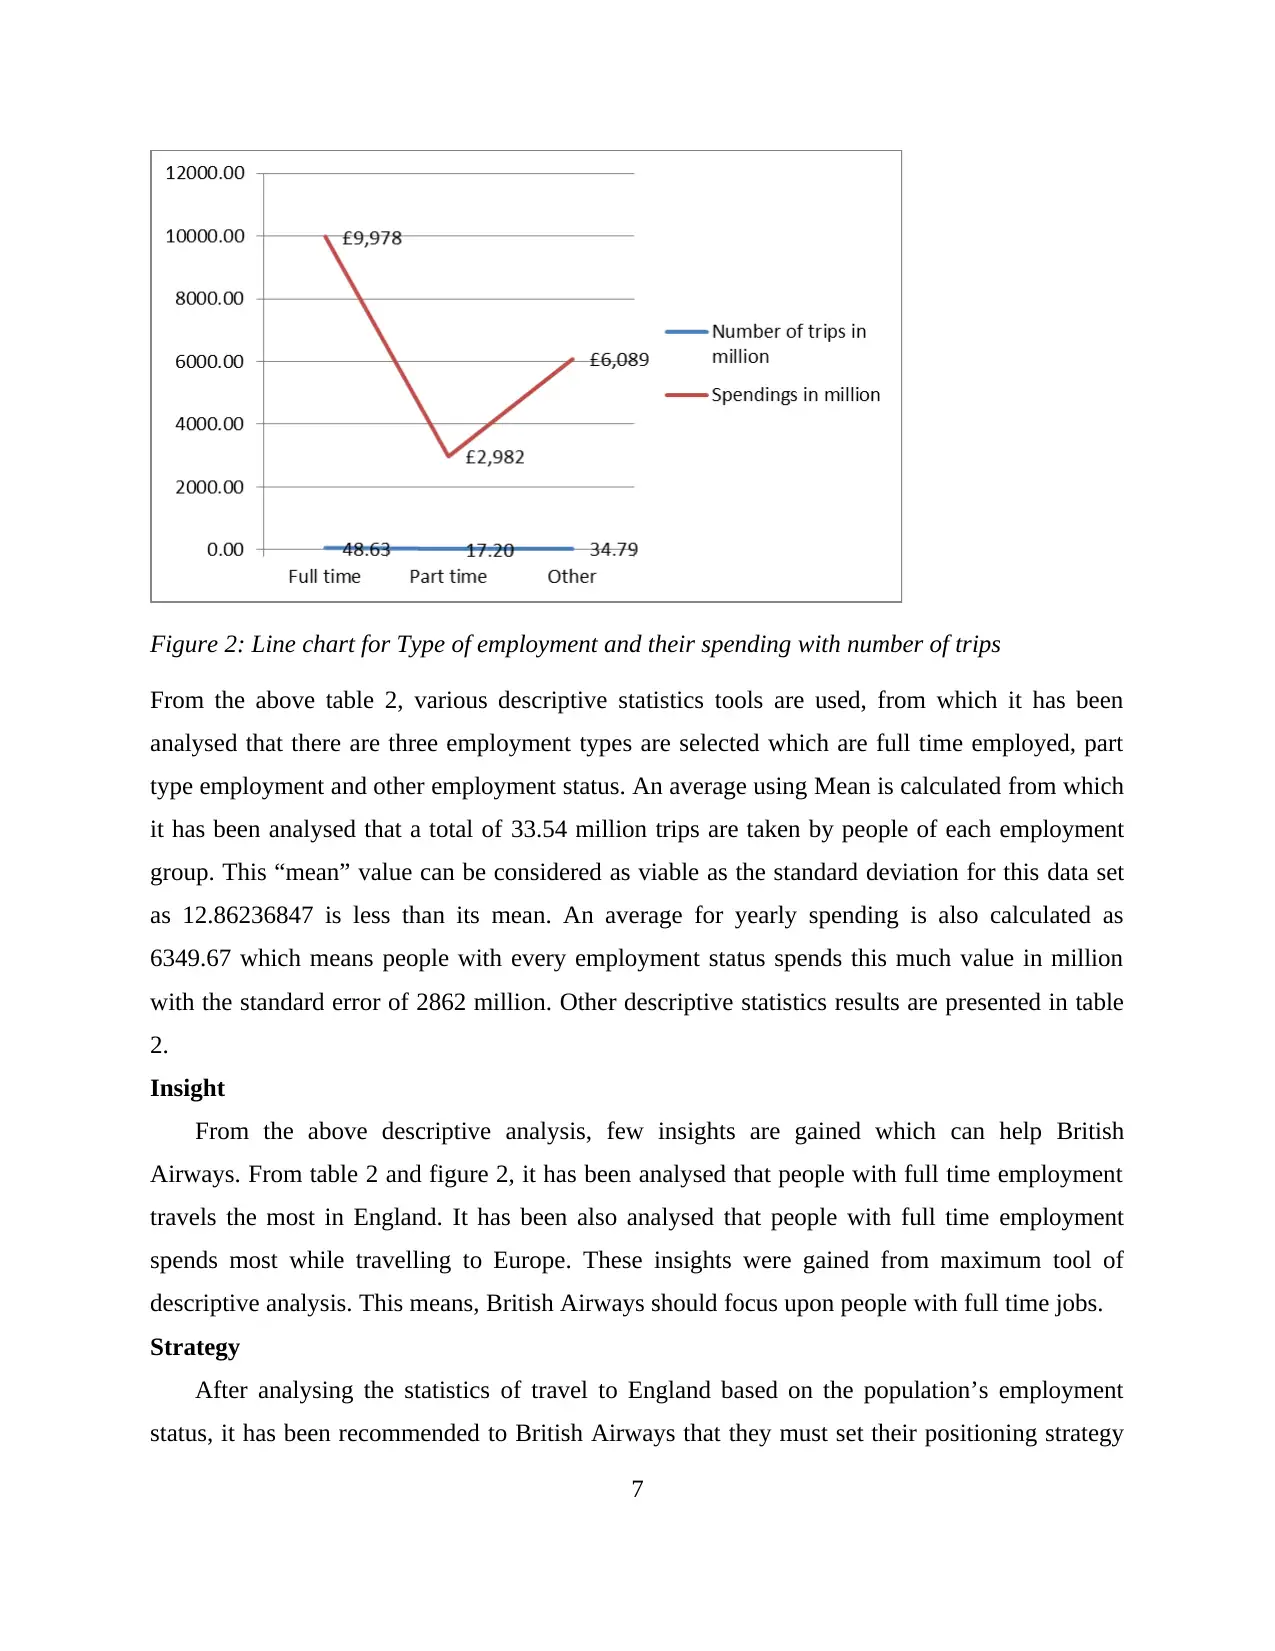
Figure 2: Line chart for Type of employment and their spending with number of trips
From the above table 2, various descriptive statistics tools are used, from which it has been
analysed that there are three employment types are selected which are full time employed, part
type employment and other employment status. An average using Mean is calculated from which
it has been analysed that a total of 33.54 million trips are taken by people of each employment
group. This “mean” value can be considered as viable as the standard deviation for this data set
as 12.86236847 is less than its mean. An average for yearly spending is also calculated as
6349.67 which means people with every employment status spends this much value in million
with the standard error of 2862 million. Other descriptive statistics results are presented in table
2.
Insight
From the above descriptive analysis, few insights are gained which can help British
Airways. From table 2 and figure 2, it has been analysed that people with full time employment
travels the most in England. It has been also analysed that people with full time employment
spends most while travelling to Europe. These insights were gained from maximum tool of
descriptive analysis. This means, British Airways should focus upon people with full time jobs.
Strategy
After analysing the statistics of travel to England based on the population’s employment
status, it has been recommended to British Airways that they must set their positioning strategy
7
⊘ This is a preview!⊘
Do you want full access?
Subscribe today to unlock all pages.
Trusted by 1+ million students worldwide
in such a way that it can attract people with full time employment. For this British Airways can
contract with multiple full time organisations that if they travel with British Airways then they
will gain annual subsidies. Also, this company should change their travel timings to England in
such a way that it does not conflict the working hours of passengers.
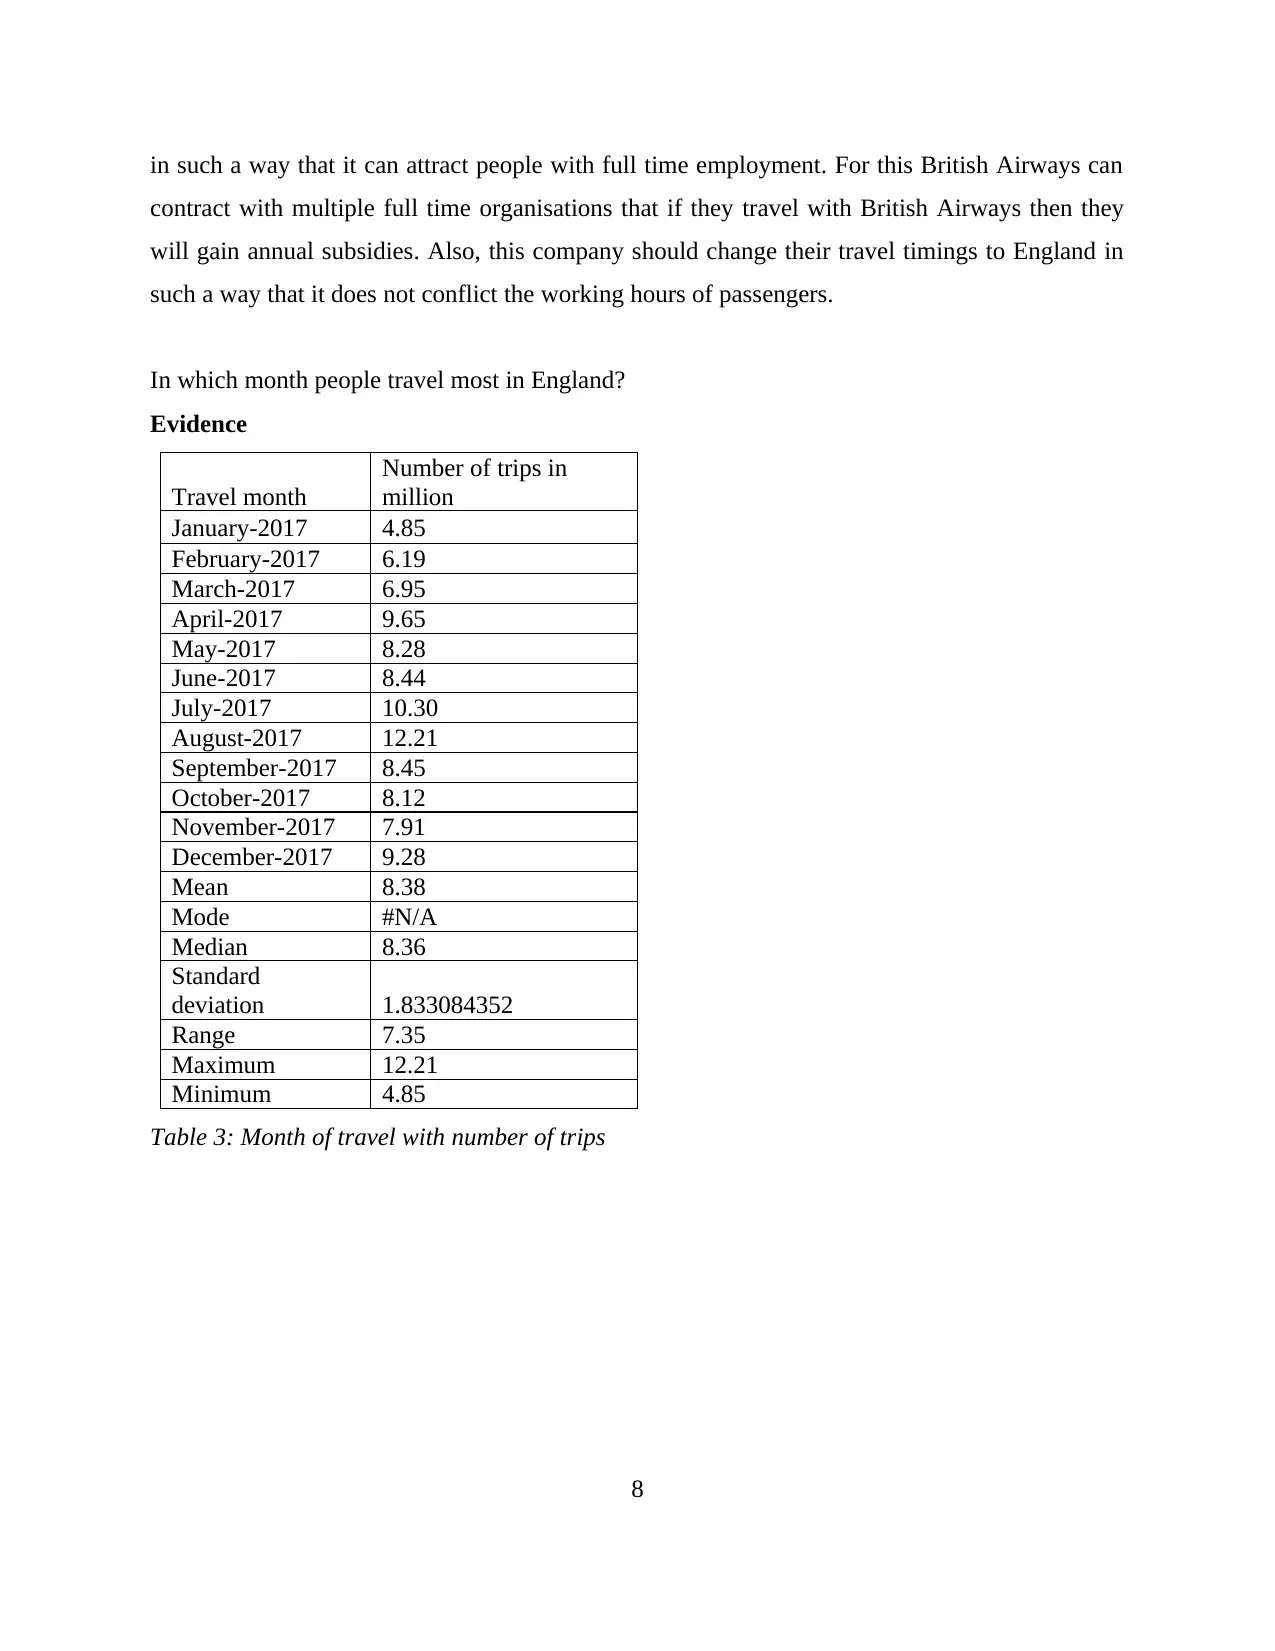
In which month people travel most in England?
Evidence
Travel month
Number of trips in
million
January-2017 4.85
February-2017 6.19
March-2017 6.95
April-2017 9.65
May-2017 8.28
June-2017 8.44
July-2017 10.30
August-2017 12.21
September-2017 8.45
October-2017 8.12
November-2017 7.91
December-2017 9.28
Mean 8.38
Mode #N/A
Median 8.36
Standard
deviation 1.833084352
Range 7.35
Maximum 12.21
Minimum 4.85
Table 3: Month of travel with number of trips
8
contract with multiple full time organisations that if they travel with British Airways then they
will gain annual subsidies. Also, this company should change their travel timings to England in
such a way that it does not conflict the working hours of passengers.
In which month people travel most in England?
Evidence
Travel month
Number of trips in
million
January-2017 4.85
February-2017 6.19
March-2017 6.95
April-2017 9.65
May-2017 8.28
June-2017 8.44
July-2017 10.30
August-2017 12.21
September-2017 8.45
October-2017 8.12
November-2017 7.91
December-2017 9.28
Mean 8.38
Mode #N/A
Median 8.36
Standard
deviation 1.833084352
Range 7.35
Maximum 12.21
Minimum 4.85
Table 3: Month of travel with number of trips
8
Paraphrase This Document
Need a fresh take? Get an instant paraphrase of this document with our AI Paraphraser
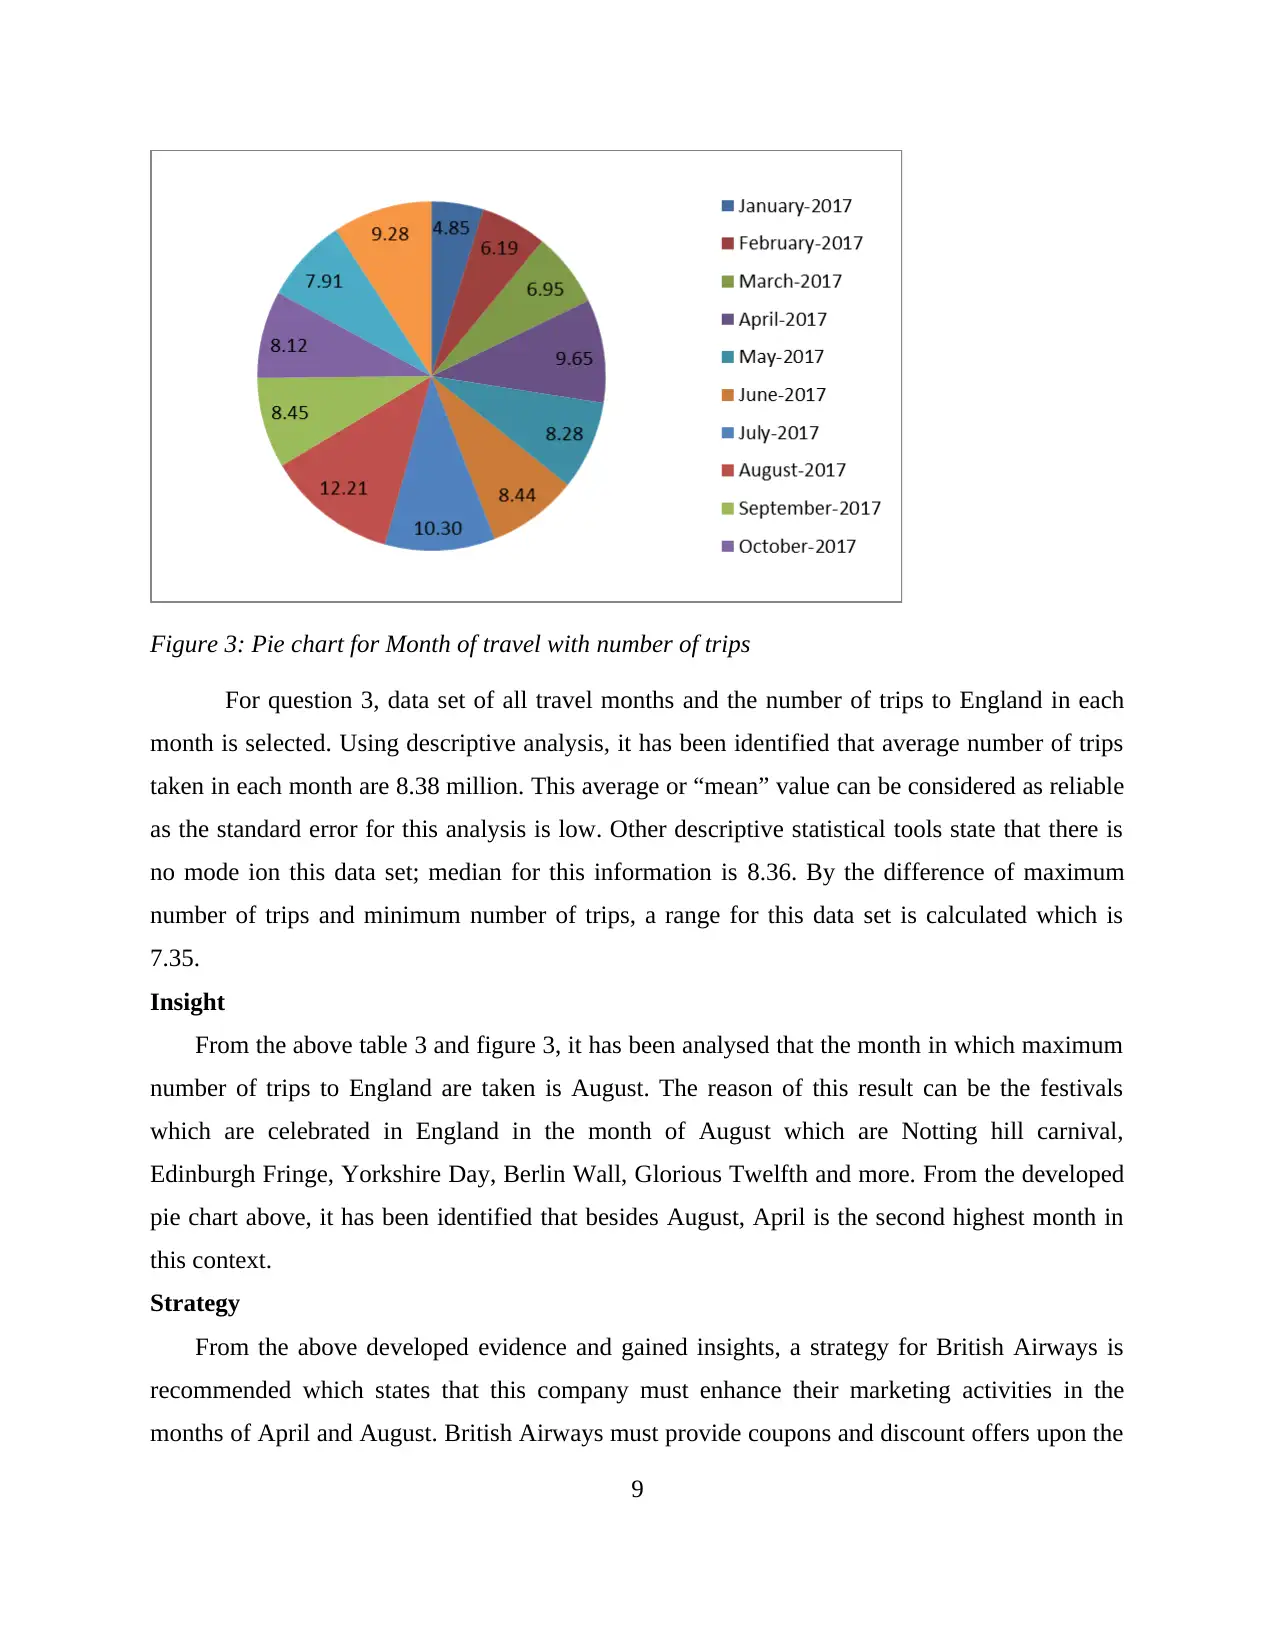
Figure 3: Pie chart for Month of travel with number of trips
For question 3, data set of all travel months and the number of trips to England in each
month is selected. Using descriptive analysis, it has been identified that average number of trips
taken in each month are 8.38 million. This average or “mean” value can be considered as reliable
as the standard error for this analysis is low. Other descriptive statistical tools state that there is
no mode ion this data set; median for this information is 8.36. By the difference of maximum
number of trips and minimum number of trips, a range for this data set is calculated which is
7.35.
Insight
From the above table 3 and figure 3, it has been analysed that the month in which maximum
number of trips to England are taken is August. The reason of this result can be the festivals
which are celebrated in England in the month of August which are Notting hill carnival,
Edinburgh Fringe, Yorkshire Day, Berlin Wall, Glorious Twelfth and more. From the developed
pie chart above, it has been identified that besides August, April is the second highest month in
this context.
Strategy
From the above developed evidence and gained insights, a strategy for British Airways is
recommended which states that this company must enhance their marketing activities in the
months of April and August. British Airways must provide coupons and discount offers upon the
9
flight prices in these months. It must be also considered by this company that this
recommendation is only for the flights of England.
From the above analysis, it has been seen that different positioning strategies are developed
using the results from three different questions. Combing all these strategies, a collective strategy
is also recommended to British Airways which state that this company must launch their
discount offers in the month of August for people who are full time working and are between the
age range of 45 to 54. This combined strategy is recommended to British Airways along with
various other strategies provided in this report. By considering all the strategies, British Airways
will be able to resolve their issue of low customer satisfaction and will be able to regain their
market position and competitive edge in airline industry.
10
⊘ This is a preview!⊘
Do you want full access?
Subscribe today to unlock all pages.
Trusted by 1+ million students worldwide
1 out of 12
Related Documents


Your All-in-One AI-Powered Toolkit for Academic Success.
+13062052269
info@desklib.com
Available 24*7 on WhatsApp / Email
![[object Object]](/_next/static/media/star-bottom.7253800d.svg)
Unlock your academic potential
Copyright © 2020–2026 A2Z Services. All Rights Reserved. Developed and managed by ZUCOL.