Financial Performance Analysis of British Airways Plc: A Report
VerifiedAdded on 2021/02/20
|15
|3641
|44
Report
AI Summary
This report provides a comprehensive financial analysis of British Airways Plc, examining various aspects of its financial performance. It begins by differentiating between qualitative and quantitative data, followed by explanations of horizontal and vertical analysis techniques. The report then delves into statistical and big data analysis, highlighting their importance in deriving meaningful insights. A significant portion of the report is dedicated to analyzing British Airways' fleet composition, including the types and manufacturers of aircraft, presented through tables and charts. Furthermore, the report assesses British Airways' financial performance using key ratios such as Return on Capital Employed (ROCE), Return on Equity (ROE), and the Current Ratio, providing interpretations of their significance. Finally, the report identifies and discusses several risk factors that could potentially impact British Airways' financial stability, including market fluctuations, foreign exchange and interest rate fluctuations, and fuel price risks.

Using Information
Paraphrase This Document
Need a fresh take? Get an instant paraphrase of this document with our AI Paraphraser

⊘ This is a preview!⊘
Do you want full access?
Subscribe today to unlock all pages.
Trusted by 1+ million students worldwide
INTRODUCTION
Data is termed as distinct pieces of information that are collected and arranged in
formatted manner to make it reliable and easy to understand. All the facts related to a particular
topic are mentioned in data and provided when required. Each activity that is performed by any
individual or organisation is derived through information that is acquired through data. While
conducting business operations large amount of data is collected relevant for decision making in
business. When stability of a business needs to be identifies then its financial statement are
termed as data that provides relevant information (Bland, 2014). In this project report financial
statement of British Airways Plc is considered to provide detailed information regarding data
using information. In this report different types of data and principals behind financial statement
is provided. Together with this usage of data analysis in decision making and calculation
deviations in standard and current situations. A method to improve data quality of British
Airways Plc will be provided in this report.
TASK 1
a) Qualitative and Quantitative data
Data is a form of information that has been translated into form that is efficient for
processing and decision making. Statistics is used to define data that are collected in different
forms to grab the required information. In broad manner data is segregated into two forms one is
quantitative and other one is qualitative.
Qualitative data: It is concerned with description that can be noticed but can not be
computed in numerical form. It is a non-statistical and ambiguous form of data. It is categorised
on the basis of properties, attributes, labels and other identifiers. Qualitative data is descriptive
and conceptual in nature that is collected through observations and interviews. Qualitative
information like consumer satisfaction, employees motivation is the qualitative data for British
Airways Plc that helps in success of business (Delen, Kuzey and Uyar, 2013).
Quantitative data: It is counted, expressed and measured using numbers. This form of
data helps in discovering facts and represented in form of a numerical value. British Airways Plc
financial statements represents performance data and all the information is provided in
quantitative form. Decisions based on quantitative information is easy as variation needs to be
judged on the basis of numbers.
Paraphrase This Document
Need a fresh take? Get an instant paraphrase of this document with our AI Paraphraser
b) Horizontal and vertical analysis
Horizontal analysis: It is termed as tendency that is used in the procedure of
examination financial statements across number of years. This form of analysis is used by
business organisations for examine improvement in the financial position over the years. Same
business is compared over the years to note progress (Halkos and Tzeremes, 2012). Horizontal
analysis helps in calculating variance in the desired performance and necessary steps to
minimise variation in financial performance is taken. British Airways Plc uses this form of data
analysis to record changes in the financial performance of business from its base year. This form
of analysis helps in setting targets for future goals and provides basis for measuring its
achievements.
Vertical analysis: It is also termed as common size analysis of financial information and
this perform a function of listing each item of the financial statement in terms of percentage.
Through this each individual item is compared with total account and contribution of single item
is calculated. Through vertical analysis British Airways Plc can make comparison of its income
statements and balance sheet through different size company. This will provide a useful
information when companies of different sizes are compared on the basis of financial
information.
c) Statistical and big data
Statistics is the science of assembling, analysing and knowing information and
explanation for applicable for some uncertain events (Herrera, Hanihara and Godde, 2014). The
data in statistical form are separated into two forms. One is constant data and other is discreet
data. The continuous data is the one which can not be counted and the discreet data is the one
that can be counted. For analysing both the forms of data continuous and discreet function is
used so that relevant information from the available data can be measured for decision making.
When the acquired data information is very complex and data collected is huge in terms
of volume and variety then for simplification of that data Big Data analysis is performed. Big
data are particularly difficult because collection of these data are not made for providing answer
to one specific question. All forms are statistics are applied to big data to ensure accurate and
meaningful information for the data acquired. British Airways Plc use statistical and big data
analysis in verifying large data to uncover information through hidden pattern and some
unknown correlations, market trends and consumers preference. All these informations acquired
through big data analysis in statistical manner will help organisation to make informed business
decisions. Chances of success for British Airways Plc will enhance through satisfying large
number of consumers in the most recent market trend (Himmelmann, 2012).
TASK 2
a) Type of Aircraft with largest in number
British airways has aircraft's as their assets that is owned by them and some of them are
operated on lease. For calculating the aircraft type that is highest in number both type will be
considered. By evaluating Fleet table it is seen that Airbus A320 is the largest number of aircraft
in British Airways consisting of 67 Fleet of the same in December 2017.
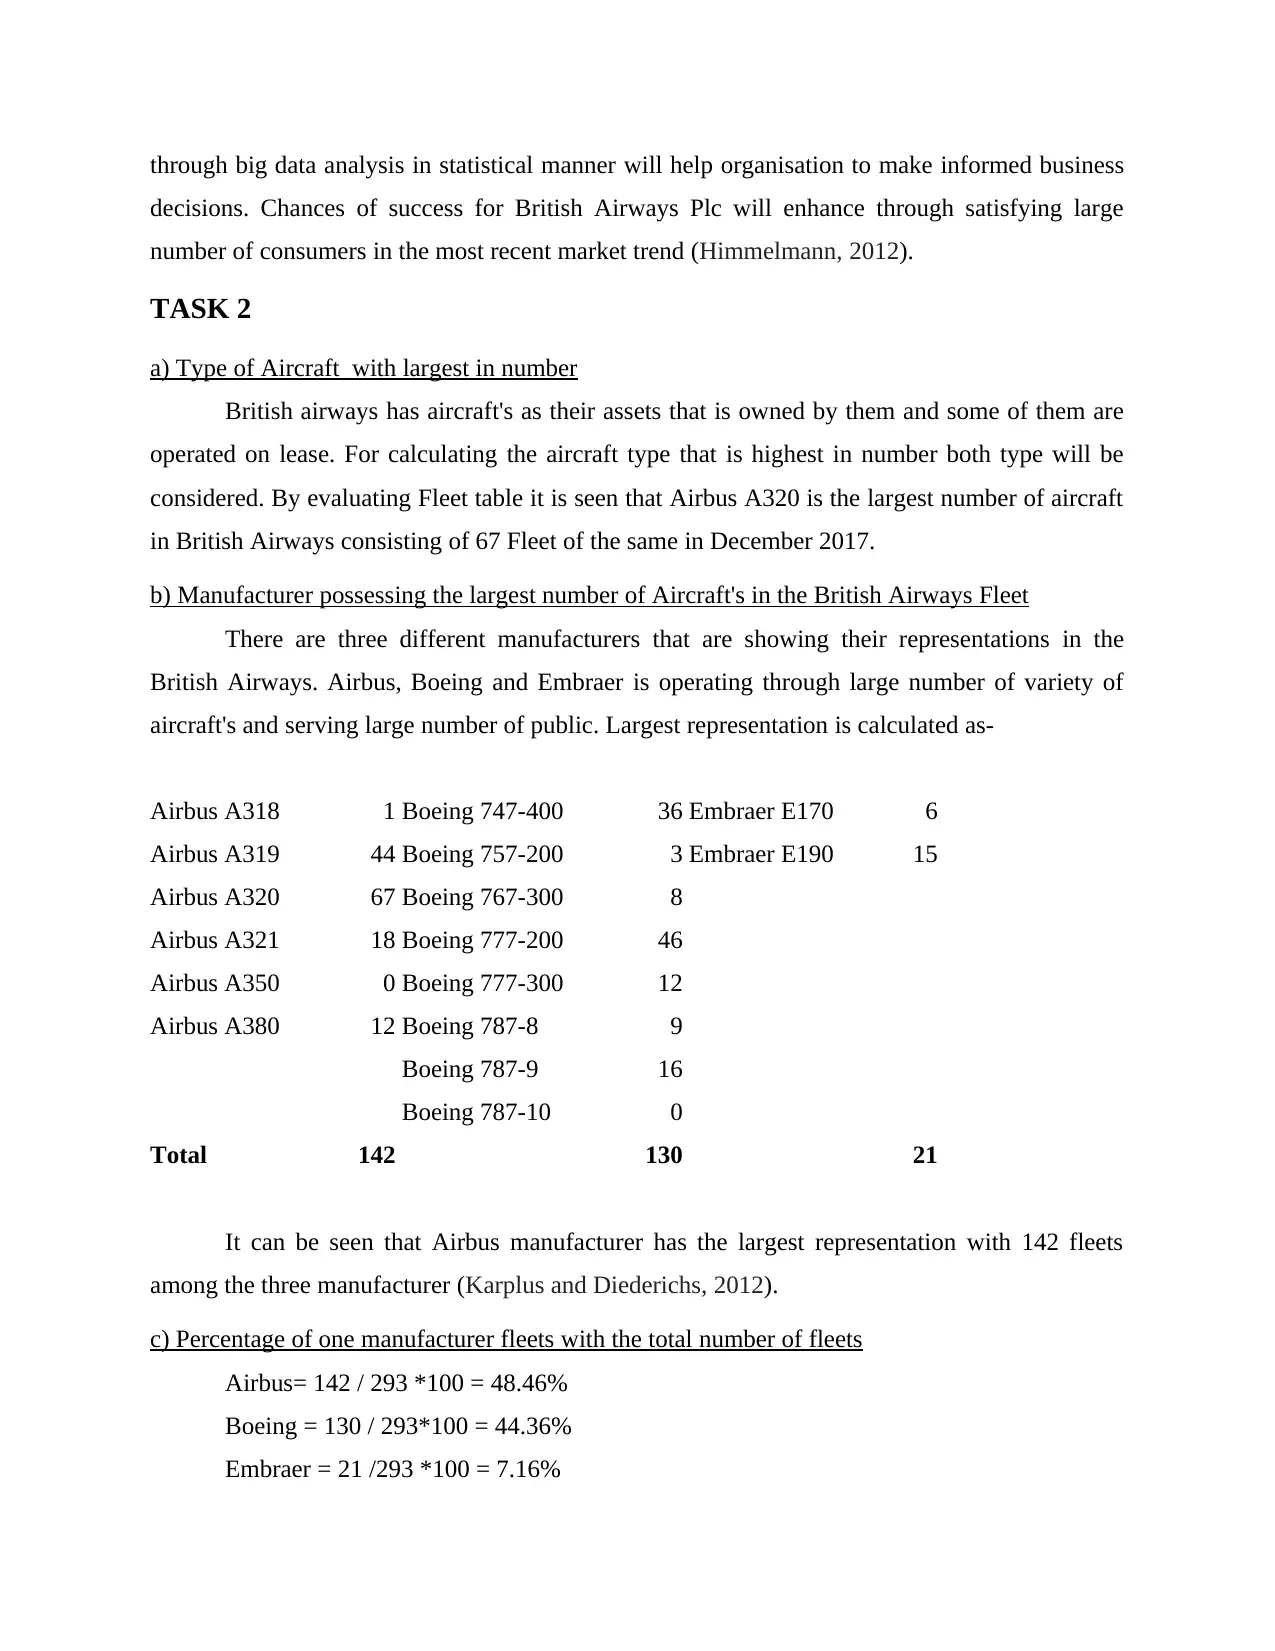
b) Manufacturer possessing the largest number of Aircraft's in the British Airways Fleet
There are three different manufacturers that are showing their representations in the
British Airways. Airbus, Boeing and Embraer is operating through large number of variety of
aircraft's and serving large number of public. Largest representation is calculated as-
Airbus A318 1 Boeing 747-400 36 Embraer E170 6
Airbus A319 44 Boeing 757-200 3 Embraer E190 15
Airbus A320 67 Boeing 767-300 8
Airbus A321 18 Boeing 777-200 46
Airbus A350 0 Boeing 777-300 12
Airbus A380 12 Boeing 787-8 9
Boeing 787-9 16
Boeing 787-10 0
Total 142 130 21
It can be seen that Airbus manufacturer has the largest representation with 142 fleets
among the three manufacturer (Karplus and Diederichs, 2012).
c) Percentage of one manufacturer fleets with the total number of fleets
Airbus= 142 / 293 *100 = 48.46%
Boeing = 130 / 293*100 = 44.36%
Embraer = 21 /293 *100 = 7.16%
decisions. Chances of success for British Airways Plc will enhance through satisfying large
number of consumers in the most recent market trend (Himmelmann, 2012).
TASK 2
a) Type of Aircraft with largest in number
British airways has aircraft's as their assets that is owned by them and some of them are
operated on lease. For calculating the aircraft type that is highest in number both type will be
considered. By evaluating Fleet table it is seen that Airbus A320 is the largest number of aircraft
in British Airways consisting of 67 Fleet of the same in December 2017.
b) Manufacturer possessing the largest number of Aircraft's in the British Airways Fleet
There are three different manufacturers that are showing their representations in the
British Airways. Airbus, Boeing and Embraer is operating through large number of variety of
aircraft's and serving large number of public. Largest representation is calculated as-
Airbus A318 1 Boeing 747-400 36 Embraer E170 6
Airbus A319 44 Boeing 757-200 3 Embraer E190 15
Airbus A320 67 Boeing 767-300 8
Airbus A321 18 Boeing 777-200 46
Airbus A350 0 Boeing 777-300 12
Airbus A380 12 Boeing 787-8 9
Boeing 787-9 16
Boeing 787-10 0
Total 142 130 21
It can be seen that Airbus manufacturer has the largest representation with 142 fleets
among the three manufacturer (Karplus and Diederichs, 2012).
c) Percentage of one manufacturer fleets with the total number of fleets
Airbus= 142 / 293 *100 = 48.46%
Boeing = 130 / 293*100 = 44.36%
Embraer = 21 /293 *100 = 7.16%
⊘ This is a preview!⊘
Do you want full access?
Subscribe today to unlock all pages.
Trusted by 1+ million students worldwide
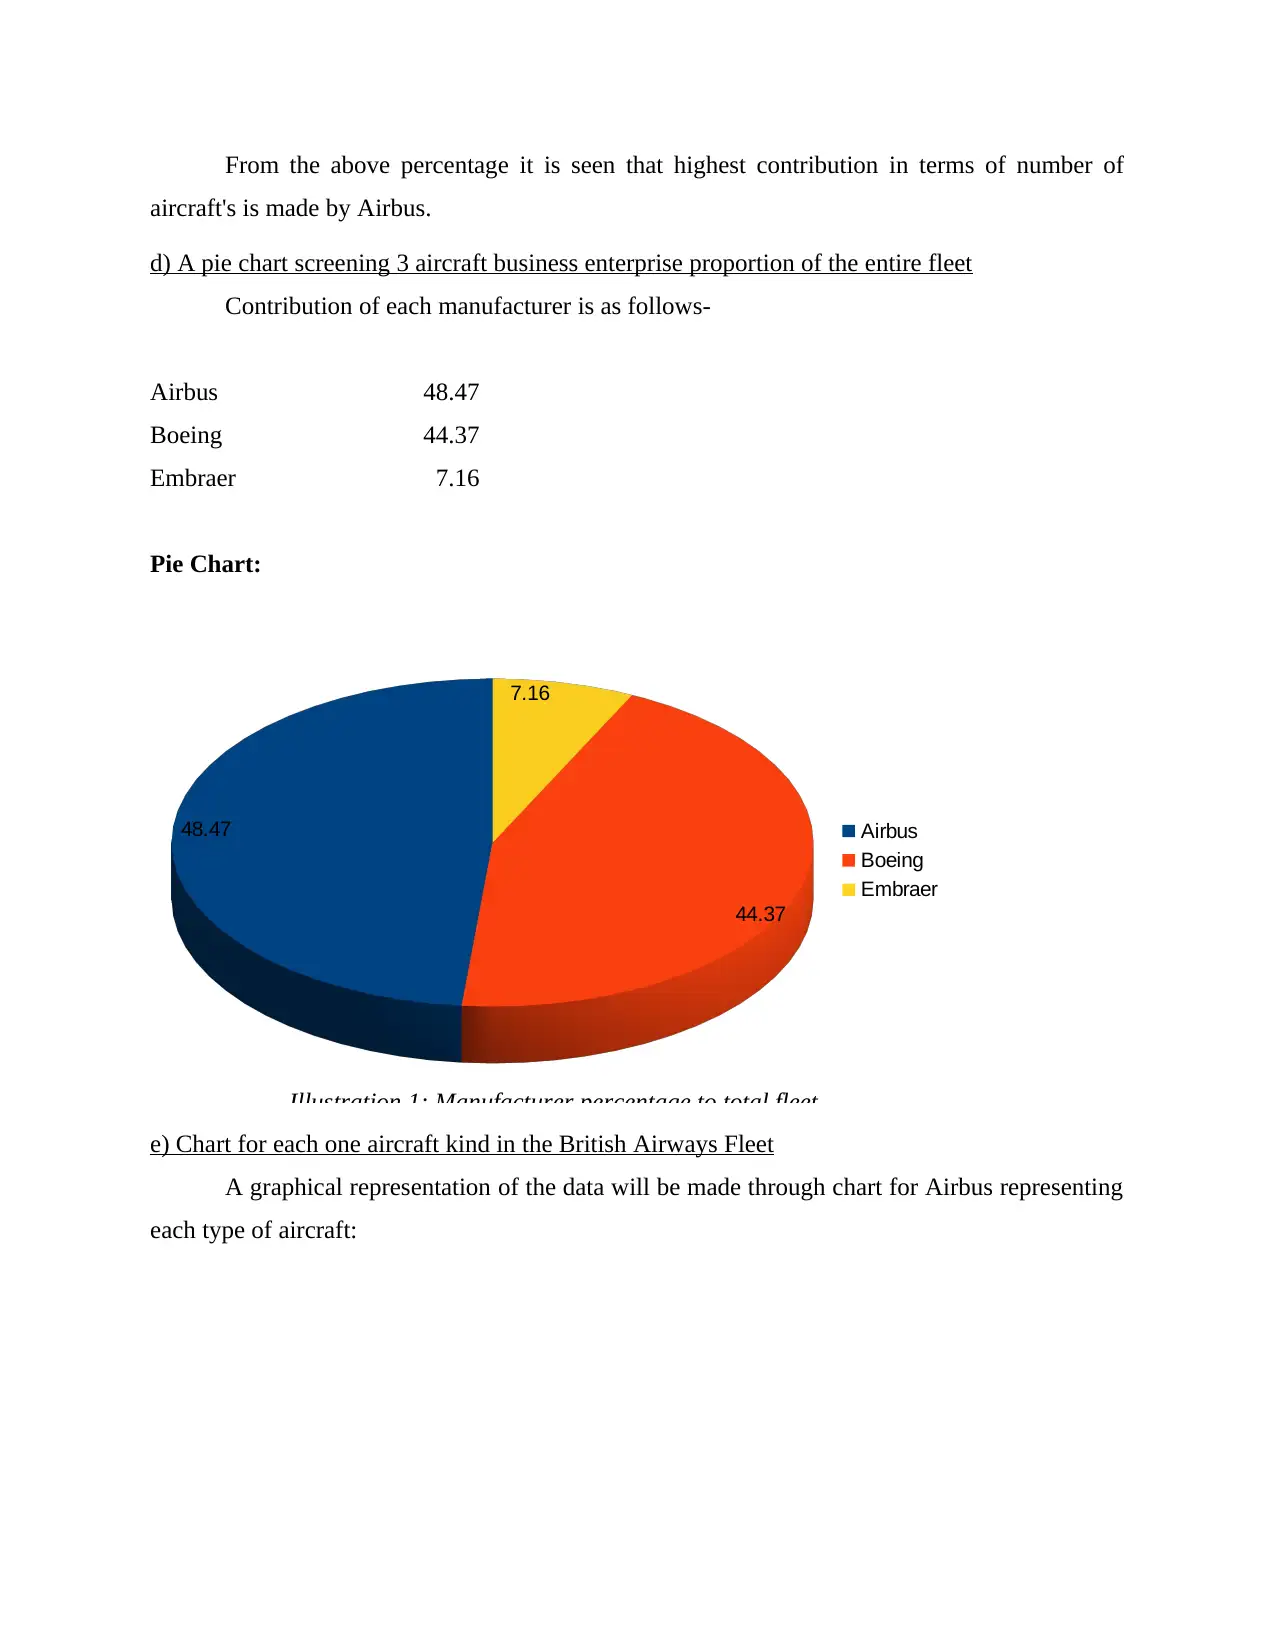
From the above percentage it is seen that highest contribution in terms of number of
aircraft's is made by Airbus.
d) A pie chart screening 3 aircraft business enterprise proportion of the entire fleet
Contribution of each manufacturer is as follows-
Airbus 48.47
Boeing 44.37
Embraer 7.16
Pie Chart:
48.47
44.37
7.16
Airbus
Boeing
Embraer
Illustration 1: Manufacturer percentage to total fleet
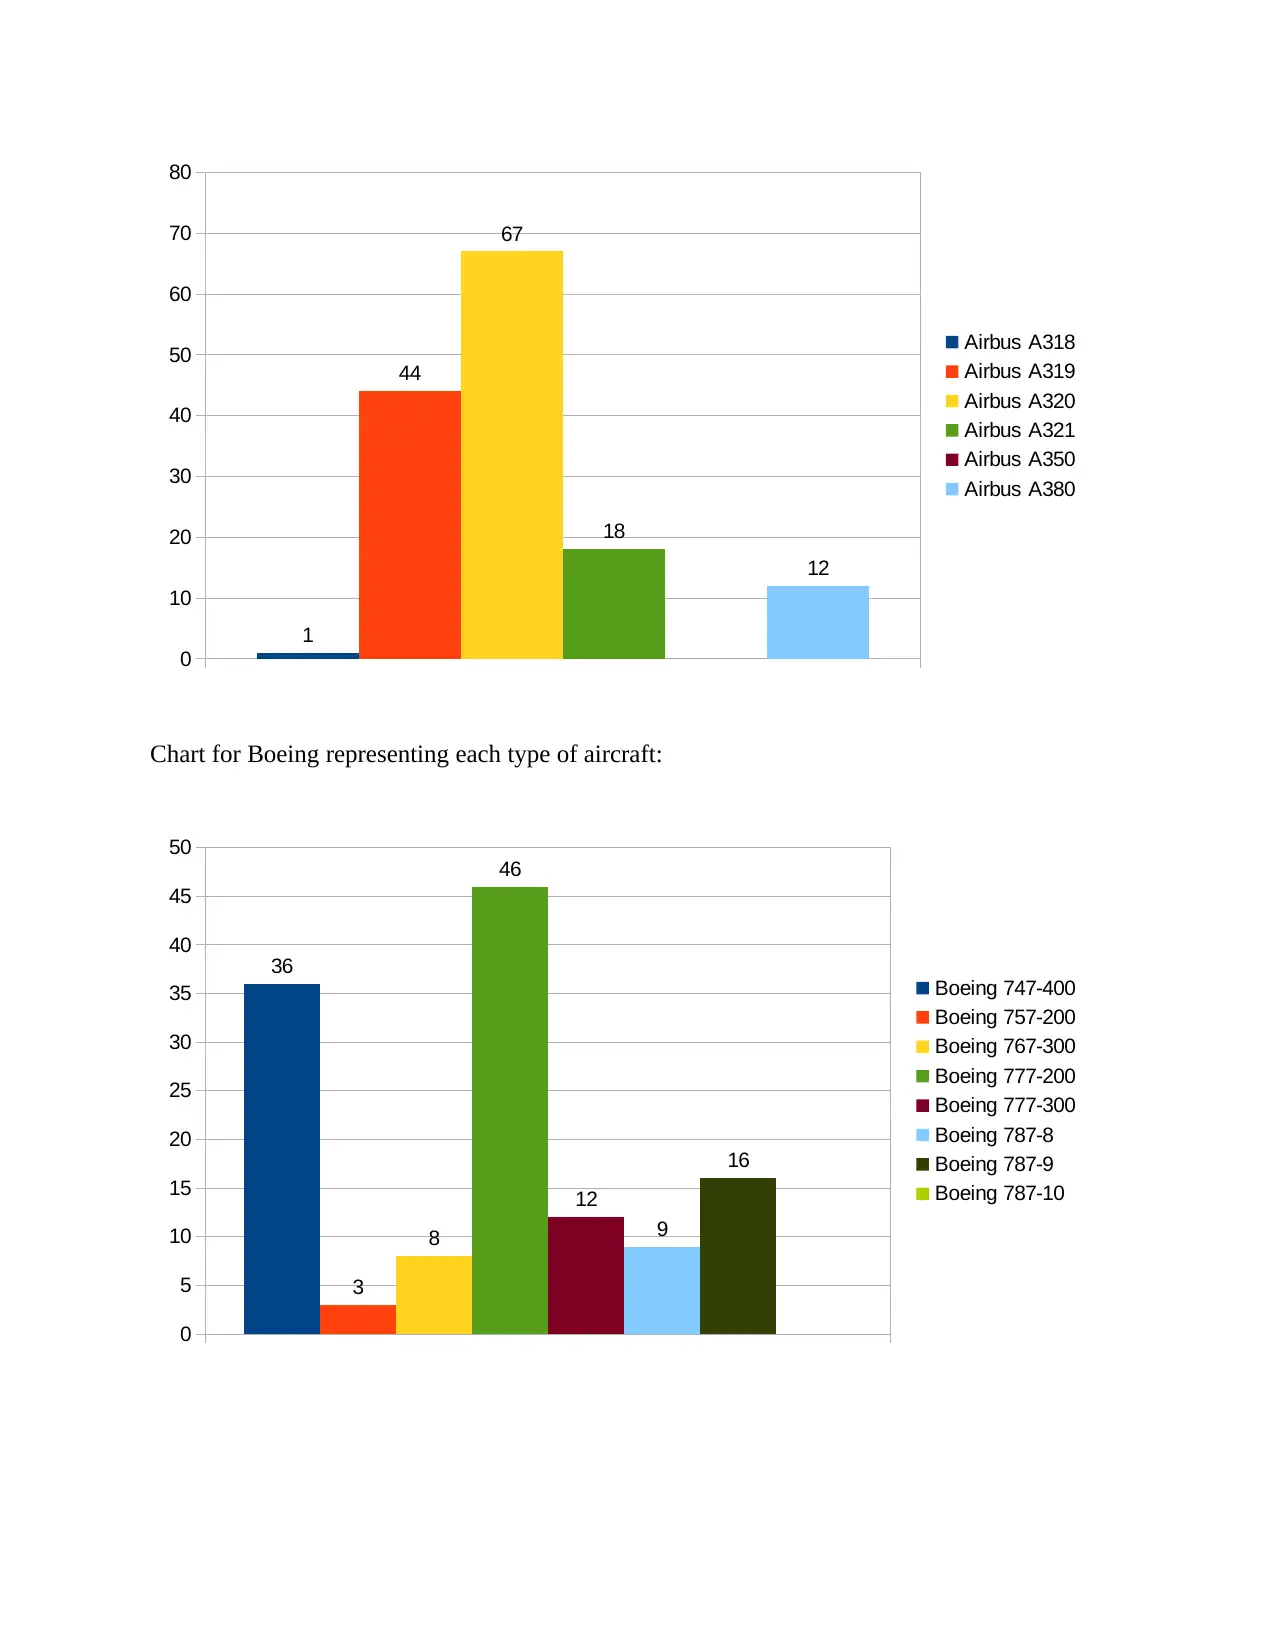
e) Chart for each one aircraft kind in the British Airways Fleet
A graphical representation of the data will be made through chart for Airbus representing
each type of aircraft:
aircraft's is made by Airbus.
d) A pie chart screening 3 aircraft business enterprise proportion of the entire fleet
Contribution of each manufacturer is as follows-
Airbus 48.47
Boeing 44.37
Embraer 7.16
Pie Chart:
48.47
44.37
7.16
Airbus
Boeing
Embraer
Illustration 1: Manufacturer percentage to total fleet
e) Chart for each one aircraft kind in the British Airways Fleet
A graphical representation of the data will be made through chart for Airbus representing
each type of aircraft:
Paraphrase This Document
Need a fresh take? Get an instant paraphrase of this document with our AI Paraphraser
0
10
20
30
40
50
60
70
80
1
44
67
18
12
Airbus A318
Airbus A319
Airbus A320
Airbus A321
Airbus A350
Airbus A380
Chart for Boeing representing each type of aircraft:
0
5
10
15
20
25
30
35
40
45
50
36
3
8
46
12
9
16
Boeing 747-400
Boeing 757-200
Boeing 767-300
Boeing 777-200
Boeing 777-300
Boeing 787-8
Boeing 787-9
Boeing 787-10
10
20
30
40
50
60
70
80
1
44
67
18
12
Airbus A318
Airbus A319
Airbus A320
Airbus A321
Airbus A350
Airbus A380
Chart for Boeing representing each type of aircraft:
0
5
10
15
20
25
30
35
40
45
50
36
3
8
46
12
9
16
Boeing 747-400
Boeing 757-200
Boeing 767-300
Boeing 777-200
Boeing 777-300
Boeing 787-8
Boeing 787-9
Boeing 787-10
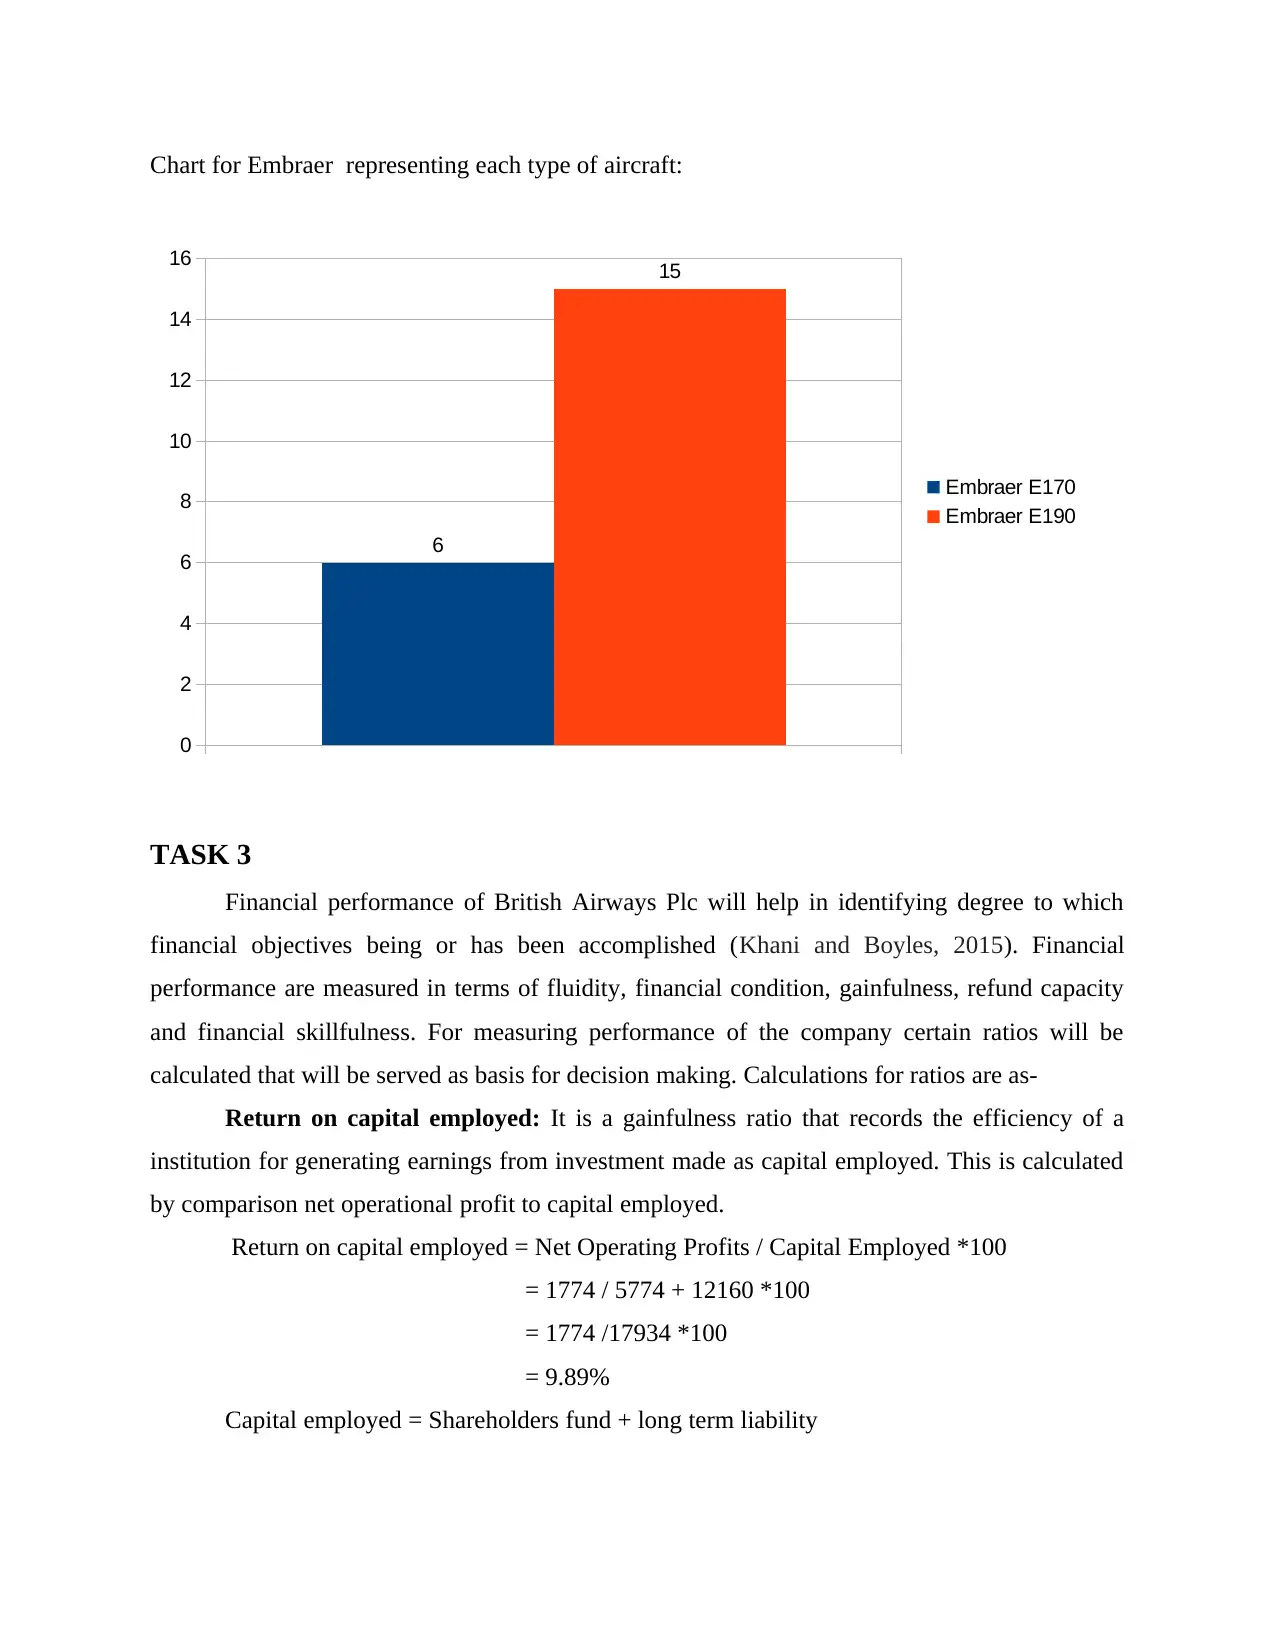
Chart for Embraer representing each type of aircraft:
0
2
4
6
8
10
12
14
16
6
15
Embraer E170
Embraer E190
TASK 3
Financial performance of British Airways Plc will help in identifying degree to which
financial objectives being or has been accomplished (Khani and Boyles, 2015). Financial
performance are measured in terms of fluidity, financial condition, gainfulness, refund capacity
and financial skillfulness. For measuring performance of the company certain ratios will be
calculated that will be served as basis for decision making. Calculations for ratios are as-
Return on capital employed: It is a gainfulness ratio that records the efficiency of a
institution for generating earnings from investment made as capital employed. This is calculated
by comparison net operational profit to capital employed.
Return on capital employed = Net Operating Profits / Capital Employed *100
= 1774 / 5774 + 12160 *100
= 1774 /17934 *100
= 9.89%
Capital employed = Shareholders fund + long term liability
⊘ This is a preview!⊘
Do you want full access?
Subscribe today to unlock all pages.
Trusted by 1+ million students worldwide
Interpretation: ROCE for group of British Airways Plc is 9.89% which reflects that
company is earning good amount of profits from its capital employed.
Return on Equity: It is a profitability ratio that helps to calculate amount of net income
earned through employing equity funds. Through ROE it is noted that how well a business is
investing to generate earnings and growth. Higher ROE reflects good investment decision and
more earnings through employing owners fund. This can be calculated as-
Return on Equity = Net Income / Shareholders Equity *100
= 1403 / 5774 *100
= 24.29%
Interpretation: From the results of ROE of British Airways Plc group it can be
interpreted that business is earning good return by employing shareholders fund. Higher ROE
reflects that business will be capable of generating cash internally. 24.29% ROE is quite good
when it is compared with other companies in the industry (Sohn and Kim, 2013).
Current ratio: This is a liquidity ratio that measures short term capability of business to
settle its obligations due within one year. Current ratio reflects how how current liabilities in
business are settled with its liquidate assets. It is an important ratio for investors to make
investing decision in business as financial viability of business in short run is identified with this
ratio. This is calculated by availability of current assets in terms of current liability that reflects
how efficiently current liabilities can be paid using current assets. Current ratio of British
Airways Plc is -
Current Ratio = Current assets / Current Liabilities
= 4518 / 5468
= 0.82
Interpretation: Current ratio of British Airways Plc reflects that short term financial
viability of business as group is not strong. This can be seen as availability of assets to meet
short term liability is less in comparison to current liability. Availability of assets is only 0.82 in
comparison to liability of 1.00. short term financial viability of British Airways Plc is not sound
and will become less attractive investment option for investors.
TASK 4
British Airways Plc is operated in United Kingdom and is established their from last
many years. This airline possess huge market share for serving transport facility in Europe and
Paraphrase This Document
Need a fresh take? Get an instant paraphrase of this document with our AI Paraphraser
helps in providing connectivity throughout the world. A high amount of competition is evolving
over the years for airline companies. Their are certain risk element that can affect British
Airways group's industry place and profits. These factors are as follows-
Market Fluctuations: Market fluctuations which are caused by economic cycle in each
region and shift demand for each customer affects business of a group. Although a group
measures and monitors changes in the market conditions but avoiding impacts completely is
difficult. These fluctuations may change the demand for product and services at world level.
Market when turned down demand decreases and increase in production takes place and sales are
made through lowering the price. Sales will be reduced for group and these fluctuations will
leads to effect revenue of British Airways group (Business risk factors, 2019).
Fluctuations in foreign exchange and interest rates: From the financial statements of
British Airways Plc it is seen that a huge amount of capital expenditure commitment is made by
the group. This expenditure is related to period from 2018 to 2022 in which different types of
capital assets will be acquired. All the expenditures are made in US dollar. As the amount of
expenditure made by the British Airways group is in foreign currency. This will increase the risk
of fluctuations in foreign exchange. As the expenditure commitments are made in the current
date for future and risk of fluctuation in foreign exchange will be high for the business. A
negative impact of for-ex may hamper market position of business. Their are various loans that
are reflected in balance sheet of British Airways. These loans are taken on floating interest rate
and fluctuation may effect revenue of the group. This will be termed as a risk that may effect
revenue of business if fluctuated unfavourably.
Fuel price risk: Fuel is one of the major resource required by British Airways to provide
services to large number of consumers. Fluctuation in fuel price is quite high and this may
impact revenue of the business. This risk is hedged by British Airways by hedging a part of fuel
intake for next twelve quarters (Tsatsaronis and Yang, 2012).
Liquidity risk: When evaluating liquidity place of the British Airways it is recorded that
group is not operating at good financial condition. Availability of financial resources for
payment of liability is not appropriate. To hedge and maintain financial liquidity of the business
various clause are entered in the agreements made for conducting business operations. Existence
of liquidity risk in business may effect its market revenue and market position.
Counterparty risk: This is the probability or chance that is possessed by one of the party
participating in a dealing for failure on written agreement duty or responsibility. This form of
risk exists in the transactions related to credit, investment and trading transactions. This risk is
minimised by British Airways group through imposing policies and procedures of implementing
certain credit limits on each counterparty. The group monitors credit limit of counterparties and
helps in unified content into credit risk control. Financial assets are recorded in the business
statements net of modification loss to maximise unit influence for related endangerment.
TASK 5
Generating more and more revenue is the ultimate goal of each organisation. As revenue
is considered as the proof for the success of business operations. British Airways as per common
method set its objects for enhancing amount of revenue generation year by year. For the chart
that is provided it can be seen that graph is cont moving constant and fluctuating up and down.
This means that profits of the business in the last five years are not increasing they are
decreasing in some years. Decrease in the amount of revenue is not termed as viable condition
for financial position of the company (Weiskopf and Weng, 2013). As all the businesses sets
goals to achieve higher amount of revenue in the next year and fall in the revenue will hamper
goodwill of British Airways and trust of investors will also gets diluted. The mean of revenue for
the last five years from 2013 to 2017 is calculated as-
Mean = Total of revenue for 5 years / No. of years
= 58097 / 5
= 11619.4
Standard Deviation: It is the number that represents the measurement of variation that
data possess from the average mean or expected value of the series. When number of standard
deviation is low then it reflects that most of the numbers are close to the average. The standard
deviation of revenue of British Airways for the last five years is 370.23.
From mean and standard deviation of revenue it can be seen that revenue of the 2013 to
2016 is varying with average revenue but in the limit of standard deviation. Revenue in the year
has increased suddenly and the variation is more then the standard deviation. The variation
which is under the limit of standard deviation is because of the fluctuations in economic
conditions and change in business policies and taxes. When variation is under control then it can
be cope up as this will not effect business at grater level.
⊘ This is a preview!⊘
Do you want full access?
Subscribe today to unlock all pages.
Trusted by 1+ million students worldwide
1 out of 15
Related Documents


Your All-in-One AI-Powered Toolkit for Academic Success.
+13062052269
info@desklib.com
Available 24*7 on WhatsApp / Email
![[object Object]](/_next/static/media/star-bottom.7253800d.svg)
Unlock your academic potential
Copyright © 2020–2026 A2Z Services. All Rights Reserved. Developed and managed by ZUCOL.