Financial Reporting: British Airways and KLM During Financial Crisis
VerifiedAdded on 2023/04/20
|43
|8493
|72
Report
AI Summary
This report evaluates the financial performance and risk position of British Airways and KLM Royal Dutch Airlines during a period marked by financial crises. It employs financial ratio analysis over five years, comparing the companies' performance against industry averages. The analysis covers profitability ratios (Return on Assets, Return on Equity, Return on Capital Employed, Gross Profit Margin, Net Profit Margin), liquidity ratios (Current Ratio, Quick Ratio), industry-specific ratios (Available Seat Kilometers, Revenue Passenger Kilometers, Passenger Load Factor), asset efficiency ratios (Average Inventories Turnover Period, Average Settlement Period for Receivables/Payables), gearing ratios (Debt to Capital Ratio, Interest Cover Ratio), and investment ratios (Earnings per Share, Price/Earnings Ratio, Dividend Payout Ratio, Dividend Cover Ratio). Additionally, cash flow analysis is performed, examining operating cash flow relative to sales and investments. The report aims to provide insights into the strategies used by British Airways and KLM to sustain profitability during challenging economic times.
1
Financial reporting assignment
Financial reporting assignment
Paraphrase This Document
Need a fresh take? Get an instant paraphrase of this document with our AI Paraphraser
2
Executive Summary
The period of financial crises has impacted most of the businesses worldwide and
cause the need for developing the business strategies that help them to sustain the robust
profitability during the period of crises. The civil aviation market is most important as it is
the prime movers in the economic growth and the strategic element for employment
generation. Aim of this report is to evaluate the case of British Airways and KLM Royal
Dutch Airlines in order to report on the financial performance and risk position of these
companies. Financial analysis through use of ratio analysis has been carried out for both the
companies for last two years and it has also been compared with industry average.
3
Contents
Executive Summary...................................................................................................................2
Part 1: Introduction....................................................................................................................4
Case of British Airways..........................................................................................................4
Case of KLM Royal Dutch Airlines.......................................................................................5
Part 2: Analysis of financial statements for last 5 years............................................................5
Financial Ratio analysis – Comparison of the two companies and industry..........................5
2.1: Profitability Ratios..............................................................................................................5
2.1.1: Return on assets............................................................................................................5
2.1.2: Return on Equity (ROE)...............................................................................................6
2.1.3: Return on Capital Employed (ROCE)..........................................................................7
2.1.4: Gross Profit Margin......................................................................................................9
2.1.5: Net profit Margin........................................................................................................10
2.2: Liquidity Ratios.................................................................................................................11
2.2.1: Current ratio...............................................................................................................11
2.2.2: Quick Ratio.................................................................................................................12
2.3: Industry Ratio....................................................................................................................13
2.3.1: Available seat kilometers (ASK)................................................................................13
2.3.2: Revenue passenger kilometers (RPK)........................................................................14
2.3.3: Passenger load factor..................................................................................................15
2.4: Asset efficiency Ratios......................................................................................................16
2.4.1: Average inventories turnover period..........................................................................16
2.4.2: Average settlement period for receivables.................................................................17
2.4.3: Average settlement period for payables.....................................................................18
2.5: Gearing Ratio....................................................................................................................19
2.5.1: Debt to capital ratio....................................................................................................19
2.5.2: Interest cover ratio......................................................................................................20
2.6. Investment ratios...............................................................................................................21
2.6.1: Earnings per Share......................................................................................................21
2.6.2: Price/Earnings ratio....................................................................................................23
2.6.3: Dividend payout ratio.................................................................................................24
2.6.4: Dividend cover ratio...................................................................................................25
⊘ This is a preview!⊘
Do you want full access?
Subscribe today to unlock all pages.
Trusted by 1+ million students worldwide
4
3. Cash-Flow Analysis.............................................................................................................26
3.1: Operating Cash-Flow / Sales.........................................................................................26
3.2: CF from borrowings / Sales...........................................................................................27
3.3: Operating CF after tax/ (Fixed assets investment +Dividends)....................................28
Part 4: Recommendations........................................................................................................29
Part 5: Conclusion....................................................................................................................29
Part 6: References....................................................................................................................30
Appendixes...............................................................................................................................32
Paraphrase This Document
Need a fresh take? Get an instant paraphrase of this document with our AI Paraphraser
5
Part 1: Introduction
The global financial crises of year 2008 and 2009 have emerged because of the failure
of some of major financial banks and institutions and it has impacted the world economy.
United Kingdom and Europe aviation sector is the most important part of world economy and
it also impacted heavily. Some of financial implication of global financial crises on aviation
sector of United Kingdom and Europe are negative growth rate, high operating cost and huge
debt. The two most valuable companies of the aviation sector of Europe and UK that have
been worst affected are British Airways (BA) and KLM Royal Dutch Airlines (KLM).
The main purpose of this report is to evaluate the case of British Airways and KLM
Royal Dutch Airlines in order to report on the financial performance and risk position of
these companies. Financial performance and risk position has been evaluated through use of
financial ratios and through using the information provided in the annual report. In this
regards financial ratios of last 5 years has been calculated for both the companies and they
have been compared with industry average in order to evaluate their business strategies
during the period of financial crises. During the financial crises period both companies have
make use of management accounting concepts and techniques such as value for money
concept, drive to reduce cost, technological innovation and other techniques to survive the
period of financial crises and to stand for future possibilities. In regards to this, report aims to
explore the potential of strategic management accounting and costing concepts and
techniques that both companies used for survival during the financial crises period and to
make strong base for future in order have comparison with similar companies.
Case of British Airways
The business of British Airways is largely impacted due to the period of global
recession due to occurrence of financial crisis in the year 2007. The sales and profit margins
of the company have depicted a major decline during the financial crisis period. It was unable
to pay nay dividend to its shareholders largely due to its negative profitability position and
operating at loss. The airline was able to overcome from the negative impact of the economic
recession by continued reinvestment in its profits and focusing on long-term growth. This is
largely on account of large-scale investment in launching crisis programs for reducing its
operational costs and aiding quick financial recovery for the company (Hunter, 2019). The
use of effective cost management strategies by the airline has enabled it to reduce its
6
operating costs and thus it was able to improve its profitability position and improve the
market share in the highly competitive airline industry.
Case of KLM Royal Dutch Airlines
KLM Royal Dutch Airlines has also effectively responded to the global recession by
the use of adequate cost management strategies. The company operating efficacy has been
largely negatively impacted by the impact of the downturn in the global economy due to the
occurrence of global financial crisis in the year 2007. The reduction in the operating costs has
enabled the company to overcome the decline in its revenue that has occurred mainly due to
the significant impact of the global financial crisis. The airline is also striving to preserve
cash by delaying the investment in the new aircraft and minimizing its capital expenditure.
This is largely done from the perspective of reserving cash and reinvesting in profit for
promoting long-term growth of the company (Done, 2009).
Part 2: Analysis of financial statements for last 5 years
Financial Ratio analysis – Comparison of the two companies and industry
In this section of the report financial analysis of British Airways (BA) and KLM
Royal Dutch Airlines (KLM) has been examined through use of ratio analysis and
comparison has also been made to investigate company’s performance with respect to
industry. The analysis of both the companies have been evaluated from the annual report of
the financial year 2013, 2014, 2015, 2016 and 2017. Financial ratios are the key tools which
is implemented in order to understand the overall financial strength of the company.
Comparison based on the last five years of both the company gives far better picture of the
financial position as a whole.
2.1: Profitability Ratios
Profitability ratios refers to class of financial metrics that is used to evaluate ability of
entity to generate the earnings in relation to some metrics such as sales, capital employed,
assets and equity. These ratios are important from the point of view of investors as well as
from the point of management because it helps with company profitability position during the
relative year (Brigham and Michael, 2013). This ratio helps to measure the effectiveness in
generating the return for both the company for the last five years.
⊘ This is a preview!⊘
Do you want full access?
Subscribe today to unlock all pages.
Trusted by 1+ million students worldwide
7
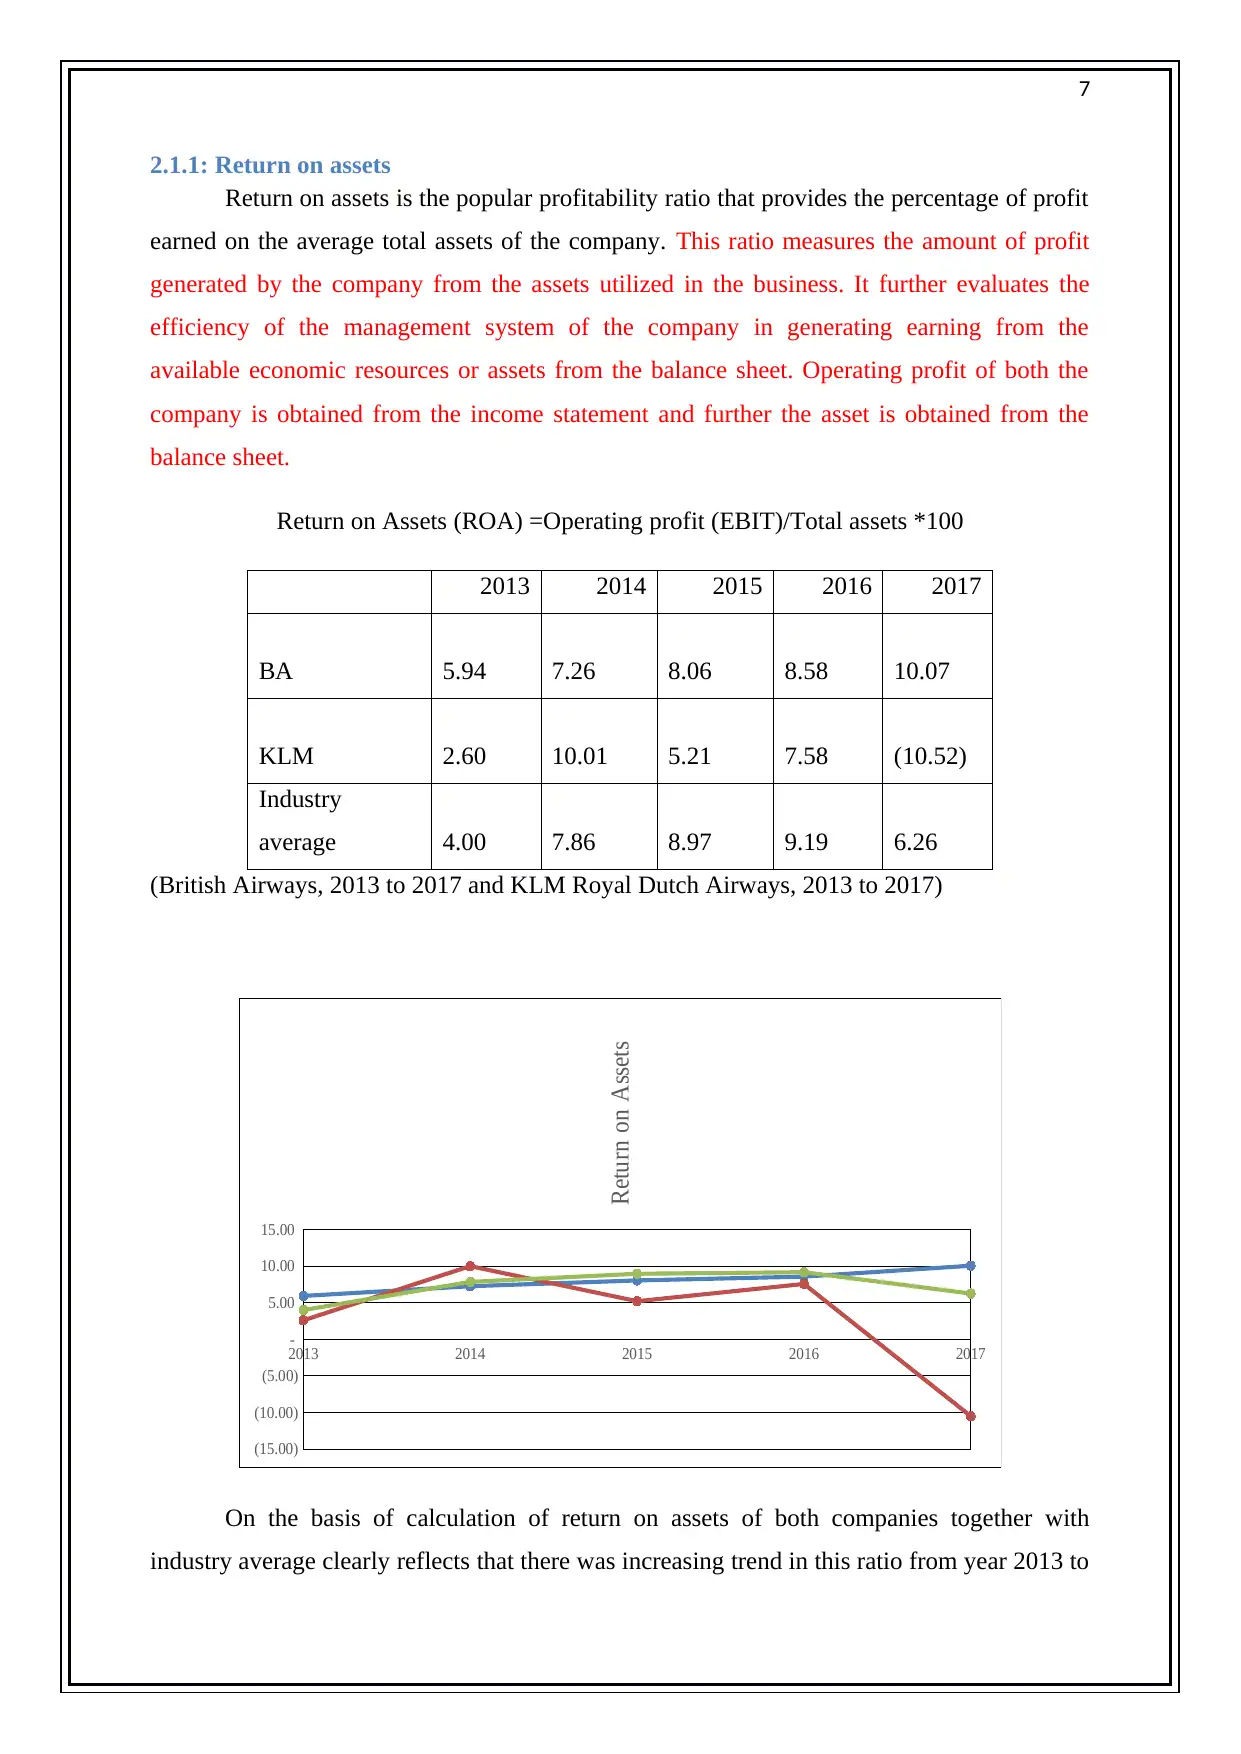
2.1.1: Return on assets
Return on assets is the popular profitability ratio that provides the percentage of profit
earned on the average total assets of the company. This ratio measures the amount of profit
generated by the company from the assets utilized in the business. It further evaluates the
efficiency of the management system of the company in generating earning from the
available economic resources or assets from the balance sheet. Operating profit of both the
company is obtained from the income statement and further the asset is obtained from the
balance sheet.
Return on Assets (ROA) =Operating profit (EBIT)/Total assets *100
2013 2014 2015 2016 2017
BA 5.94 7.26 8.06 8.58 10.07
KLM 2.60 10.01 5.21 7.58 (10.52)
Industry
average 4.00 7.86 8.97 9.19 6.26
(British Airways, 2013 to 2017 and KLM Royal Dutch Airways, 2013 to 2017)
2013 2014 2015 2016 2017
(15.00)
(10.00)
(5.00)
-
5.00
10.00
15.00
Return on Assets
On the basis of calculation of return on assets of both companies together with
industry average clearly reflects that there was increasing trend in this ratio from year 2013 to
Paraphrase This Document
Need a fresh take? Get an instant paraphrase of this document with our AI Paraphraser
8
2017. Return on assets ratio of BA from year 2013 to 2017 have increased each year from
5.94% in year 2013 to 10.07% in year 2017. It means BA has used assets more precisely as
compared to KLM. The return on assets ratio of KLM was above industry average during the
last five years and on the other hand, return on asset of KLM was below industry average. So,
BA has provided better return on assets as compared to KLM in all the five years under
review.
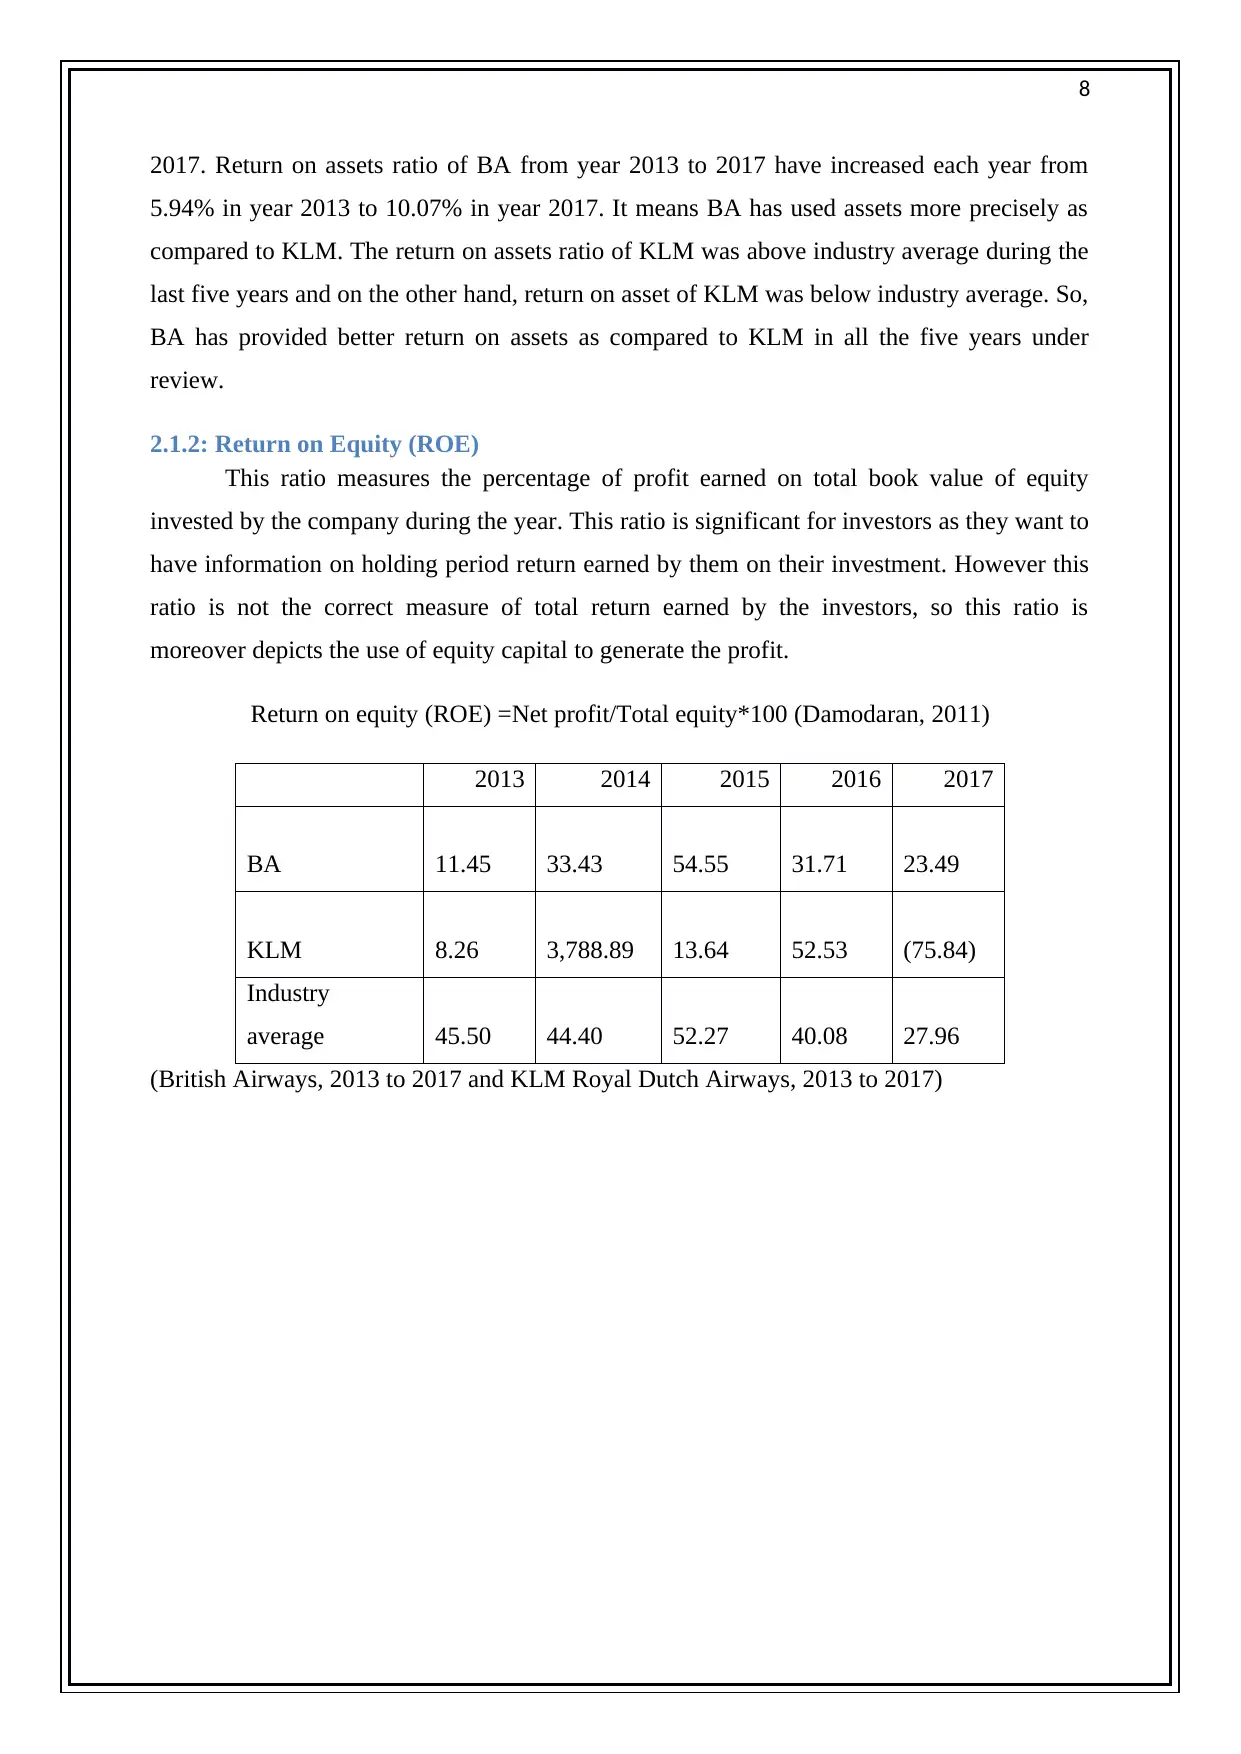
2.1.2: Return on Equity (ROE)
This ratio measures the percentage of profit earned on total book value of equity
invested by the company during the year. This ratio is significant for investors as they want to
have information on holding period return earned by them on their investment. However this
ratio is not the correct measure of total return earned by the investors, so this ratio is
moreover depicts the use of equity capital to generate the profit.
Return on equity (ROE) =Net profit/Total equity*100 (Damodaran, 2011)
2013 2014 2015 2016 2017
BA 11.45 33.43 54.55 31.71 23.49
KLM 8.26 3,788.89 13.64 52.53 (75.84)
Industry
average 45.50 44.40 52.27 40.08 27.96
(British Airways, 2013 to 2017 and KLM Royal Dutch Airways, 2013 to 2017)
2017. Return on assets ratio of BA from year 2013 to 2017 have increased each year from
5.94% in year 2013 to 10.07% in year 2017. It means BA has used assets more precisely as
compared to KLM. The return on assets ratio of KLM was above industry average during the
last five years and on the other hand, return on asset of KLM was below industry average. So,
BA has provided better return on assets as compared to KLM in all the five years under
review.
2.1.2: Return on Equity (ROE)
This ratio measures the percentage of profit earned on total book value of equity
invested by the company during the year. This ratio is significant for investors as they want to
have information on holding period return earned by them on their investment. However this
ratio is not the correct measure of total return earned by the investors, so this ratio is
moreover depicts the use of equity capital to generate the profit.
Return on equity (ROE) =Net profit/Total equity*100 (Damodaran, 2011)
2013 2014 2015 2016 2017
BA 11.45 33.43 54.55 31.71 23.49
KLM 8.26 3,788.89 13.64 52.53 (75.84)
Industry
average 45.50 44.40 52.27 40.08 27.96
(British Airways, 2013 to 2017 and KLM Royal Dutch Airways, 2013 to 2017)
9
2013 2014 2015 2016 2017
(1,000.00)
-
1,000.00
2,000.00
3,000.00
4,000.00
BA
KLM
Industry average
Return on Eeuity
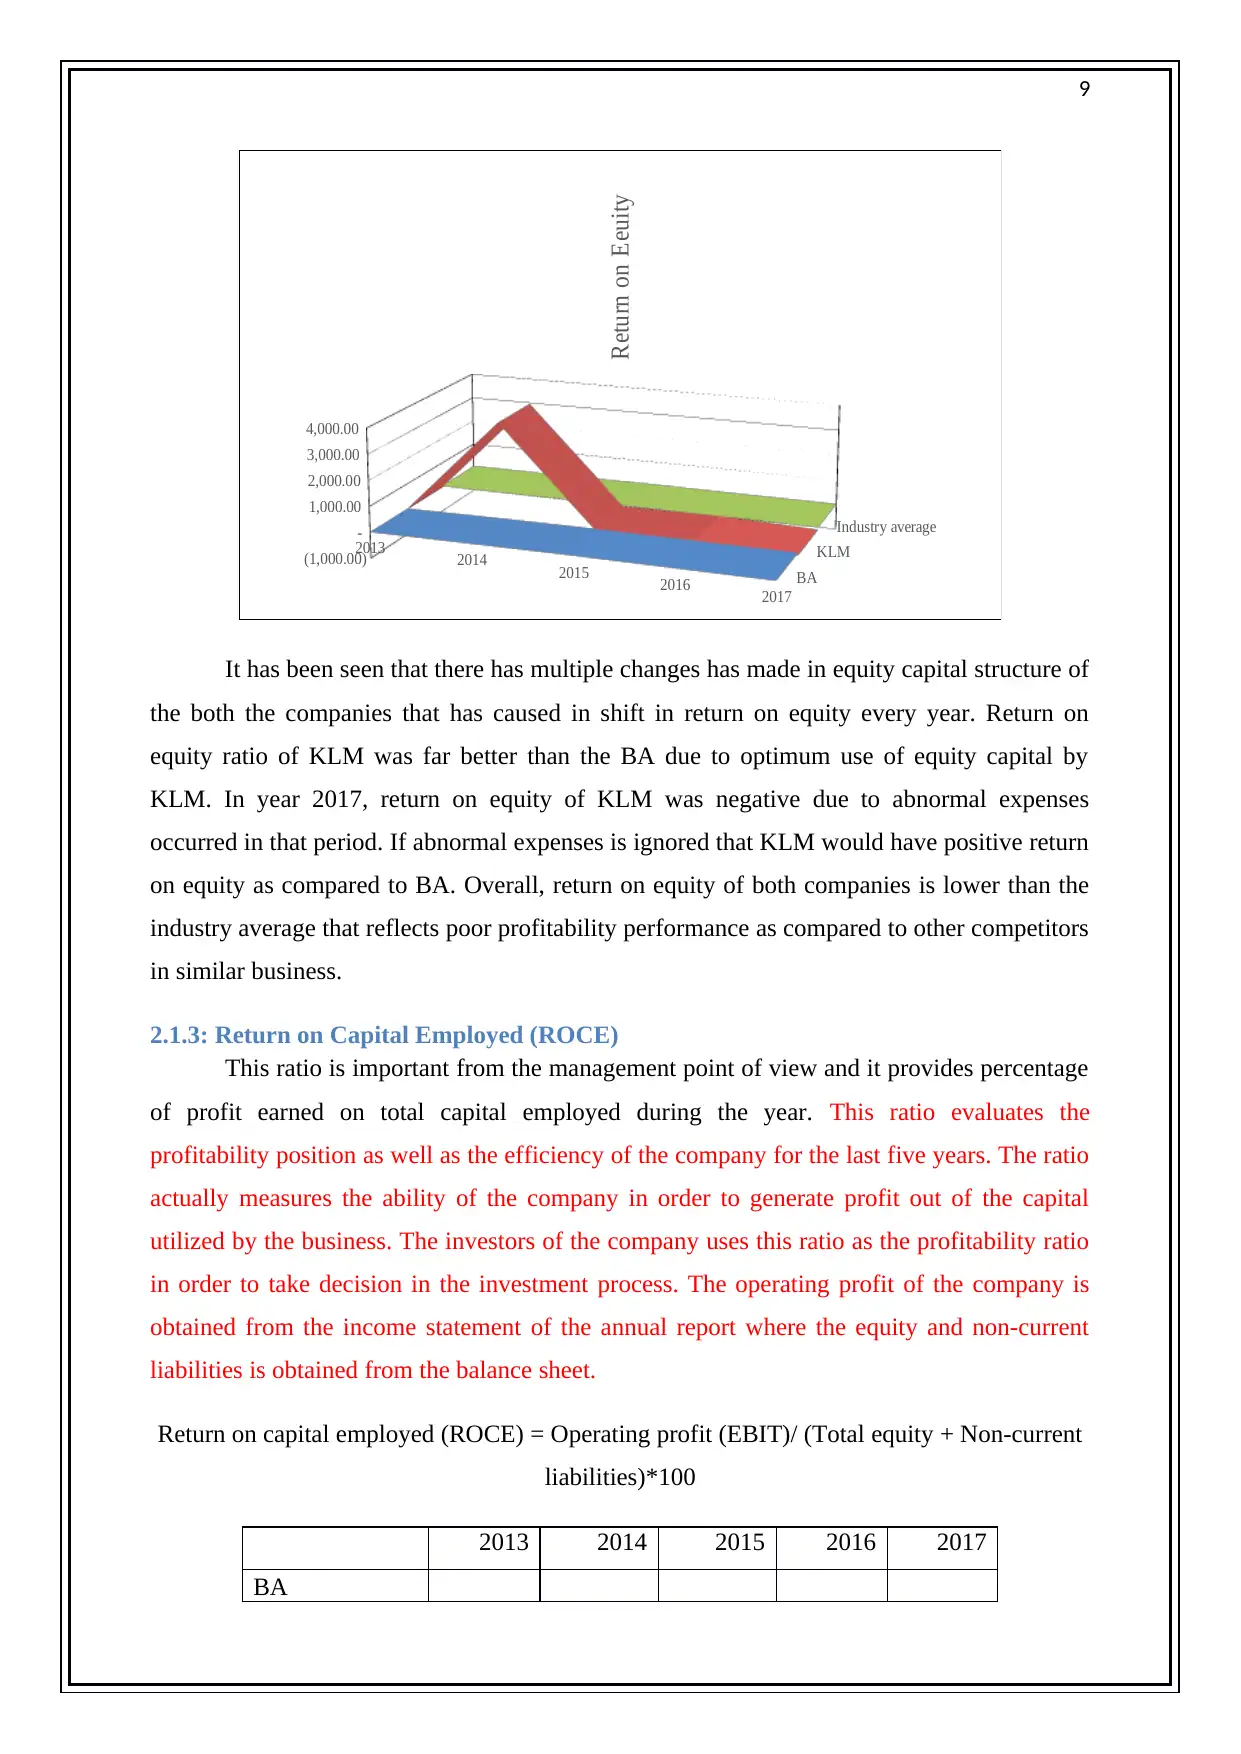
It has been seen that there has multiple changes has made in equity capital structure of
the both the companies that has caused in shift in return on equity every year. Return on
equity ratio of KLM was far better than the BA due to optimum use of equity capital by
KLM. In year 2017, return on equity of KLM was negative due to abnormal expenses
occurred in that period. If abnormal expenses is ignored that KLM would have positive return
on equity as compared to BA. Overall, return on equity of both companies is lower than the
industry average that reflects poor profitability performance as compared to other competitors
in similar business.
2.1.3: Return on Capital Employed (ROCE)
This ratio is important from the management point of view and it provides percentage
of profit earned on total capital employed during the year. This ratio evaluates the
profitability position as well as the efficiency of the company for the last five years. The ratio
actually measures the ability of the company in order to generate profit out of the capital
utilized by the business. The investors of the company uses this ratio as the profitability ratio
in order to take decision in the investment process. The operating profit of the company is
obtained from the income statement of the annual report where the equity and non-current
liabilities is obtained from the balance sheet.
Return on capital employed (ROCE) = Operating profit (EBIT)/ (Total equity + Non-current
liabilities)*100
2013 2014 2015 2016 2017
BA
2013 2014 2015 2016 2017
(1,000.00)
-
1,000.00
2,000.00
3,000.00
4,000.00
BA
KLM
Industry average
Return on Eeuity
It has been seen that there has multiple changes has made in equity capital structure of
the both the companies that has caused in shift in return on equity every year. Return on
equity ratio of KLM was far better than the BA due to optimum use of equity capital by
KLM. In year 2017, return on equity of KLM was negative due to abnormal expenses
occurred in that period. If abnormal expenses is ignored that KLM would have positive return
on equity as compared to BA. Overall, return on equity of both companies is lower than the
industry average that reflects poor profitability performance as compared to other competitors
in similar business.
2.1.3: Return on Capital Employed (ROCE)
This ratio is important from the management point of view and it provides percentage
of profit earned on total capital employed during the year. This ratio evaluates the
profitability position as well as the efficiency of the company for the last five years. The ratio
actually measures the ability of the company in order to generate profit out of the capital
utilized by the business. The investors of the company uses this ratio as the profitability ratio
in order to take decision in the investment process. The operating profit of the company is
obtained from the income statement of the annual report where the equity and non-current
liabilities is obtained from the balance sheet.
Return on capital employed (ROCE) = Operating profit (EBIT)/ (Total equity + Non-current
liabilities)*100
2013 2014 2015 2016 2017
BA
⊘ This is a preview!⊘
Do you want full access?
Subscribe today to unlock all pages.
Trusted by 1+ million students worldwide
10
9.71 12.30 12.80 12.69 14.99
KLM 4.05 19.88 9.63 12.93 (19.21)
Industry
average 5.60 6.10 11.60 11.20 9.50
(British Airways, 2013 to 2017 and KLM Royal Dutch Airways, 2013 to 2017)
2013 2014 2015 2016 2017
(25.00)
(20.00)
(15.00)
(10.00)
(5.00)
-
5.00
10.00
15.00
20.00
25.00
Return on Capital
Employed
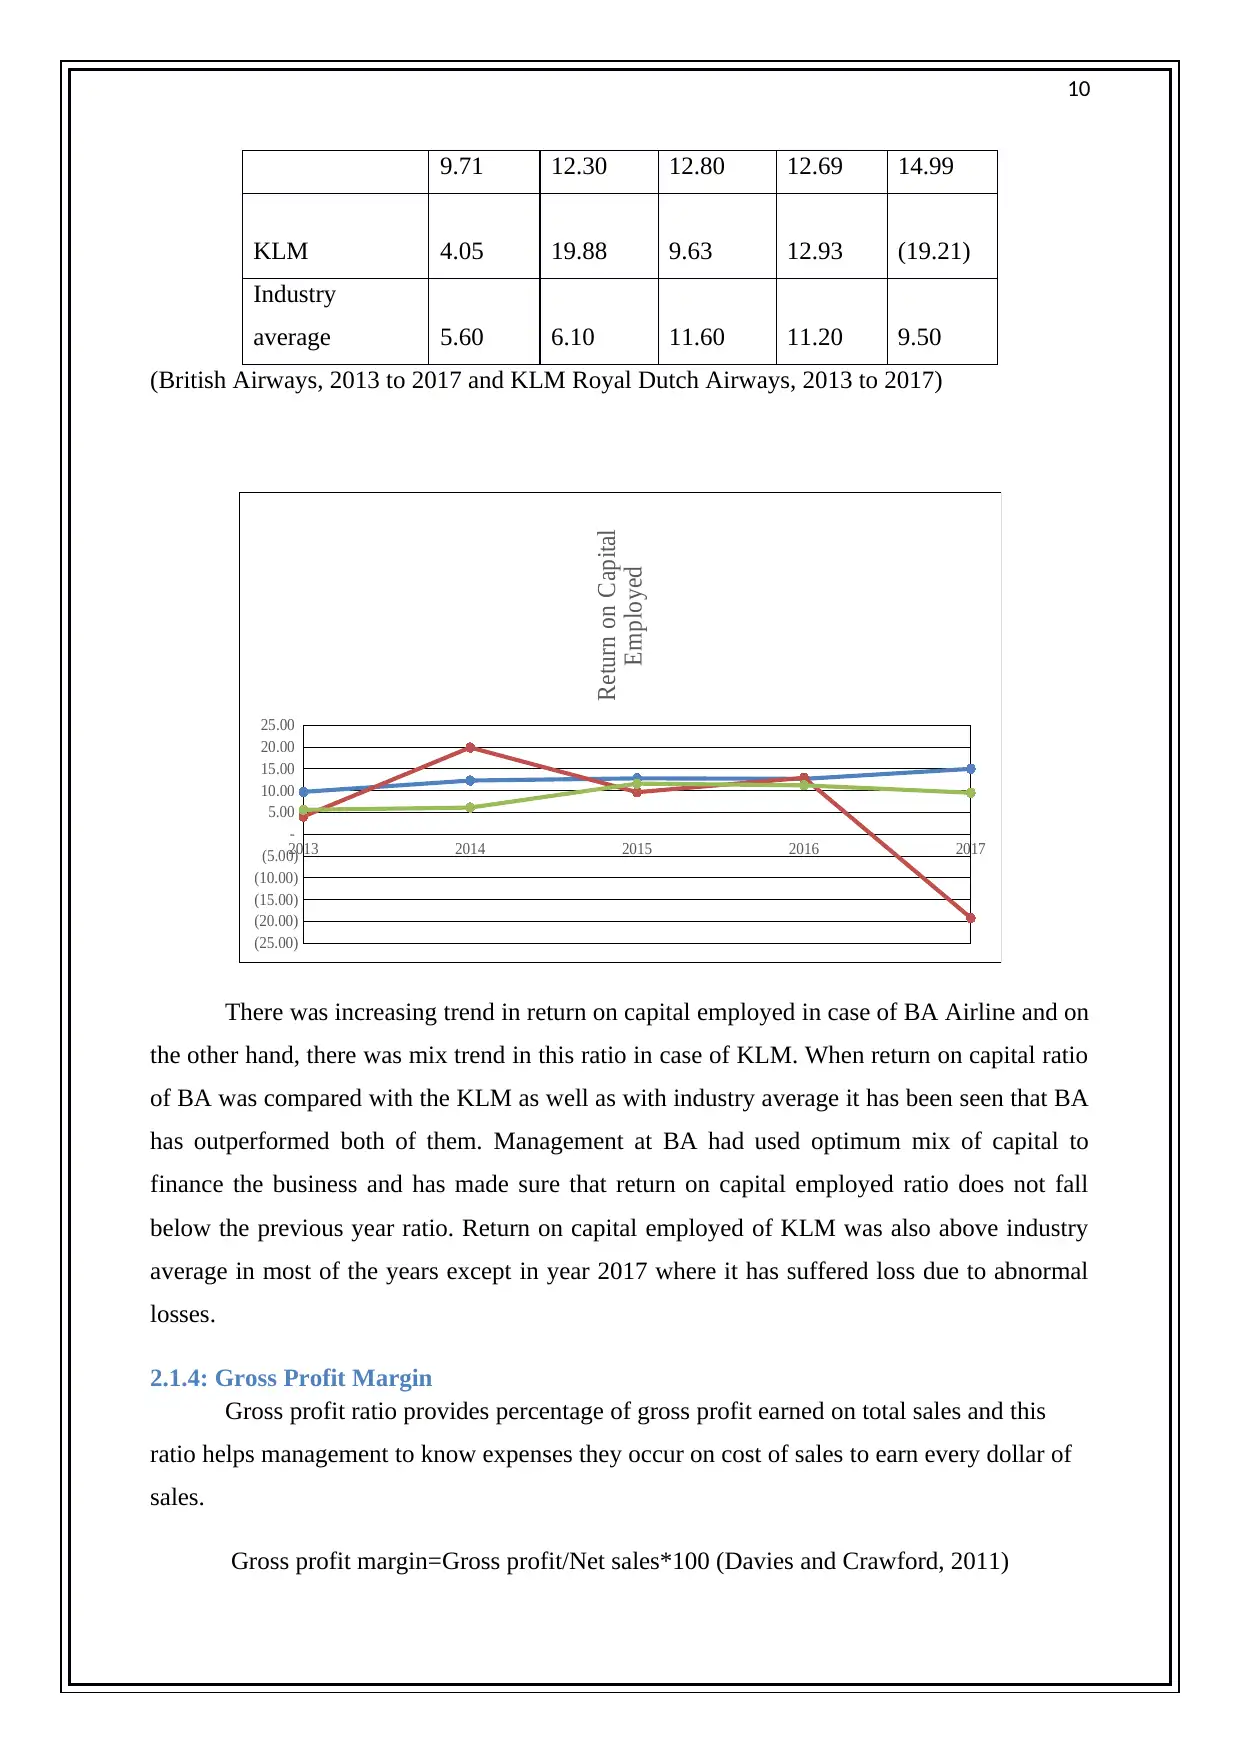
There was increasing trend in return on capital employed in case of BA Airline and on
the other hand, there was mix trend in this ratio in case of KLM. When return on capital ratio
of BA was compared with the KLM as well as with industry average it has been seen that BA
has outperformed both of them. Management at BA had used optimum mix of capital to
finance the business and has made sure that return on capital employed ratio does not fall
below the previous year ratio. Return on capital employed of KLM was also above industry
average in most of the years except in year 2017 where it has suffered loss due to abnormal
losses.
2.1.4: Gross Profit Margin
Gross profit ratio provides percentage of gross profit earned on total sales and this
ratio helps management to know expenses they occur on cost of sales to earn every dollar of
sales.
Gross profit margin=Gross profit/Net sales*100 (Davies and Crawford, 2011)
9.71 12.30 12.80 12.69 14.99
KLM 4.05 19.88 9.63 12.93 (19.21)
Industry
average 5.60 6.10 11.60 11.20 9.50
(British Airways, 2013 to 2017 and KLM Royal Dutch Airways, 2013 to 2017)
2013 2014 2015 2016 2017
(25.00)
(20.00)
(15.00)
(10.00)
(5.00)
-
5.00
10.00
15.00
20.00
25.00
Return on Capital
Employed
There was increasing trend in return on capital employed in case of BA Airline and on
the other hand, there was mix trend in this ratio in case of KLM. When return on capital ratio
of BA was compared with the KLM as well as with industry average it has been seen that BA
has outperformed both of them. Management at BA had used optimum mix of capital to
finance the business and has made sure that return on capital employed ratio does not fall
below the previous year ratio. Return on capital employed of KLM was also above industry
average in most of the years except in year 2017 where it has suffered loss due to abnormal
losses.
2.1.4: Gross Profit Margin
Gross profit ratio provides percentage of gross profit earned on total sales and this
ratio helps management to know expenses they occur on cost of sales to earn every dollar of
sales.
Gross profit margin=Gross profit/Net sales*100 (Davies and Crawford, 2011)
Paraphrase This Document
Need a fresh take? Get an instant paraphrase of this document with our AI Paraphraser
11
2013 2014 2015 2016 2017
BA 6.20 8.32 10.93 12.40 13.74
KLM 2.58 8.83 4.59 6.98 (9.08)
Industry
average 6.48 8.69 15.71 14.58 11.83
(British Airways, 2013 to 2017 and KLM Royal Dutch Airways, 2013 to 2017)
2013 2014 2015 2016 2017
(15.00)
(10.00)
(5.00)
-
5.00
10.00
15.00
20.00
Gross Profit Margin
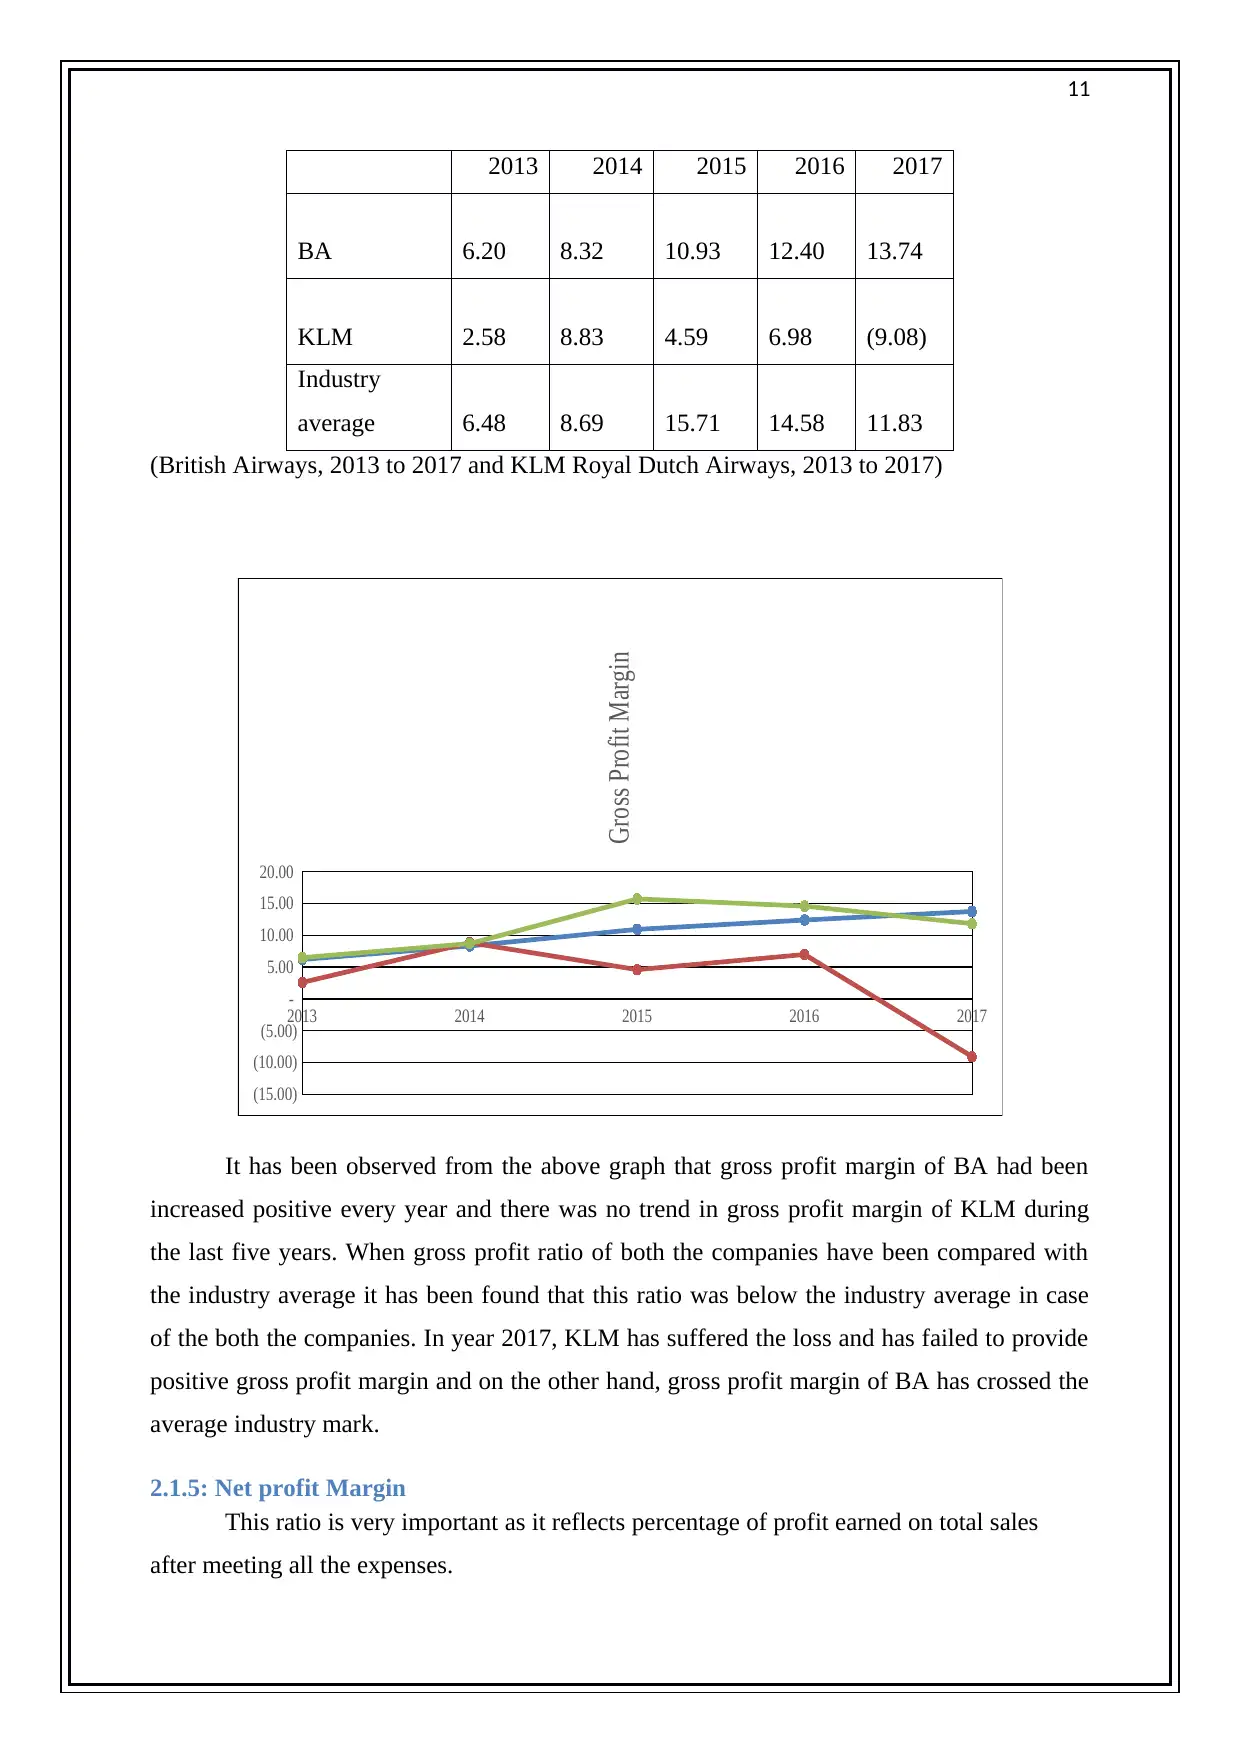
It has been observed from the above graph that gross profit margin of BA had been
increased positive every year and there was no trend in gross profit margin of KLM during
the last five years. When gross profit ratio of both the companies have been compared with
the industry average it has been found that this ratio was below the industry average in case
of the both the companies. In year 2017, KLM has suffered the loss and has failed to provide
positive gross profit margin and on the other hand, gross profit margin of BA has crossed the
average industry mark.
2.1.5: Net profit Margin
This ratio is very important as it reflects percentage of profit earned on total sales
after meeting all the expenses.
2013 2014 2015 2016 2017
BA 6.20 8.32 10.93 12.40 13.74
KLM 2.58 8.83 4.59 6.98 (9.08)
Industry
average 6.48 8.69 15.71 14.58 11.83
(British Airways, 2013 to 2017 and KLM Royal Dutch Airways, 2013 to 2017)
2013 2014 2015 2016 2017
(15.00)
(10.00)
(5.00)
-
5.00
10.00
15.00
20.00
Gross Profit Margin
It has been observed from the above graph that gross profit margin of BA had been
increased positive every year and there was no trend in gross profit margin of KLM during
the last five years. When gross profit ratio of both the companies have been compared with
the industry average it has been found that this ratio was below the industry average in case
of the both the companies. In year 2017, KLM has suffered the loss and has failed to provide
positive gross profit margin and on the other hand, gross profit margin of BA has crossed the
average industry mark.
2.1.5: Net profit Margin
This ratio is very important as it reflects percentage of profit earned on total sales
after meeting all the expenses.
12
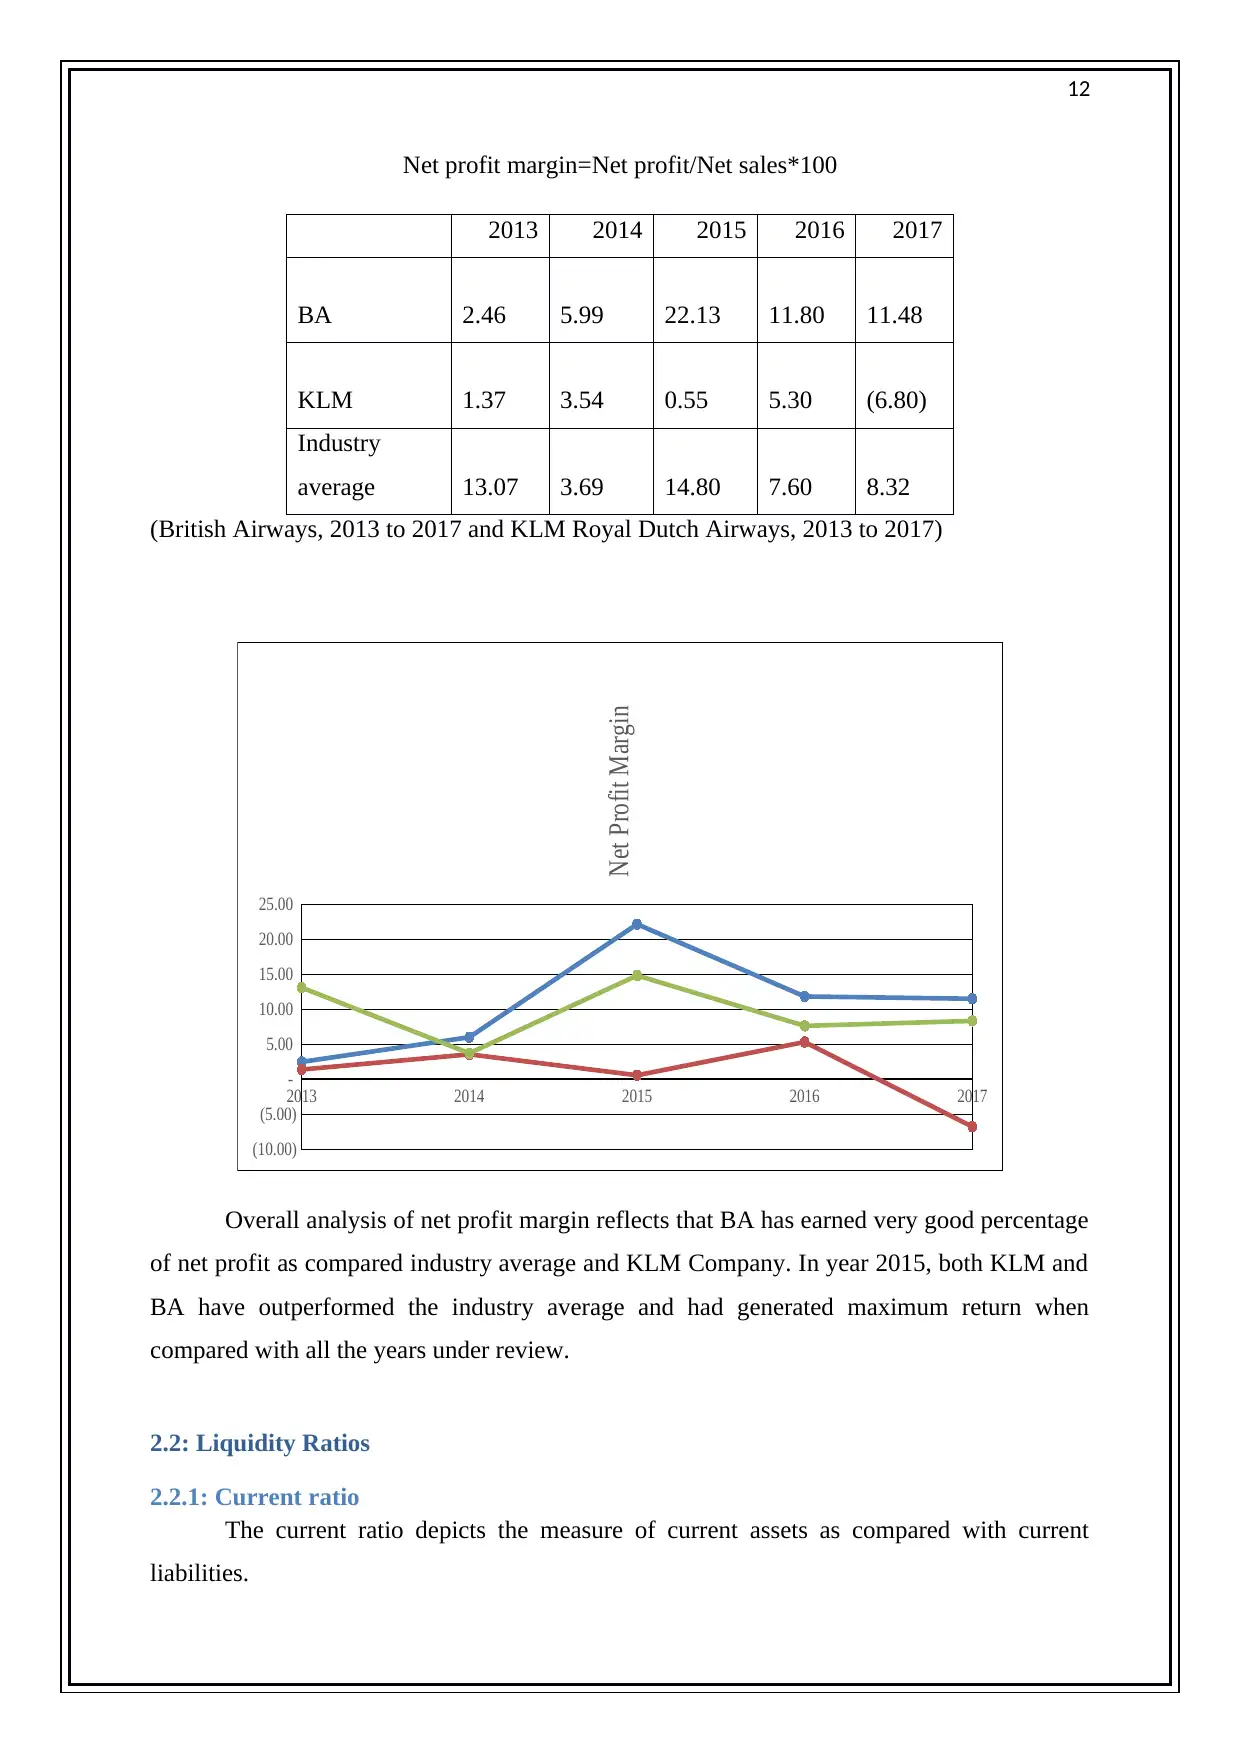
Net profit margin=Net profit/Net sales*100
2013 2014 2015 2016 2017
BA 2.46 5.99 22.13 11.80 11.48
KLM 1.37 3.54 0.55 5.30 (6.80)
Industry
average 13.07 3.69 14.80 7.60 8.32
(British Airways, 2013 to 2017 and KLM Royal Dutch Airways, 2013 to 2017)
2013 2014 2015 2016 2017
(10.00)
(5.00)
-
5.00
10.00
15.00
20.00
25.00
Net Profit Margin
Overall analysis of net profit margin reflects that BA has earned very good percentage
of net profit as compared industry average and KLM Company. In year 2015, both KLM and
BA have outperformed the industry average and had generated maximum return when
compared with all the years under review.
2.2: Liquidity Ratios
2.2.1: Current ratio
The current ratio depicts the measure of current assets as compared with current
liabilities.
⊘ This is a preview!⊘
Do you want full access?
Subscribe today to unlock all pages.
Trusted by 1+ million students worldwide
1 out of 43
Related Documents


Your All-in-One AI-Powered Toolkit for Academic Success.
+13062052269
info@desklib.com
Available 24*7 on WhatsApp / Email
![[object Object]](/_next/static/media/star-bottom.7253800d.svg)
Unlock your academic potential
Copyright © 2020–2026 A2Z Services. All Rights Reserved. Developed and managed by ZUCOL.