Financial Assessment of British Airways and KLM Airlines
VerifiedAdded on 2022/12/12
|18
|4346
|208
Report
AI Summary
This report presents a comprehensive financial analysis and comparison of British Airways and KLM Royal Dutch Airlines, focusing on their performance from 2016 to 2018. The analysis includes trend analysis, ratio analysis (profitability, asset efficiency, liquidity, gearing, and investment ratios), and industry average comparisons. The report evaluates key financial metrics such as net profit, revenues, assets, and various ratios to determine each company's financial health and efficiency. It also explores strategic management accounting and cost reduction techniques within the context of the aviation industry, providing insights into the companies' operational and financial strategies. The findings offer a detailed assessment of the financial implications and performance of both airlines, highlighting their strengths, weaknesses, and overall financial stability while also considering the impact of the 2008 financial crisis on the airline industry.
Running Head: Finance Reporting and Accounting Management
Finance Reporting and Accounting Management
Finance Reporting and Accounting Management
Paraphrase This Document
Need a fresh take? Get an instant paraphrase of this document with our AI Paraphraser
Finance Reporting and Accounting Management
Contents
1. Introduction...................................................................................................................................2
2. Financial Assessment and Comparison of British Airways and KLM Royal Dutch Airlines........3
I. Trend Analysis...........................................................................................................................3
II. Ratio Analysis...........................................................................................................................6
1. Profitability Ratios.................................................................................................................6
2. Assets Efficiency Ratio..........................................................................................................7
3. Liquidity Ratio.......................................................................................................................8
4. Gearing Ratio.........................................................................................................................8
5. Investment Ratio....................................................................................................................9
III. Industry Average.................................................................................................................10
1. Available seat kilometres (ASK) mln..................................................................................10
2. Revenue passenger kilometres (RPK) mln...........................................................................11
3. Passenger load factor (%)....................................................................................................11
3. Strategic Management Accounting and Cost Reduction Techniques...........................................12
4. Conclusion...................................................................................................................................15
References...........................................................................................................................................16
1
Finance Reporting and Accounting Management
1. Introduction
Aviation Industry plays a major role towards the growth of the economy both socially and
economically. It is not only one of the main modes of transportation but it is also a source of
employment of many people and contributes heavily to the GDP of the country (Goyal and
Negi, 2014). No, doubt the global financial crisis of 2008 had a great adverse impact on
almost all the sectors but it had a severe impact on the airlines industry. The companies like
British Airways and KLM Royal Dutch Airlines had also suffered because of the crisis whose
impact could still be felt by the companies.
British Airways and KLM Royal Dutch Airlines were the biggest companies in the whole
wide world in terms of its presence, profits, technological advance etc. There are many
efforts which were and still being made by both of the companies to provide “value for
money” to their customers and win their satisfaction by satisfying them with the innovative
services driven by technology.
2
⊘ This is a preview!⊘
Do you want full access?
Subscribe today to unlock all pages.
Trusted by 1+ million students worldwide
Finance Reporting and Accounting Management
2. Financial Assessment and Comparison of British Airways and KLM Royal Dutch
Airlines
The financial assessment of British Airways and KLM Royal Dutch Airlines are being
carried out to study their performance after the financial crisis. Performance of both the
companies are analysed for the past three years i.e., 2016, 2017 and 2018 through trend
analysis, Industry average analysis and ratio analysis. This analysis would also facilitate us to
know about which company is performing better and could be preferred for the investment.
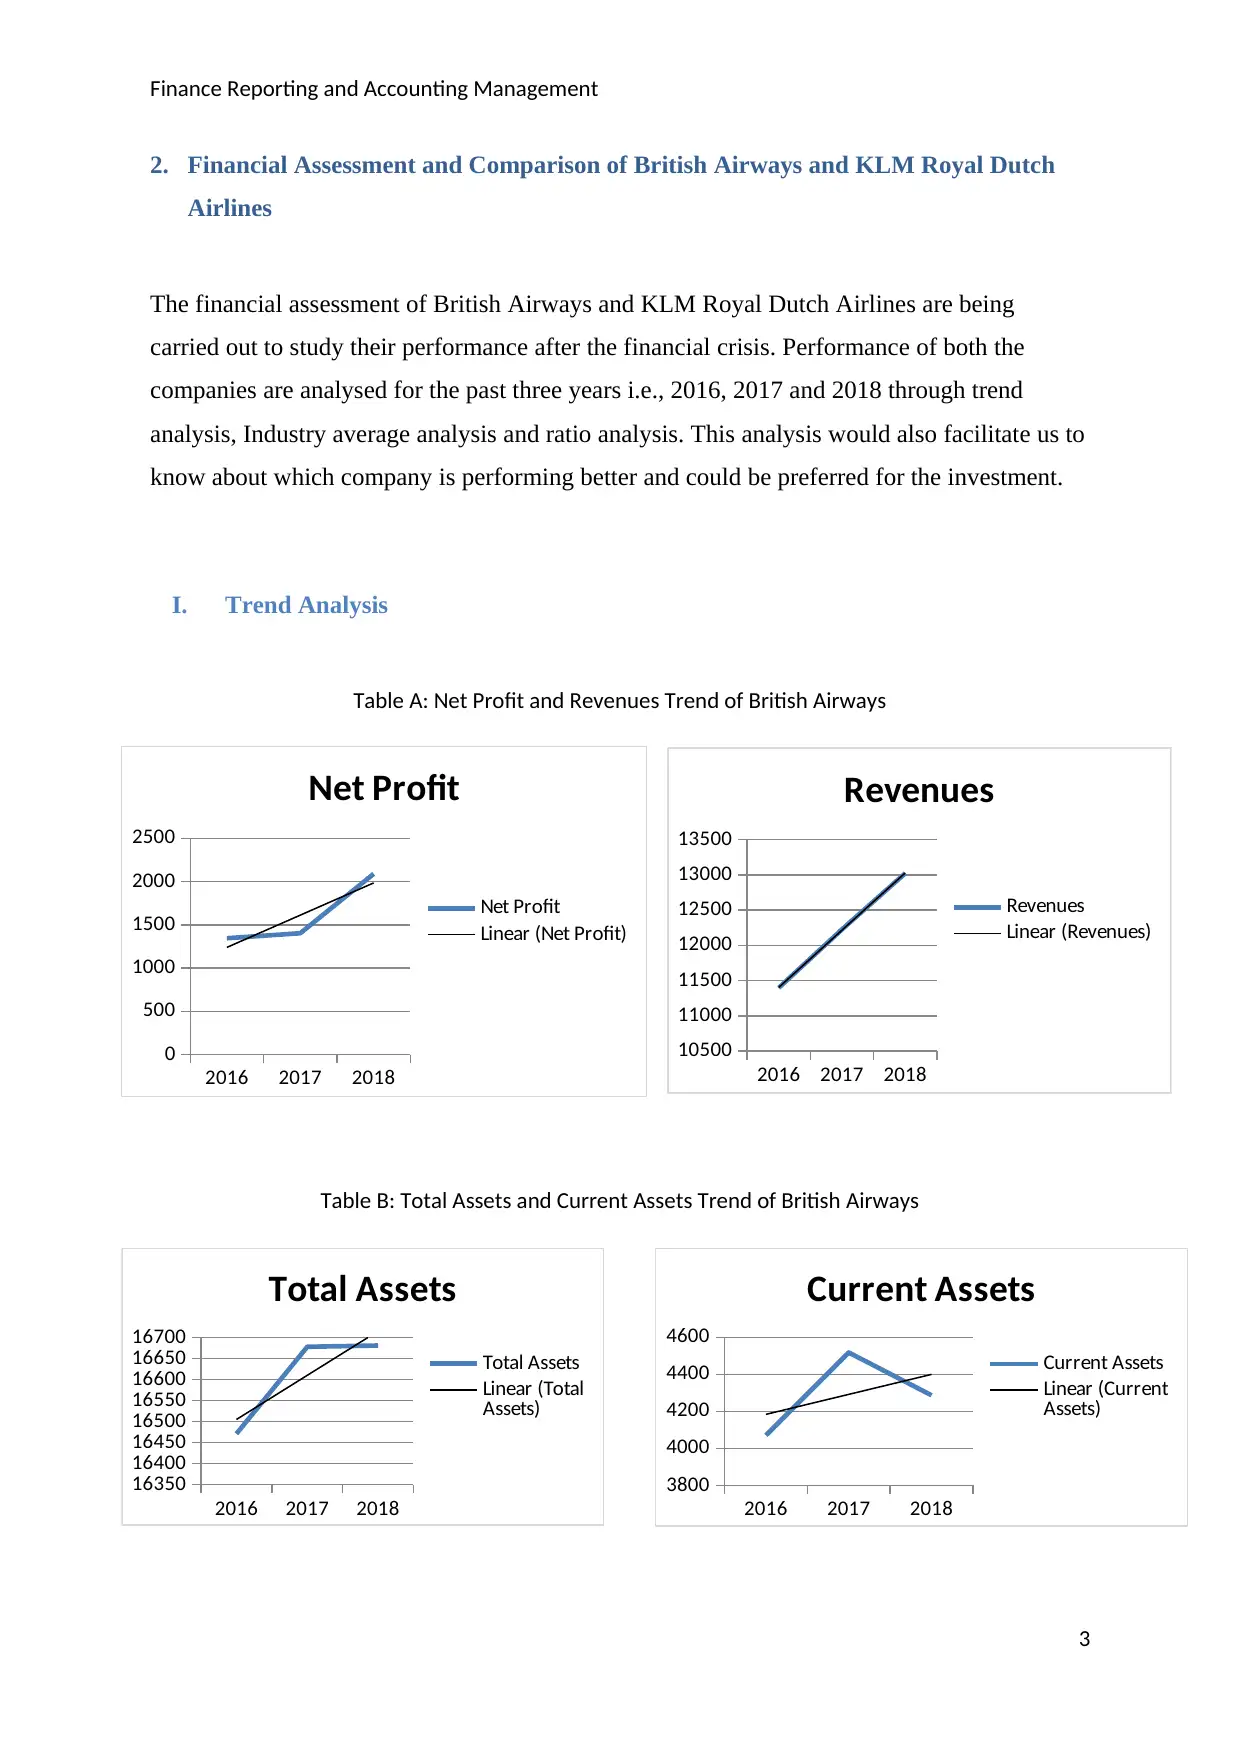
I. Trend Analysis
Table A: Net Profit and Revenues Trend of British Airways
Table B: Total Assets and Current Assets Trend of British Airways
3
2016 2017 2018
0
500
1000
1500
2000
2500
Net Profit
Net Profit
Linear (Net Profit)
2016 2017 2018
16350
16400
16450
16500
16550
16600
16650
16700
Total Assets
Total Assets
Linear (Total
Assets)
2016 2017 2018
3800
4000
4200
4400
4600
Current Assets
Current Assets
Linear (Current
Assets)
2016 2017 2018
10500
11000
11500
12000
12500
13000
13500
Revenues
Revenues
Linear (Revenues)
2. Financial Assessment and Comparison of British Airways and KLM Royal Dutch
Airlines
The financial assessment of British Airways and KLM Royal Dutch Airlines are being
carried out to study their performance after the financial crisis. Performance of both the
companies are analysed for the past three years i.e., 2016, 2017 and 2018 through trend
analysis, Industry average analysis and ratio analysis. This analysis would also facilitate us to
know about which company is performing better and could be preferred for the investment.
I. Trend Analysis
Table A: Net Profit and Revenues Trend of British Airways
Table B: Total Assets and Current Assets Trend of British Airways
3
2016 2017 2018
0
500
1000
1500
2000
2500
Net Profit
Net Profit
Linear (Net Profit)
2016 2017 2018
16350
16400
16450
16500
16550
16600
16650
16700
Total Assets
Total Assets
Linear (Total
Assets)
2016 2017 2018
3800
4000
4200
4400
4600
Current Assets
Current Assets
Linear (Current
Assets)
2016 2017 2018
10500
11000
11500
12000
12500
13000
13500
Revenues
Revenues
Linear (Revenues)
Paraphrase This Document
Need a fresh take? Get an instant paraphrase of this document with our AI Paraphraser
Finance Reporting and Accounting Management
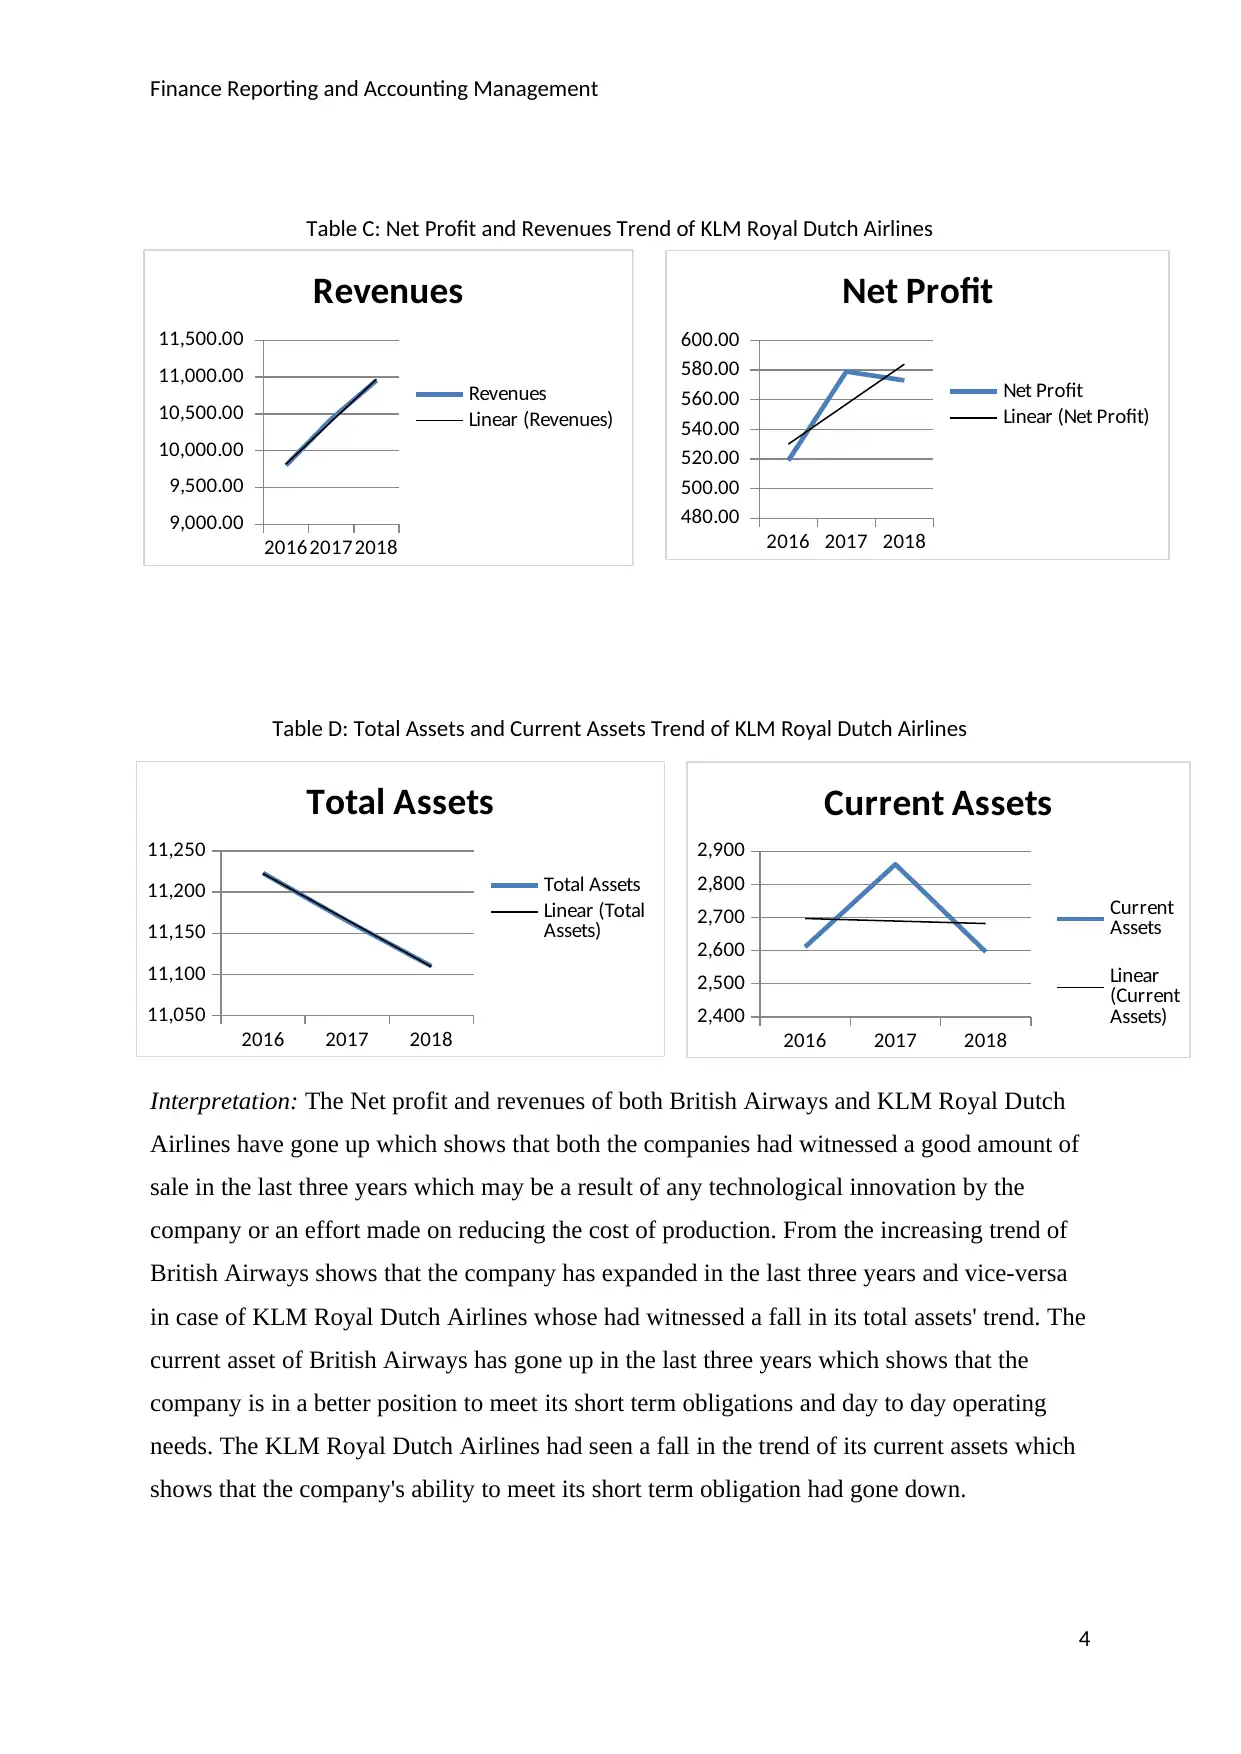
Table C: Net Profit and Revenues Trend of KLM Royal Dutch Airlines
Table D: Total Assets and Current Assets Trend of KLM Royal Dutch Airlines
Interpretation: The Net profit and revenues of both British Airways and KLM Royal Dutch
Airlines have gone up which shows that both the companies had witnessed a good amount of
sale in the last three years which may be a result of any technological innovation by the
company or an effort made on reducing the cost of production. From the increasing trend of
British Airways shows that the company has expanded in the last three years and vice-versa
in case of KLM Royal Dutch Airlines whose had witnessed a fall in its total assets' trend. The
current asset of British Airways has gone up in the last three years which shows that the
company is in a better position to meet its short term obligations and day to day operating
needs. The KLM Royal Dutch Airlines had seen a fall in the trend of its current assets which
shows that the company's ability to meet its short term obligation had gone down.
4
201620172018
9,000.00
9,500.00
10,000.00
10,500.00
11,000.00
11,500.00
Revenues
Revenues
Linear (Revenues)
2016 2017 2018
11,050
11,100
11,150
11,200
11,250
Total Assets
Total Assets
Linear (Total
Assets)
2016 2017 2018
2,400
2,500
2,600
2,700
2,800
2,900
Current Assets
Current
Assets
Linear
(Current
Assets)
2016 2017 2018
480.00
500.00
520.00
540.00
560.00
580.00
600.00
Net Profit
Net Profit
Linear (Net Profit)
Finance Reporting and Accounting Management
II. Ratio Analysis
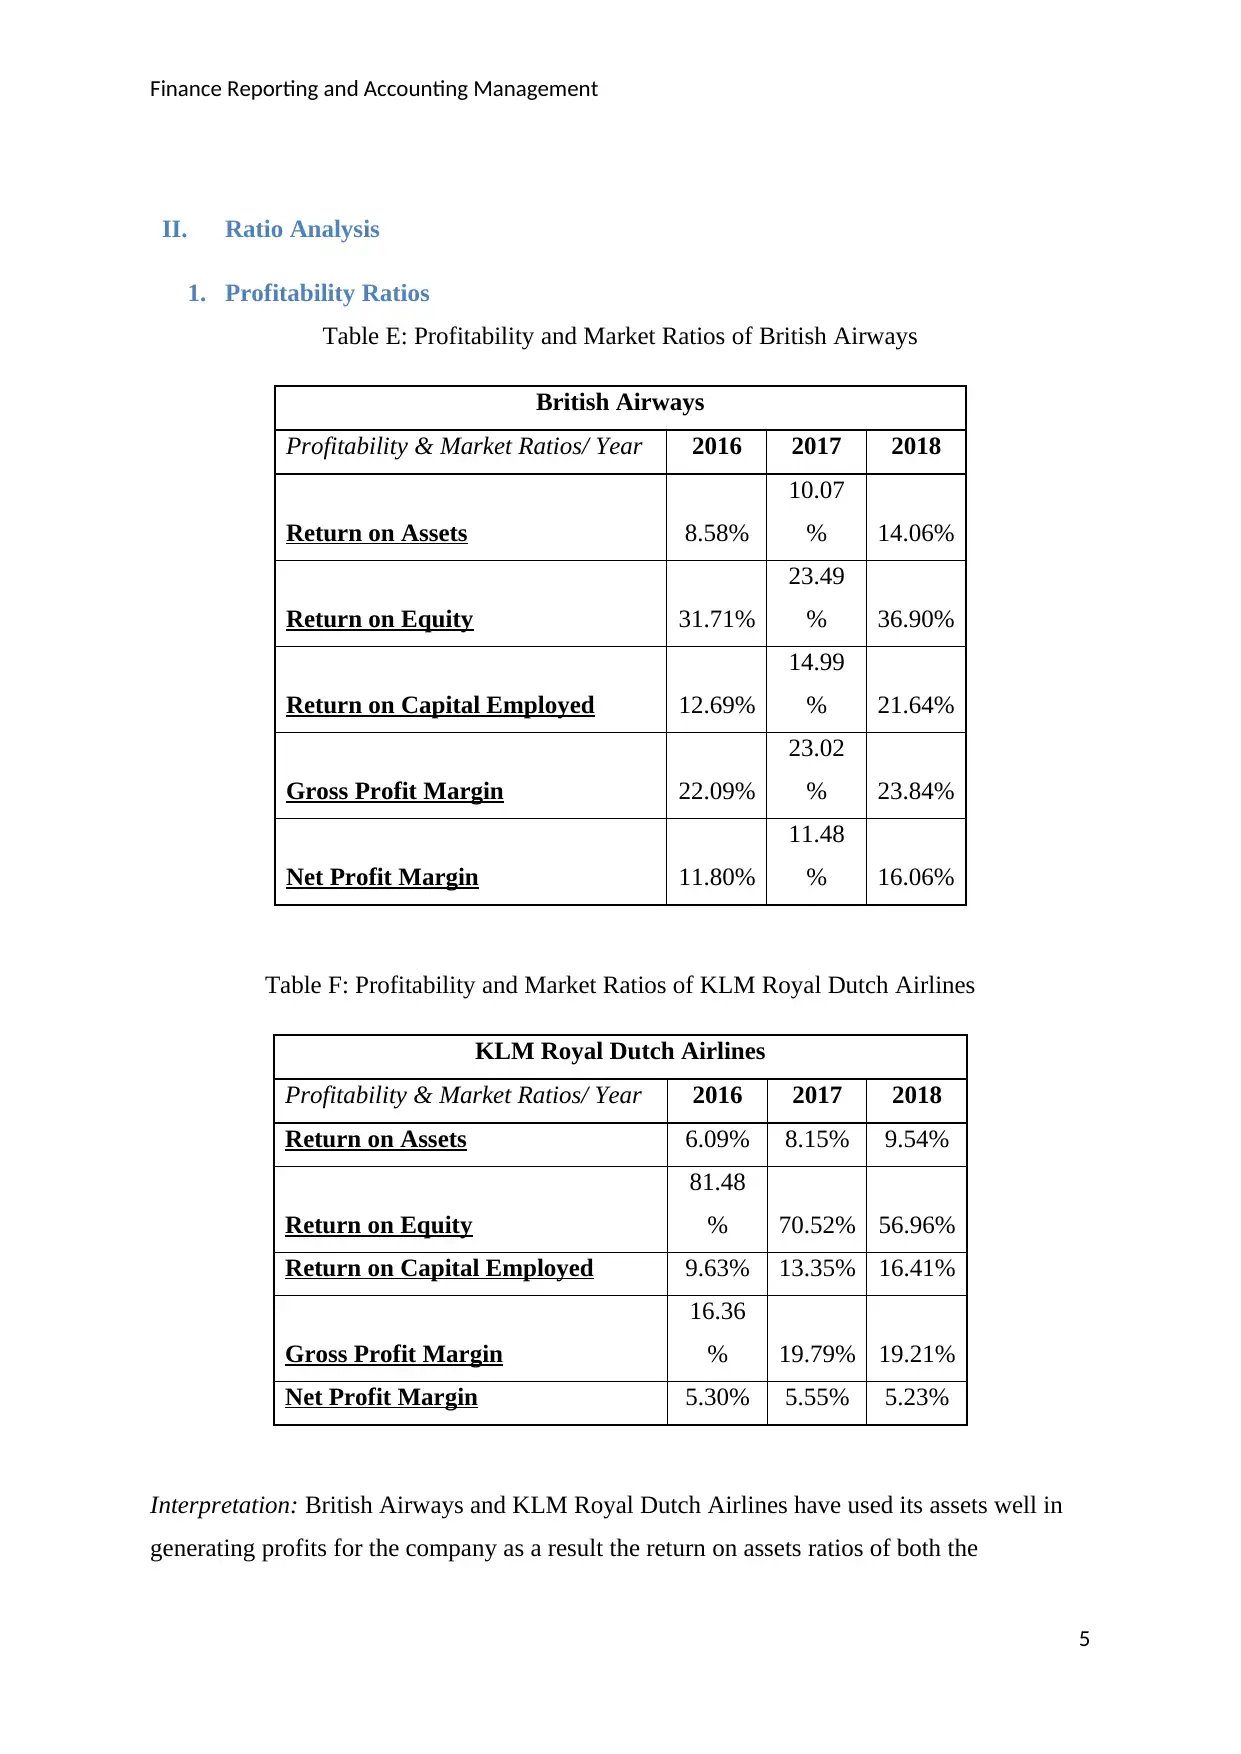
1. Profitability Ratios
Table E: Profitability and Market Ratios of British Airways
British Airways
Profitability & Market Ratios/ Year 2016 2017 2018
Return on Assets 8.58%
10.07
% 14.06%
Return on Equity 31.71%
23.49
% 36.90%
Return on Capital Employed 12.69%
14.99
% 21.64%
Gross Profit Margin 22.09%
23.02
% 23.84%
Net Profit Margin 11.80%
11.48
% 16.06%
Table F: Profitability and Market Ratios of KLM Royal Dutch Airlines
KLM Royal Dutch Airlines
Profitability & Market Ratios/ Year 2016 2017 2018
Return on Assets 6.09% 8.15% 9.54%
Return on Equity
81.48
% 70.52% 56.96%
Return on Capital Employed 9.63% 13.35% 16.41%
Gross Profit Margin
16.36
% 19.79% 19.21%
Net Profit Margin 5.30% 5.55% 5.23%
Interpretation: British Airways and KLM Royal Dutch Airlines have used its assets well in
generating profits for the company as a result the return on assets ratios of both the
5
II. Ratio Analysis
1. Profitability Ratios
Table E: Profitability and Market Ratios of British Airways
British Airways
Profitability & Market Ratios/ Year 2016 2017 2018
Return on Assets 8.58%
10.07
% 14.06%
Return on Equity 31.71%
23.49
% 36.90%
Return on Capital Employed 12.69%
14.99
% 21.64%
Gross Profit Margin 22.09%
23.02
% 23.84%
Net Profit Margin 11.80%
11.48
% 16.06%
Table F: Profitability and Market Ratios of KLM Royal Dutch Airlines
KLM Royal Dutch Airlines
Profitability & Market Ratios/ Year 2016 2017 2018
Return on Assets 6.09% 8.15% 9.54%
Return on Equity
81.48
% 70.52% 56.96%
Return on Capital Employed 9.63% 13.35% 16.41%
Gross Profit Margin
16.36
% 19.79% 19.21%
Net Profit Margin 5.30% 5.55% 5.23%
Interpretation: British Airways and KLM Royal Dutch Airlines have used its assets well in
generating profits for the company as a result the return on assets ratios of both the
5
⊘ This is a preview!⊘
Do you want full access?
Subscribe today to unlock all pages.
Trusted by 1+ million students worldwide
Finance Reporting and Accounting Management
companies have gone up in the last three years. British Airways has utilised the shareholder's
funds effectively to generate profit as a result the return on equity figure has gone up.
However, the case is not the same with KLM Royal Dutch Airlines where the figure of return
on equity has declined. The return on capital employed of both the companies has gone up
over the three years. However, individually British Airways is utilizing its capital
comparatively well. Gross profit margin ratio of British Airways has gone up in the last three
years but the same ratio had declined in case of KLM Royal Dutch Airlines. The industry
average of gross profit ratio had been 8.5%, 7.7% and 6.8% for 2016, 2017 and 2018
respectively. This shows that both the airline companies have performed far better than the
industry average. Net profit margin shows how efficient the company is at converting its
sales into profit. This ratio of British Airways has gone up and over the three years and it
declined for KLM Royal Dutch Airlines. The industry average of net profit margin stood at
4.8%, 5% and 3.9% for 2016, 2017 and 2018 respectively. This depicts that both the airline
companies have converted their sales into profit effectively over their other competitors.
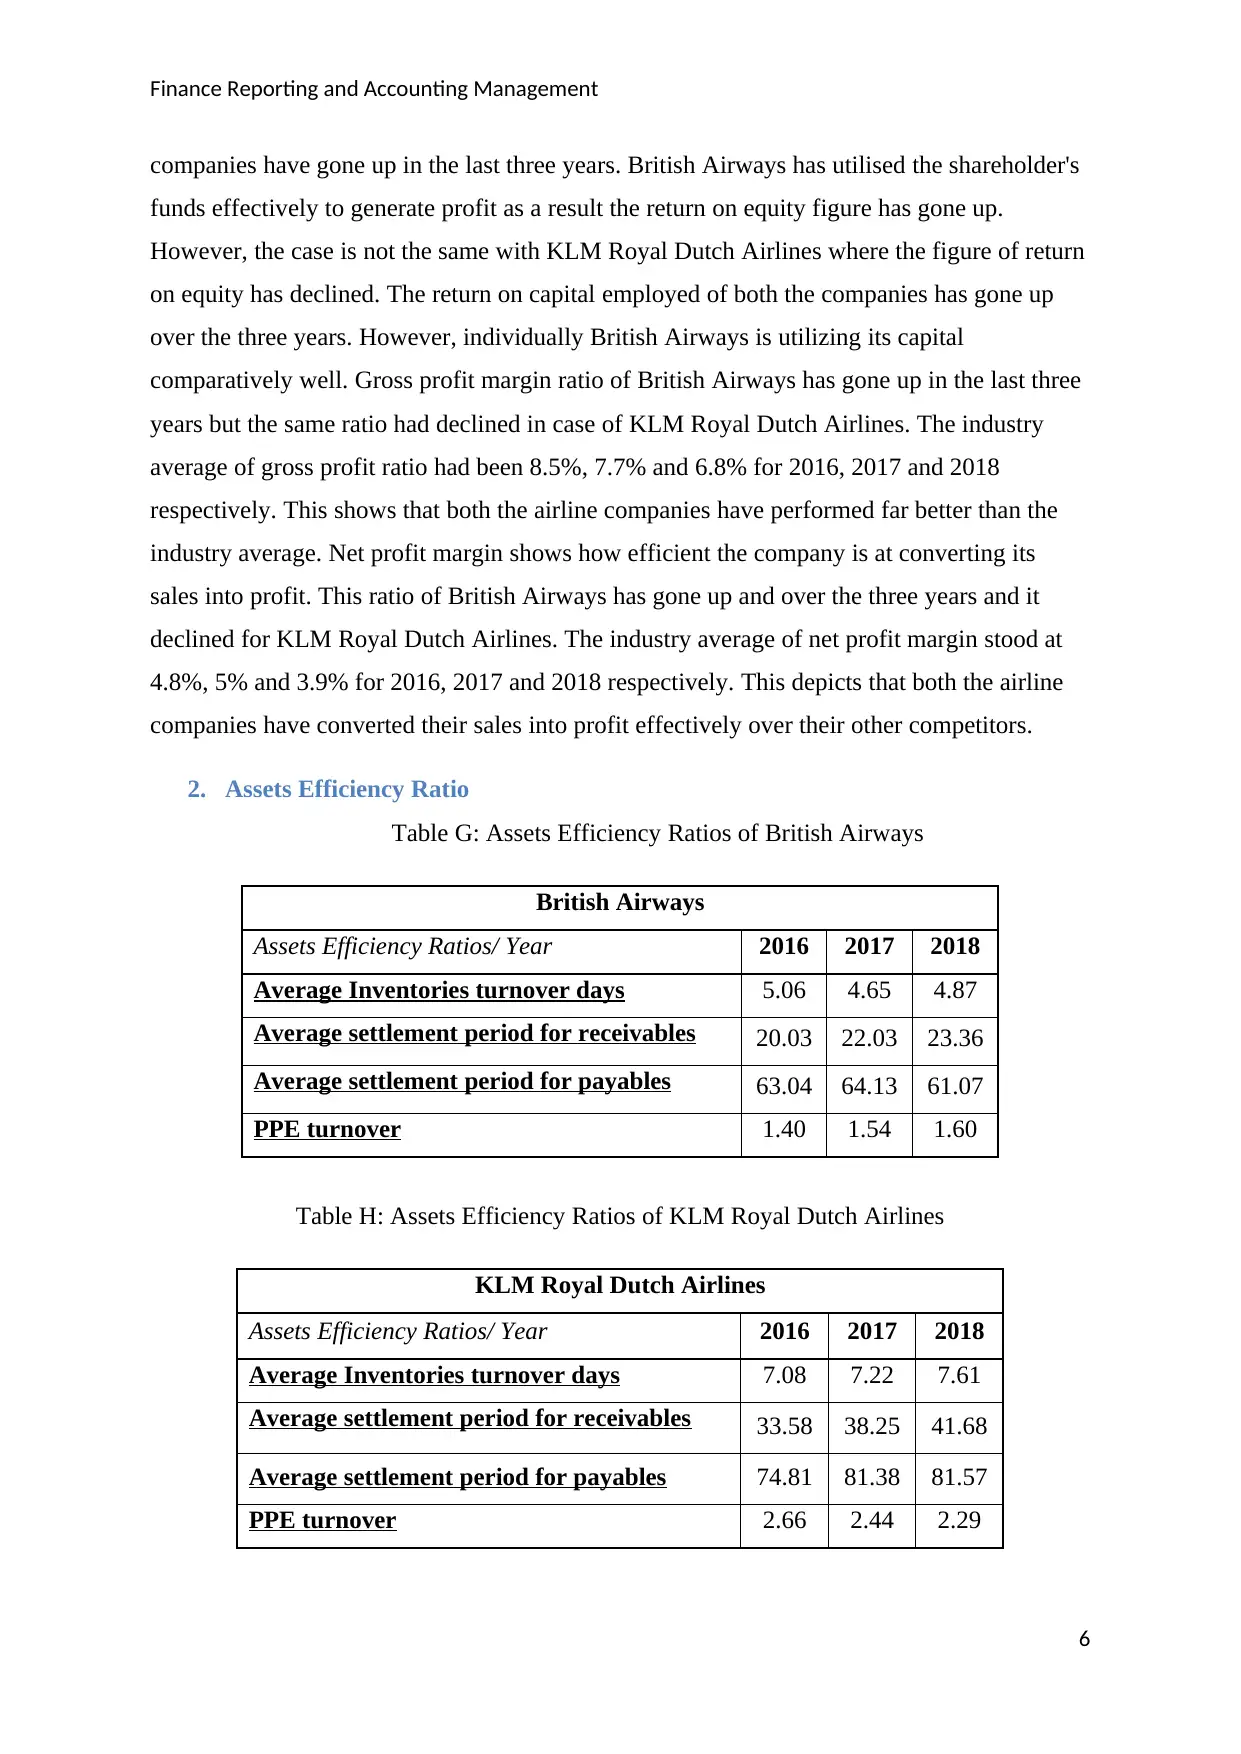
2. Assets Efficiency Ratio
Table G: Assets Efficiency Ratios of British Airways
Table H: Assets Efficiency Ratios of KLM Royal Dutch Airlines
6
British Airways
Assets Efficiency Ratios/ Year 2016 2017 2018
Average Inventories turnover days 5.06 4.65 4.87
Average settlement period for receivables 20.03 22.03 23.36
Average settlement period for payables 63.04 64.13 61.07
PPE turnover 1.40 1.54 1.60
KLM Royal Dutch Airlines
Assets Efficiency Ratios/ Year 2016 2017 2018
Average Inventories turnover days 7.08 7.22 7.61
Average settlement period for receivables 33.58 38.25 41.68
Average settlement period for payables 74.81 81.38 81.57
PPE turnover 2.66 2.44 2.29
companies have gone up in the last three years. British Airways has utilised the shareholder's
funds effectively to generate profit as a result the return on equity figure has gone up.
However, the case is not the same with KLM Royal Dutch Airlines where the figure of return
on equity has declined. The return on capital employed of both the companies has gone up
over the three years. However, individually British Airways is utilizing its capital
comparatively well. Gross profit margin ratio of British Airways has gone up in the last three
years but the same ratio had declined in case of KLM Royal Dutch Airlines. The industry
average of gross profit ratio had been 8.5%, 7.7% and 6.8% for 2016, 2017 and 2018
respectively. This shows that both the airline companies have performed far better than the
industry average. Net profit margin shows how efficient the company is at converting its
sales into profit. This ratio of British Airways has gone up and over the three years and it
declined for KLM Royal Dutch Airlines. The industry average of net profit margin stood at
4.8%, 5% and 3.9% for 2016, 2017 and 2018 respectively. This depicts that both the airline
companies have converted their sales into profit effectively over their other competitors.
2. Assets Efficiency Ratio
Table G: Assets Efficiency Ratios of British Airways
Table H: Assets Efficiency Ratios of KLM Royal Dutch Airlines
6
British Airways
Assets Efficiency Ratios/ Year 2016 2017 2018
Average Inventories turnover days 5.06 4.65 4.87
Average settlement period for receivables 20.03 22.03 23.36
Average settlement period for payables 63.04 64.13 61.07
PPE turnover 1.40 1.54 1.60
KLM Royal Dutch Airlines
Assets Efficiency Ratios/ Year 2016 2017 2018
Average Inventories turnover days 7.08 7.22 7.61
Average settlement period for receivables 33.58 38.25 41.68
Average settlement period for payables 74.81 81.38 81.57
PPE turnover 2.66 2.44 2.29
Paraphrase This Document
Need a fresh take? Get an instant paraphrase of this document with our AI Paraphraser
Finance Reporting and Accounting Management
Interpretation: The average time taken by the British Airways to convert the inventory into
sales has become less over the past three years and these days have gone up in case of KLM
Royal Dutch Airlines. This shows that KLM is inefficient in turning its assets speedily. The
average time taken by the British Airways to collect the cash on accounts or trade receivables
has been nearly between 20-23days in the past three years. However, the time taken by KLM
Royal Dutch Airlines for converting the trade receivables into cash lies between 33- 42days.
This shows that British Airways has a very good credit policy and the sound creditors who
return the borrowed amount timely and KLM Royal Dutch Airlines is having a very poor
credit policy as a result it is taking more than one month to recover the lent amount. Now if
we look at the average number of days taken by both the companies in paying back the
amount on accounts payables, then we would see that British Airways have taken less time in
comparison to KLM Royal Dutch Airlines. The British Airways has also improved in
utilising its property, plant and equipment to generate sales but KLM Royal Dutch has not
improved in utilising its Property, plant and equipment to generate sales.
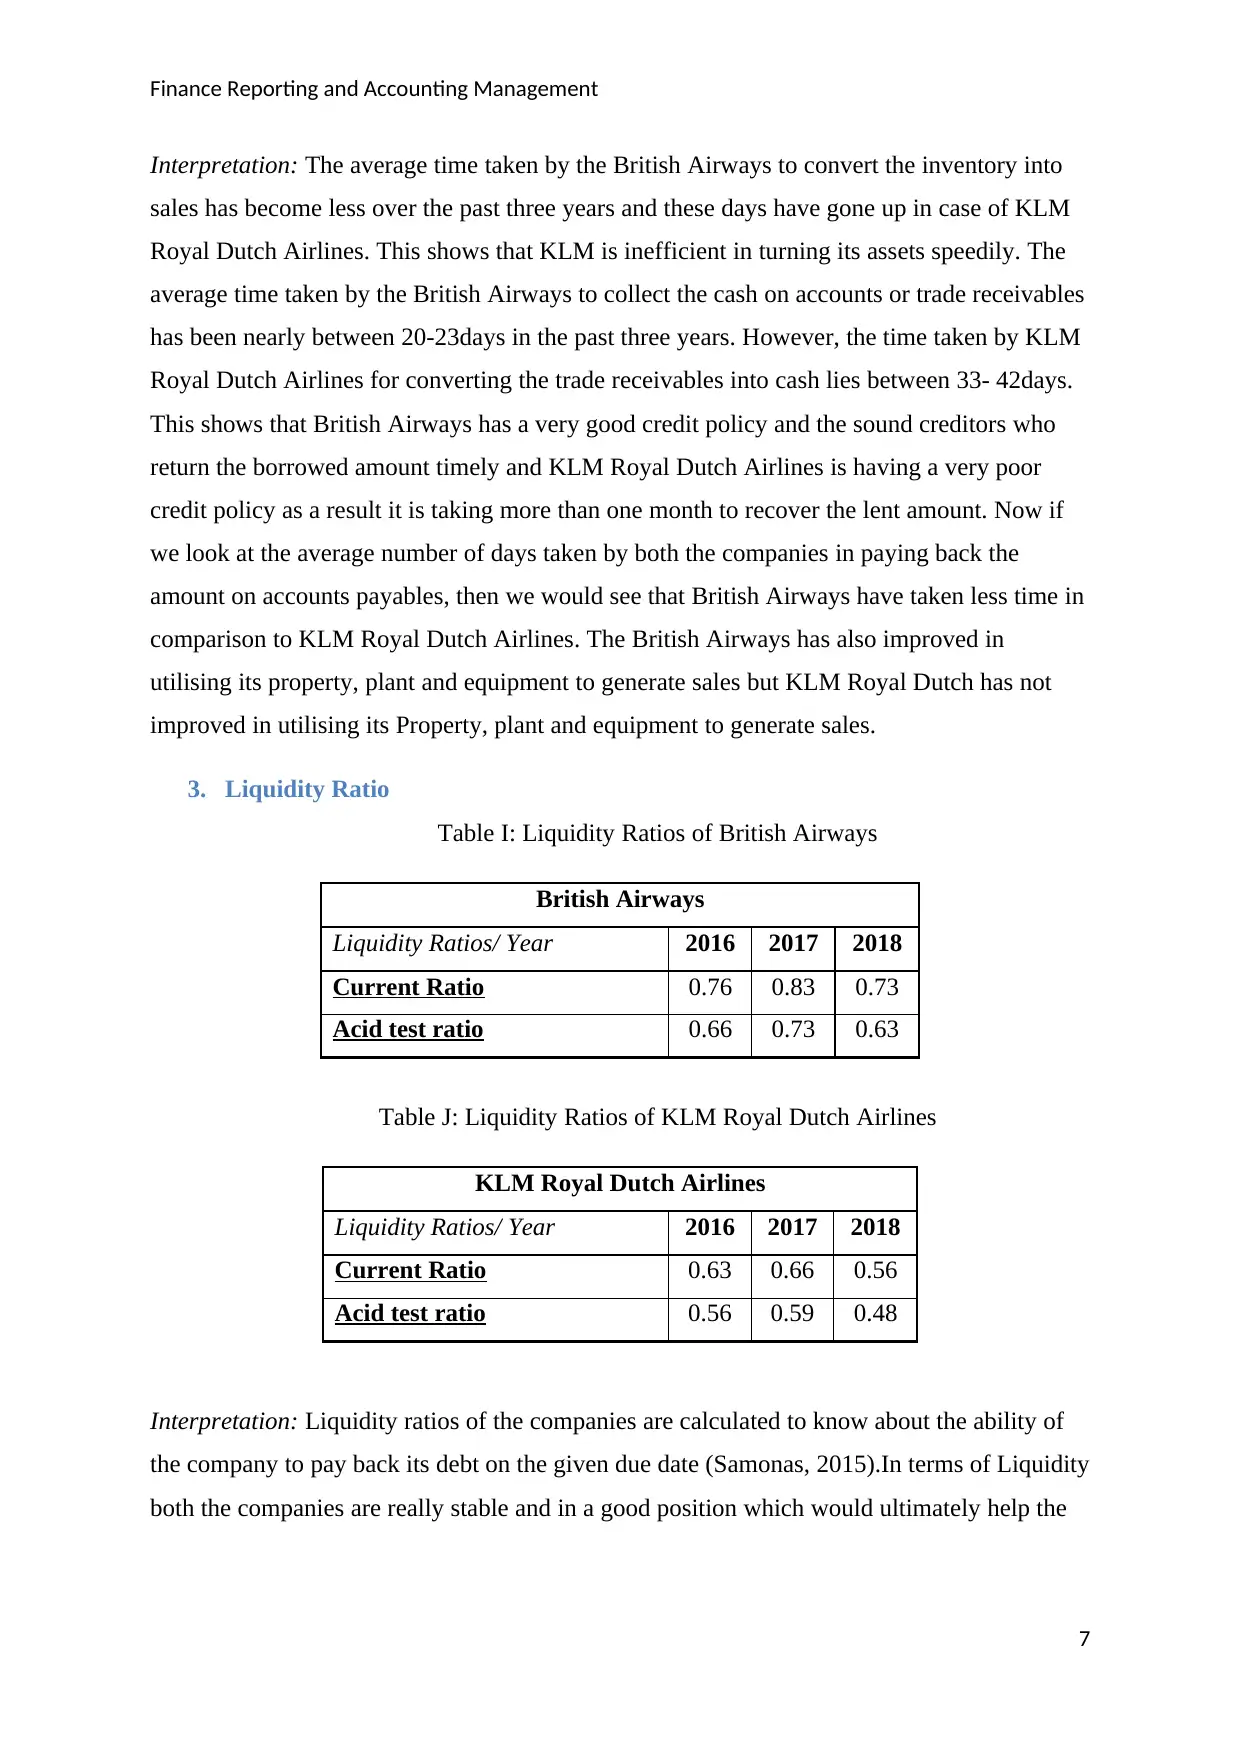
3. Liquidity Ratio
Table I: Liquidity Ratios of British Airways
British Airways
Liquidity Ratios/ Year 2016 2017 2018
Current Ratio 0.76 0.83 0.73
Acid test ratio 0.66 0.73 0.63
Table J: Liquidity Ratios of KLM Royal Dutch Airlines
KLM Royal Dutch Airlines
Liquidity Ratios/ Year 2016 2017 2018
Current Ratio 0.63 0.66 0.56
Acid test ratio 0.56 0.59 0.48
Interpretation: Liquidity ratios of the companies are calculated to know about the ability of
the company to pay back its debt on the given due date (Samonas, 2015).In terms of Liquidity
both the companies are really stable and in a good position which would ultimately help the
7
Interpretation: The average time taken by the British Airways to convert the inventory into
sales has become less over the past three years and these days have gone up in case of KLM
Royal Dutch Airlines. This shows that KLM is inefficient in turning its assets speedily. The
average time taken by the British Airways to collect the cash on accounts or trade receivables
has been nearly between 20-23days in the past three years. However, the time taken by KLM
Royal Dutch Airlines for converting the trade receivables into cash lies between 33- 42days.
This shows that British Airways has a very good credit policy and the sound creditors who
return the borrowed amount timely and KLM Royal Dutch Airlines is having a very poor
credit policy as a result it is taking more than one month to recover the lent amount. Now if
we look at the average number of days taken by both the companies in paying back the
amount on accounts payables, then we would see that British Airways have taken less time in
comparison to KLM Royal Dutch Airlines. The British Airways has also improved in
utilising its property, plant and equipment to generate sales but KLM Royal Dutch has not
improved in utilising its Property, plant and equipment to generate sales.
3. Liquidity Ratio
Table I: Liquidity Ratios of British Airways
British Airways
Liquidity Ratios/ Year 2016 2017 2018
Current Ratio 0.76 0.83 0.73
Acid test ratio 0.66 0.73 0.63
Table J: Liquidity Ratios of KLM Royal Dutch Airlines
KLM Royal Dutch Airlines
Liquidity Ratios/ Year 2016 2017 2018
Current Ratio 0.63 0.66 0.56
Acid test ratio 0.56 0.59 0.48
Interpretation: Liquidity ratios of the companies are calculated to know about the ability of
the company to pay back its debt on the given due date (Samonas, 2015).In terms of Liquidity
both the companies are really stable and in a good position which would ultimately help the
7
Finance Reporting and Accounting Management
company in meeting its working capital requirements without any difficulty. Comparatively,
British Airways is more liquid than KLM Royal Dutch Airlines.
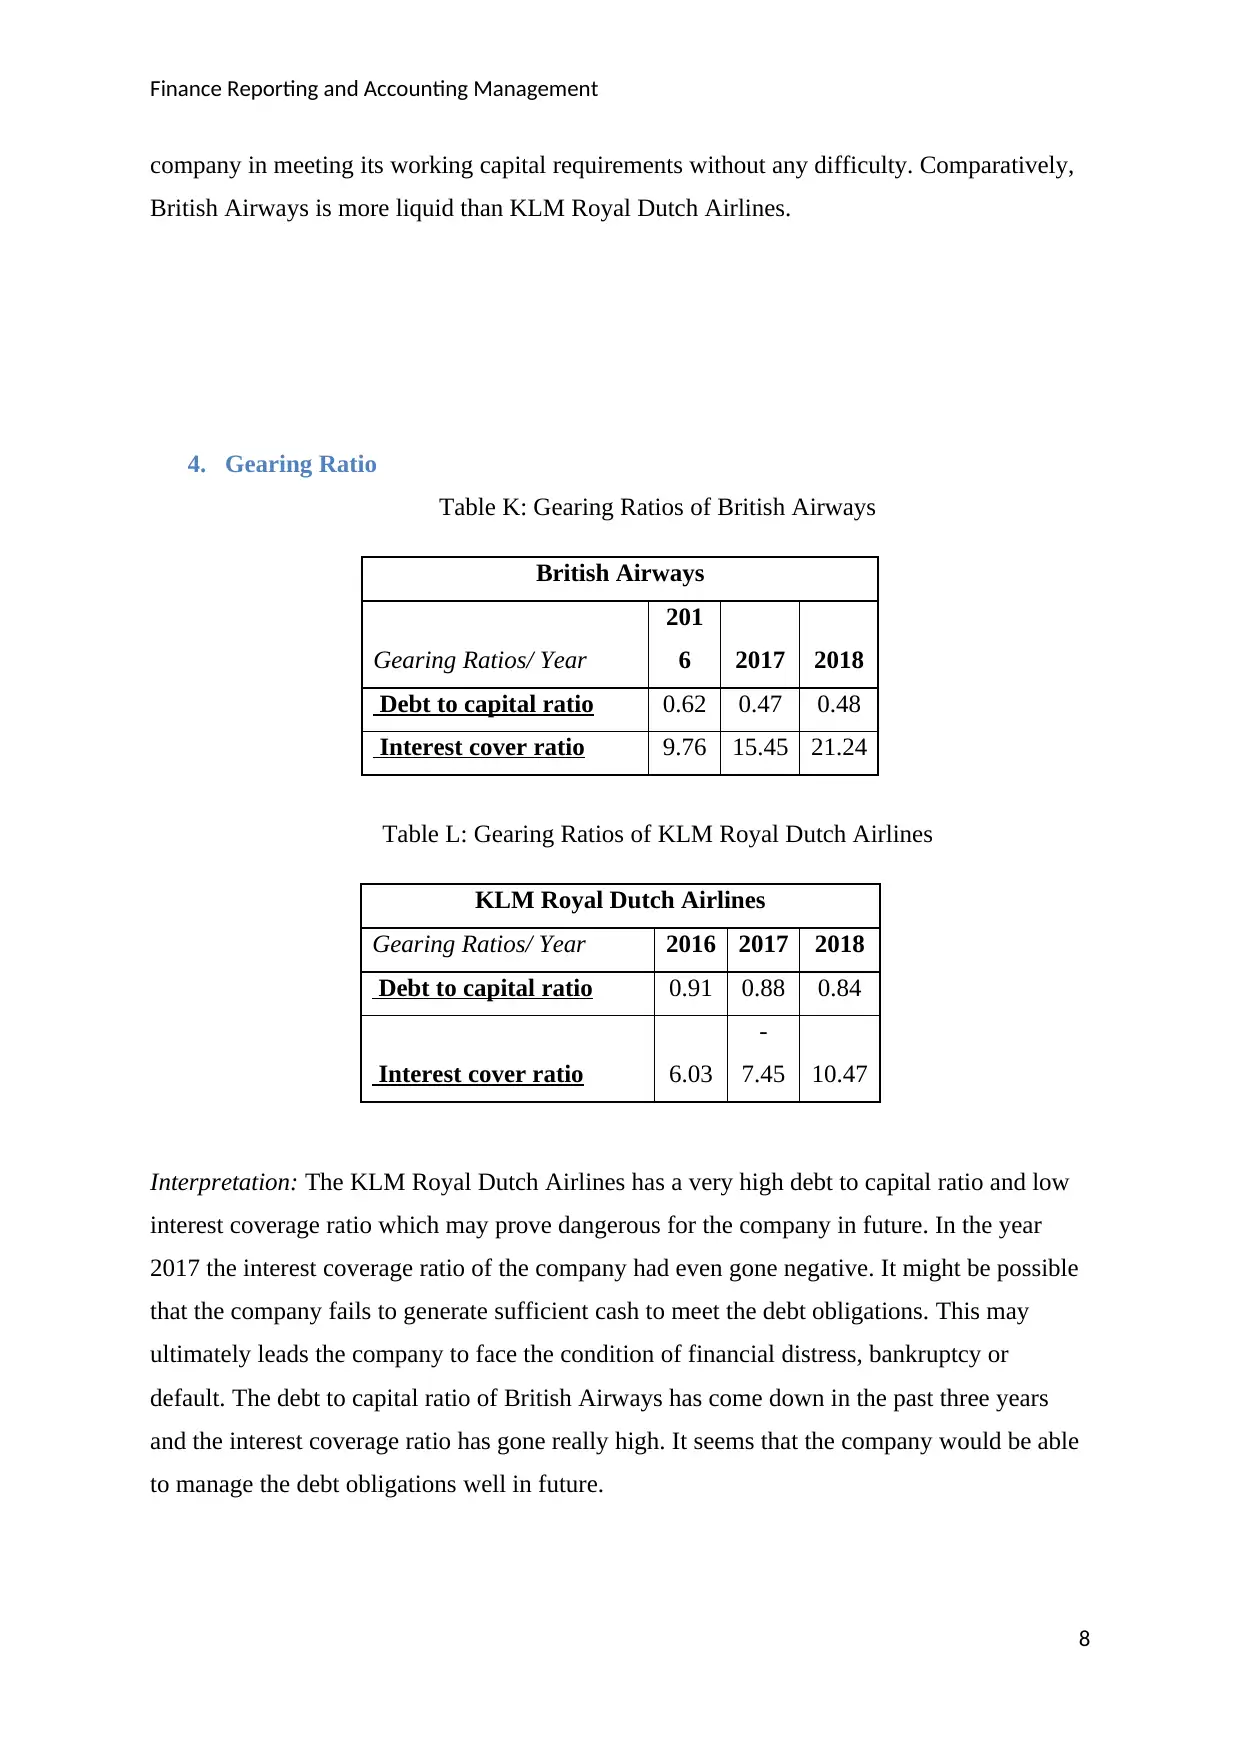
4. Gearing Ratio
Table K: Gearing Ratios of British Airways
British Airways
Gearing Ratios/ Year
201
6 2017 2018
Debt to capital ratio 0.62 0.47 0.48
Interest cover ratio 9.76 15.45 21.24
Table L: Gearing Ratios of KLM Royal Dutch Airlines
KLM Royal Dutch Airlines
Gearing Ratios/ Year 2016 2017 2018
Debt to capital ratio 0.91 0.88 0.84
Interest cover ratio 6.03
-
7.45 10.47
Interpretation: The KLM Royal Dutch Airlines has a very high debt to capital ratio and low
interest coverage ratio which may prove dangerous for the company in future. In the year
2017 the interest coverage ratio of the company had even gone negative. It might be possible
that the company fails to generate sufficient cash to meet the debt obligations. This may
ultimately leads the company to face the condition of financial distress, bankruptcy or
default. The debt to capital ratio of British Airways has come down in the past three years
and the interest coverage ratio has gone really high. It seems that the company would be able
to manage the debt obligations well in future.
8
company in meeting its working capital requirements without any difficulty. Comparatively,
British Airways is more liquid than KLM Royal Dutch Airlines.
4. Gearing Ratio
Table K: Gearing Ratios of British Airways
British Airways
Gearing Ratios/ Year
201
6 2017 2018
Debt to capital ratio 0.62 0.47 0.48
Interest cover ratio 9.76 15.45 21.24
Table L: Gearing Ratios of KLM Royal Dutch Airlines
KLM Royal Dutch Airlines
Gearing Ratios/ Year 2016 2017 2018
Debt to capital ratio 0.91 0.88 0.84
Interest cover ratio 6.03
-
7.45 10.47
Interpretation: The KLM Royal Dutch Airlines has a very high debt to capital ratio and low
interest coverage ratio which may prove dangerous for the company in future. In the year
2017 the interest coverage ratio of the company had even gone negative. It might be possible
that the company fails to generate sufficient cash to meet the debt obligations. This may
ultimately leads the company to face the condition of financial distress, bankruptcy or
default. The debt to capital ratio of British Airways has come down in the past three years
and the interest coverage ratio has gone really high. It seems that the company would be able
to manage the debt obligations well in future.
8
⊘ This is a preview!⊘
Do you want full access?
Subscribe today to unlock all pages.
Trusted by 1+ million students worldwide
Finance Reporting and Accounting Management
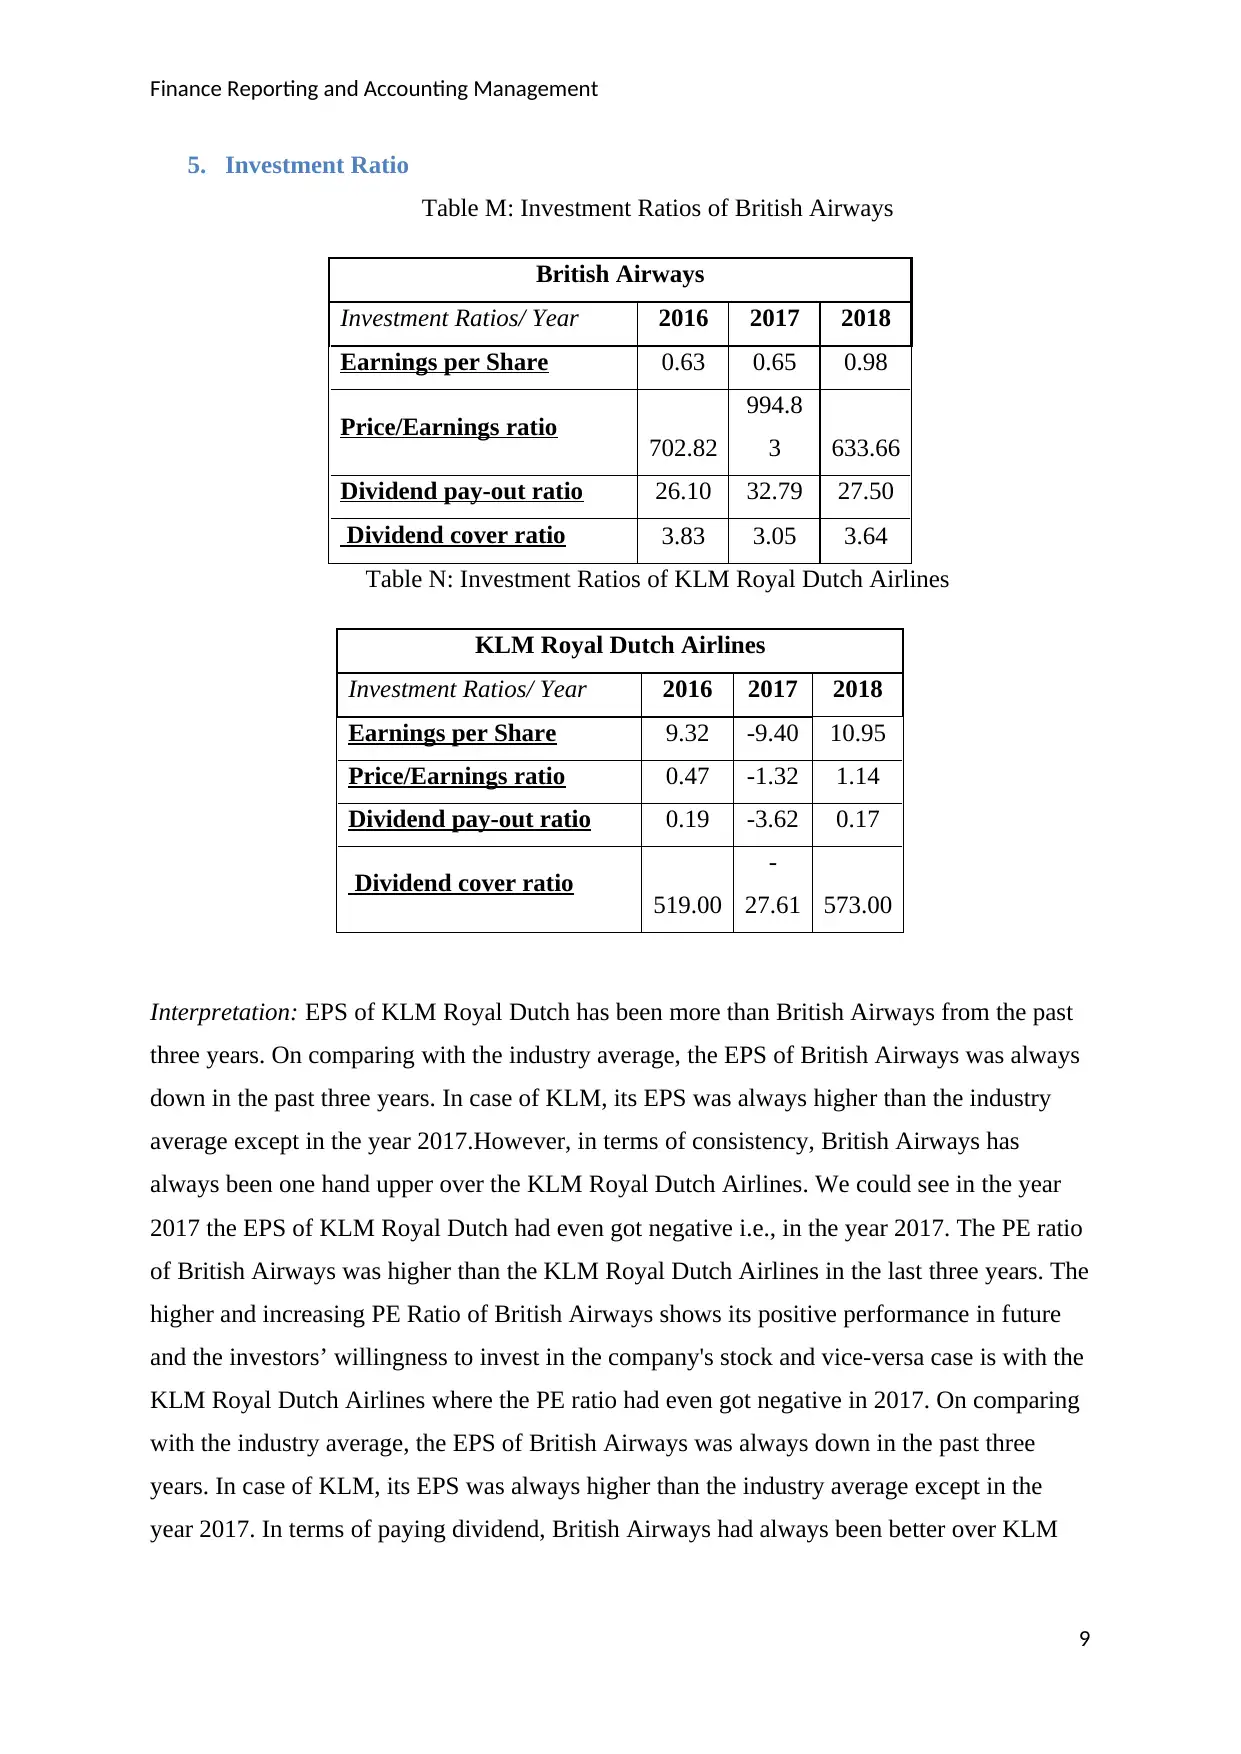
5. Investment Ratio
Table M: Investment Ratios of British Airways
British Airways
Investment Ratios/ Year 2016 2017 2018
Earnings per Share 0.63 0.65 0.98
Price/Earnings ratio 702.82
994.8
3 633.66
Dividend pay-out ratio 26.10 32.79 27.50
Dividend cover ratio 3.83 3.05 3.64
Table N: Investment Ratios of KLM Royal Dutch Airlines
KLM Royal Dutch Airlines
Investment Ratios/ Year 2016 2017 2018
Earnings per Share 9.32 -9.40 10.95
Price/Earnings ratio 0.47 -1.32 1.14
Dividend pay-out ratio 0.19 -3.62 0.17
Dividend cover ratio 519.00
-
27.61 573.00
Interpretation: EPS of KLM Royal Dutch has been more than British Airways from the past
three years. On comparing with the industry average, the EPS of British Airways was always
down in the past three years. In case of KLM, its EPS was always higher than the industry
average except in the year 2017.However, in terms of consistency, British Airways has
always been one hand upper over the KLM Royal Dutch Airlines. We could see in the year
2017 the EPS of KLM Royal Dutch had even got negative i.e., in the year 2017. The PE ratio
of British Airways was higher than the KLM Royal Dutch Airlines in the last three years. The
higher and increasing PE Ratio of British Airways shows its positive performance in future
and the investors’ willingness to invest in the company's stock and vice-versa case is with the
KLM Royal Dutch Airlines where the PE ratio had even got negative in 2017. On comparing
with the industry average, the EPS of British Airways was always down in the past three
years. In case of KLM, its EPS was always higher than the industry average except in the
year 2017. In terms of paying dividend, British Airways had always been better over KLM
9
Paraphrase This Document
Need a fresh take? Get an instant paraphrase of this document with our AI Paraphraser
Finance Reporting and Accounting Management
Royal Dutch Airlines. The low dividend pay-out ratio of British Airways shows that the
company had paid a large amount of company's total earnings towards the dividend payment.
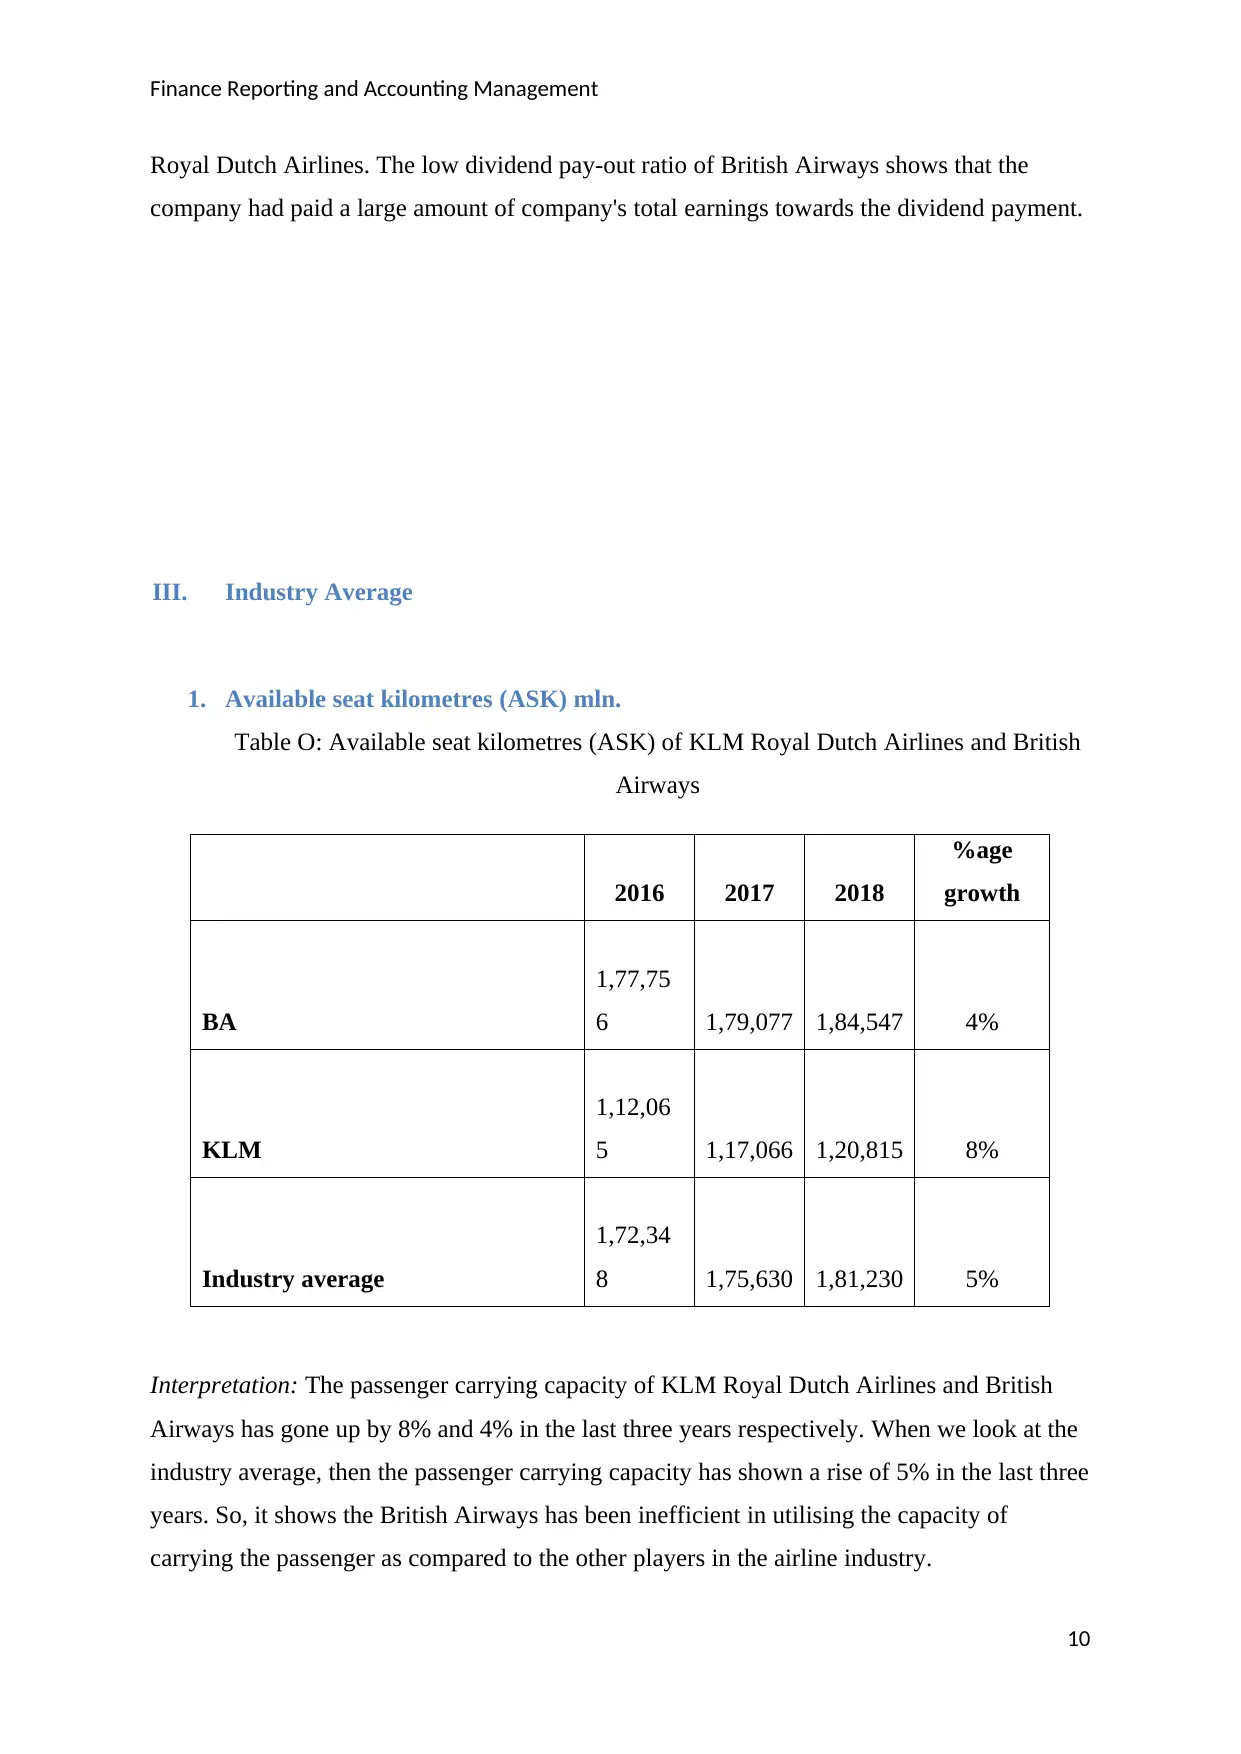
III. Industry Average
1. Available seat kilometres (ASK) mln.
Table O: Available seat kilometres (ASK) of KLM Royal Dutch Airlines and British
Airways
2016 2017 2018
%age
growth
BA
1,77,75
6 1,79,077 1,84,547 4%
KLM
1,12,06
5 1,17,066 1,20,815 8%
Industry average
1,72,34
8 1,75,630 1,81,230 5%
Interpretation: The passenger carrying capacity of KLM Royal Dutch Airlines and British
Airways has gone up by 8% and 4% in the last three years respectively. When we look at the
industry average, then the passenger carrying capacity has shown a rise of 5% in the last three
years. So, it shows the British Airways has been inefficient in utilising the capacity of
carrying the passenger as compared to the other players in the airline industry.
10
Royal Dutch Airlines. The low dividend pay-out ratio of British Airways shows that the
company had paid a large amount of company's total earnings towards the dividend payment.
III. Industry Average
1. Available seat kilometres (ASK) mln.
Table O: Available seat kilometres (ASK) of KLM Royal Dutch Airlines and British
Airways
2016 2017 2018
%age
growth
BA
1,77,75
6 1,79,077 1,84,547 4%
KLM
1,12,06
5 1,17,066 1,20,815 8%
Industry average
1,72,34
8 1,75,630 1,81,230 5%
Interpretation: The passenger carrying capacity of KLM Royal Dutch Airlines and British
Airways has gone up by 8% and 4% in the last three years respectively. When we look at the
industry average, then the passenger carrying capacity has shown a rise of 5% in the last three
years. So, it shows the British Airways has been inefficient in utilising the capacity of
carrying the passenger as compared to the other players in the airline industry.
10
Finance Reporting and Accounting Management
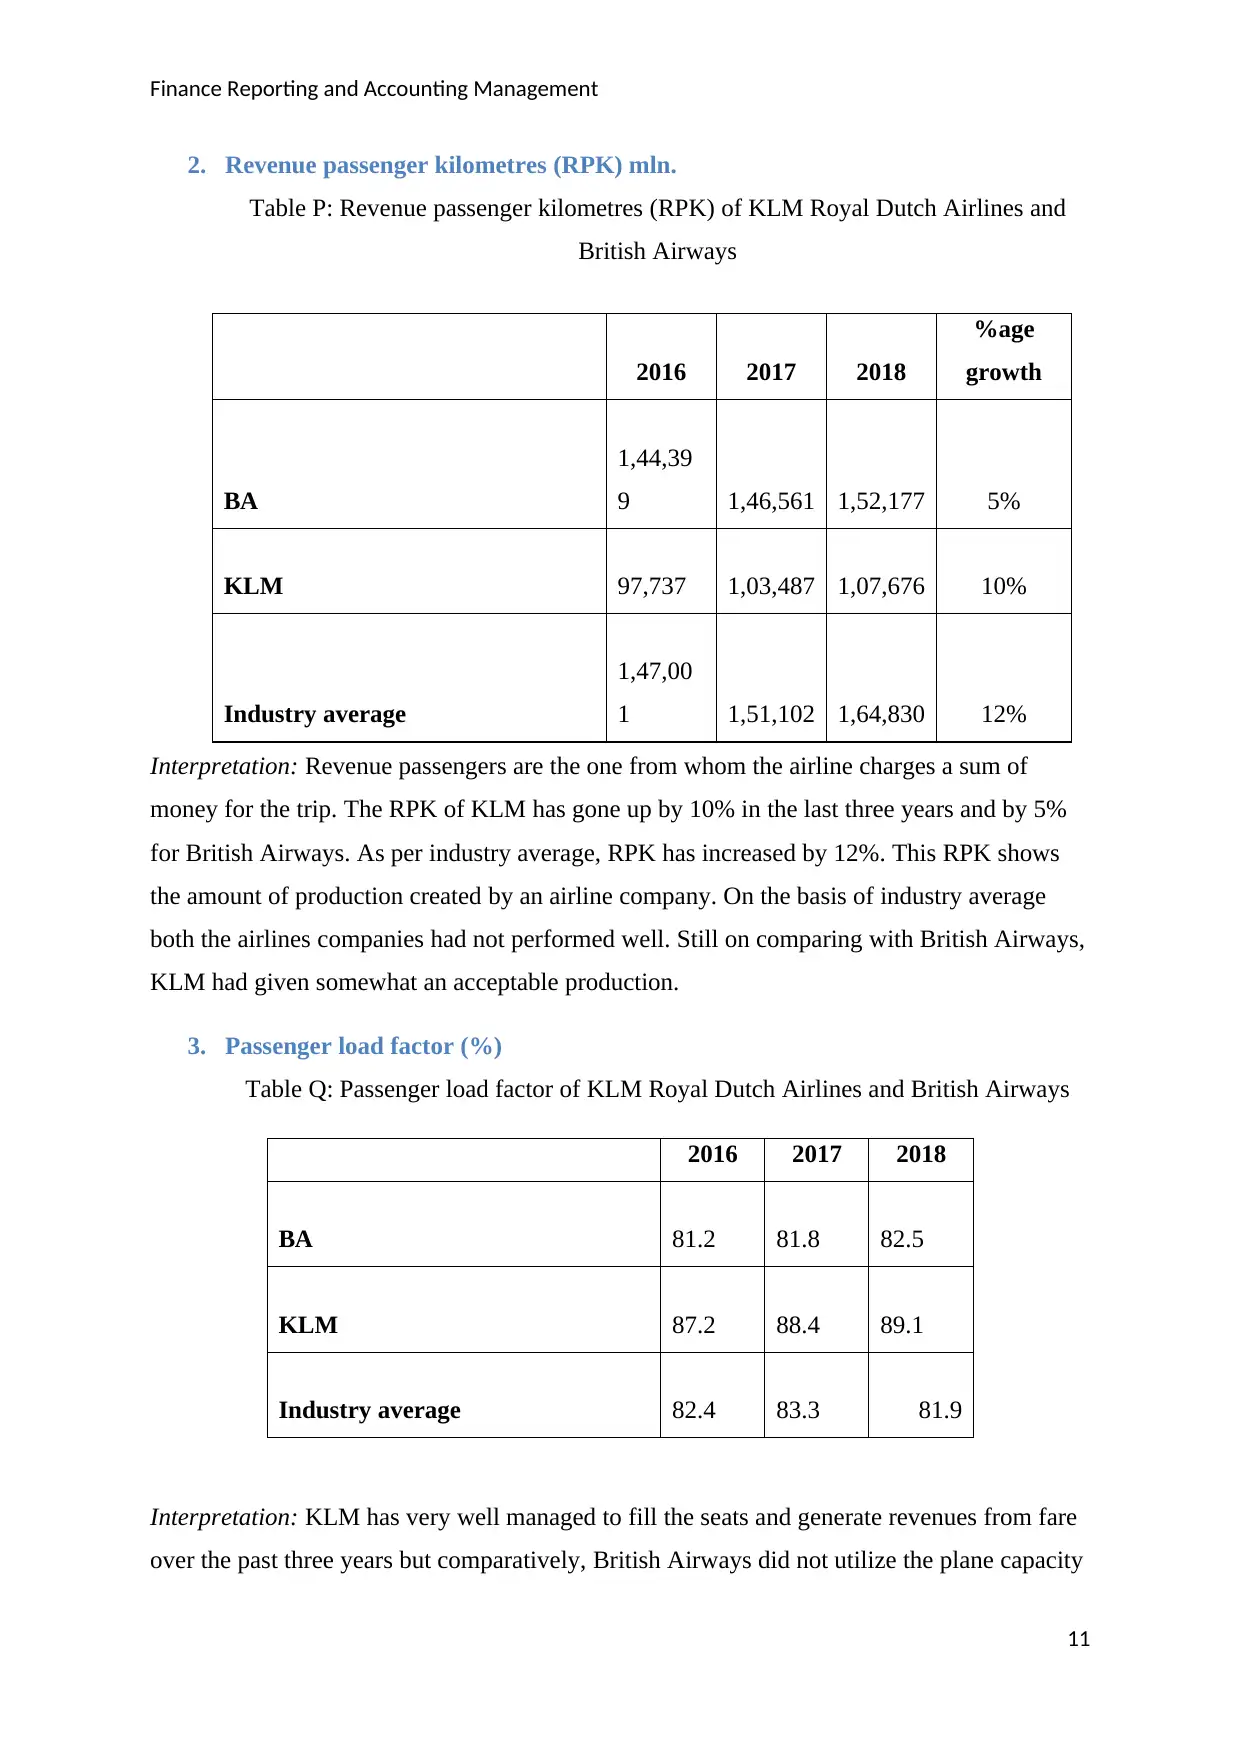
2. Revenue passenger kilometres (RPK) mln.
Table P: Revenue passenger kilometres (RPK) of KLM Royal Dutch Airlines and
British Airways
Interpretation: Revenue passengers are the one from whom the airline charges a sum of
money for the trip. The RPK of KLM has gone up by 10% in the last three years and by 5%
for British Airways. As per industry average, RPK has increased by 12%. This RPK shows
the amount of production created by an airline company. On the basis of industry average
both the airlines companies had not performed well. Still on comparing with British Airways,
KLM had given somewhat an acceptable production.
3. Passenger load factor (%)
Table Q: Passenger load factor of KLM Royal Dutch Airlines and British Airways
2016 2017 2018
BA 81.2 81.8 82.5
KLM 87.2 88.4 89.1
Industry average 82.4 83.3 81.9
Interpretation: KLM has very well managed to fill the seats and generate revenues from fare
over the past three years but comparatively, British Airways did not utilize the plane capacity
11
2016 2017 2018
%age
growth
BA
1,44,39
9 1,46,561 1,52,177 5%
KLM 97,737 1,03,487 1,07,676 10%
Industry average
1,47,00
1 1,51,102 1,64,830 12%
⊘ This is a preview!⊘
Do you want full access?
Subscribe today to unlock all pages.
Trusted by 1+ million students worldwide
1 out of 18
Related Documents


Your All-in-One AI-Powered Toolkit for Academic Success.
+13062052269
info@desklib.com
Available 24*7 on WhatsApp / Email
![[object Object]](/_next/static/media/star-bottom.7253800d.svg)
Unlock your academic potential
Copyright © 2020–2026 A2Z Services. All Rights Reserved. Developed and managed by ZUCOL.