Financial Performance Analysis of British American Tobacco: Report
VerifiedAdded on 2023/01/19
|21
|4353
|91
Report
AI Summary
This project report provides a financial analysis of British American Tobacco (BAT) using ratio analysis. It examines liquidity ratios (current and quick ratios) and profitability ratios (gross profit, net profit, operating profit, and return on capital employed) for 2017 and 2018. The analysis reveals a decreasing liquidity position in 2018 compared to 2017, as evidenced by the current and quick ratios. The report also indicates an increasing gross profit ratio in 2018, suggesting improved efficiency in generating profit from sales, while the net profit ratio decreased, possibly due to reduced net profit. Furthermore, the operating profit ratio increased, indicating better operational profit generation. The report concludes with key findings and recommendations to enhance the company's performance. This report is a valuable resource for students seeking insights into financial statement analysis and ratio interpretation, available on Desklib.

Accounting and finance
analysis of a listed
company
analysis of a listed
company
Paraphrase This Document
Need a fresh take? Get an instant paraphrase of this document with our AI Paraphraser
Table of Contents
EXECUTIVE SUMMARY.............................................................................................................3
MAIN BODY...................................................................................................................................3
SUMMARY AND CONCLUSION..............................................................................................18
REFERENCES..............................................................................................................................20
EXECUTIVE SUMMARY
The project report summarise about role of ratio analysis in order to make better analysis
of financial performance. Under the report, vital range of ratios are calculated and interpreted in
order to assess performance of chosen business entity listed in London stock exchange. As well
as further part of report abstracts about key findings and recommendations for company in order
to enhance the performance.
MAIN BODY
Ratio analysis- In this competitive environment, there are number of techniques that are used by
business entities in order to analyse monetary performance in an effective manner. The ratio
analysis technique is one of them. It can be defined as a kinds of approach in that wide number
of ratios are calculated and analysed in order to take crucial decision in a better way (Uchide and
Imanishi, 2016). By help of proper ratio analysis, it becomes easier for companies to get aware
about which aspects are needed to be improve and which aspects are strong. Under this
technique, the key ratios are profitability ratio, liquidity ratio and many more. Basically, in order
to analyse the financial performance of companies two years consecutive years ratios are
calculated and compared in a detailed manner. Herein, below the importance of ratio analysis
technique is demonstrated in such manner that is as follows:
This type of analysis is beneficial in order to make proper financial analysis.
In addition, the ratio analysis play a significant role in order to judge monetary soundness
of a business entity.
Another key benefit of ratio analysis is that it is useful for companies for making analysis
of operational efficiency of enterprises.
The ratio analysis makes enable to identifying the risk of business firms.
So these are some key benefits of ratio analysis technique for companies. In the aspect of this
project report a company has been chosen that is listed in London stock exchange. The name of
company is British American Tobacco which operates in manufacturing of tobacco products.
Overview of company- The British American Tobacco is a British multinational cigarette and
tobacco manufacturing company. Its headquarter is in London, United Kingdom. As per the
⊘ This is a preview!⊘
Do you want full access?
Subscribe today to unlock all pages.
Trusted by 1+ million students worldwide
financial report of year 2012, this company was world's second largest cigarette manufacturer.
The company operates in more then 180 nations all around the world. The company was founded
by Imperial brands and James Buchanan Duke (About British American Tobacco plc, 2019). As
per the financial information of year 2018, there were more then 55000 employees in different
branches of this company. Apart from it, some key information about this company are
mentioned below in such manner:
Stock price – 3009.50 GBX (+28.50, +0.96%) as on 25th of November, 2019.
Revenues- £2449.2 crores GBP as per financial year 2018.
Chief executive officer- Jack Bowles.
Types of ratios:
1. Liquidity ratio- This can be defined as a kinds of ratio in that defines about businesses'
efficiency in order to meet obligations when they become due (Lakshmi, Martin and Venkatesan,
2015). In broad manner, this is a type of ratio which assess business entities capability in order to
define whether they are able to make payment of short term debts or not. In the aspect of above
chosen company, British American Tobacco their accountant computes this ratio with an aim of
determining efficiency of paying short term debts. There are mainly two types of liquidity ratios
that are mentioned below in such manner:
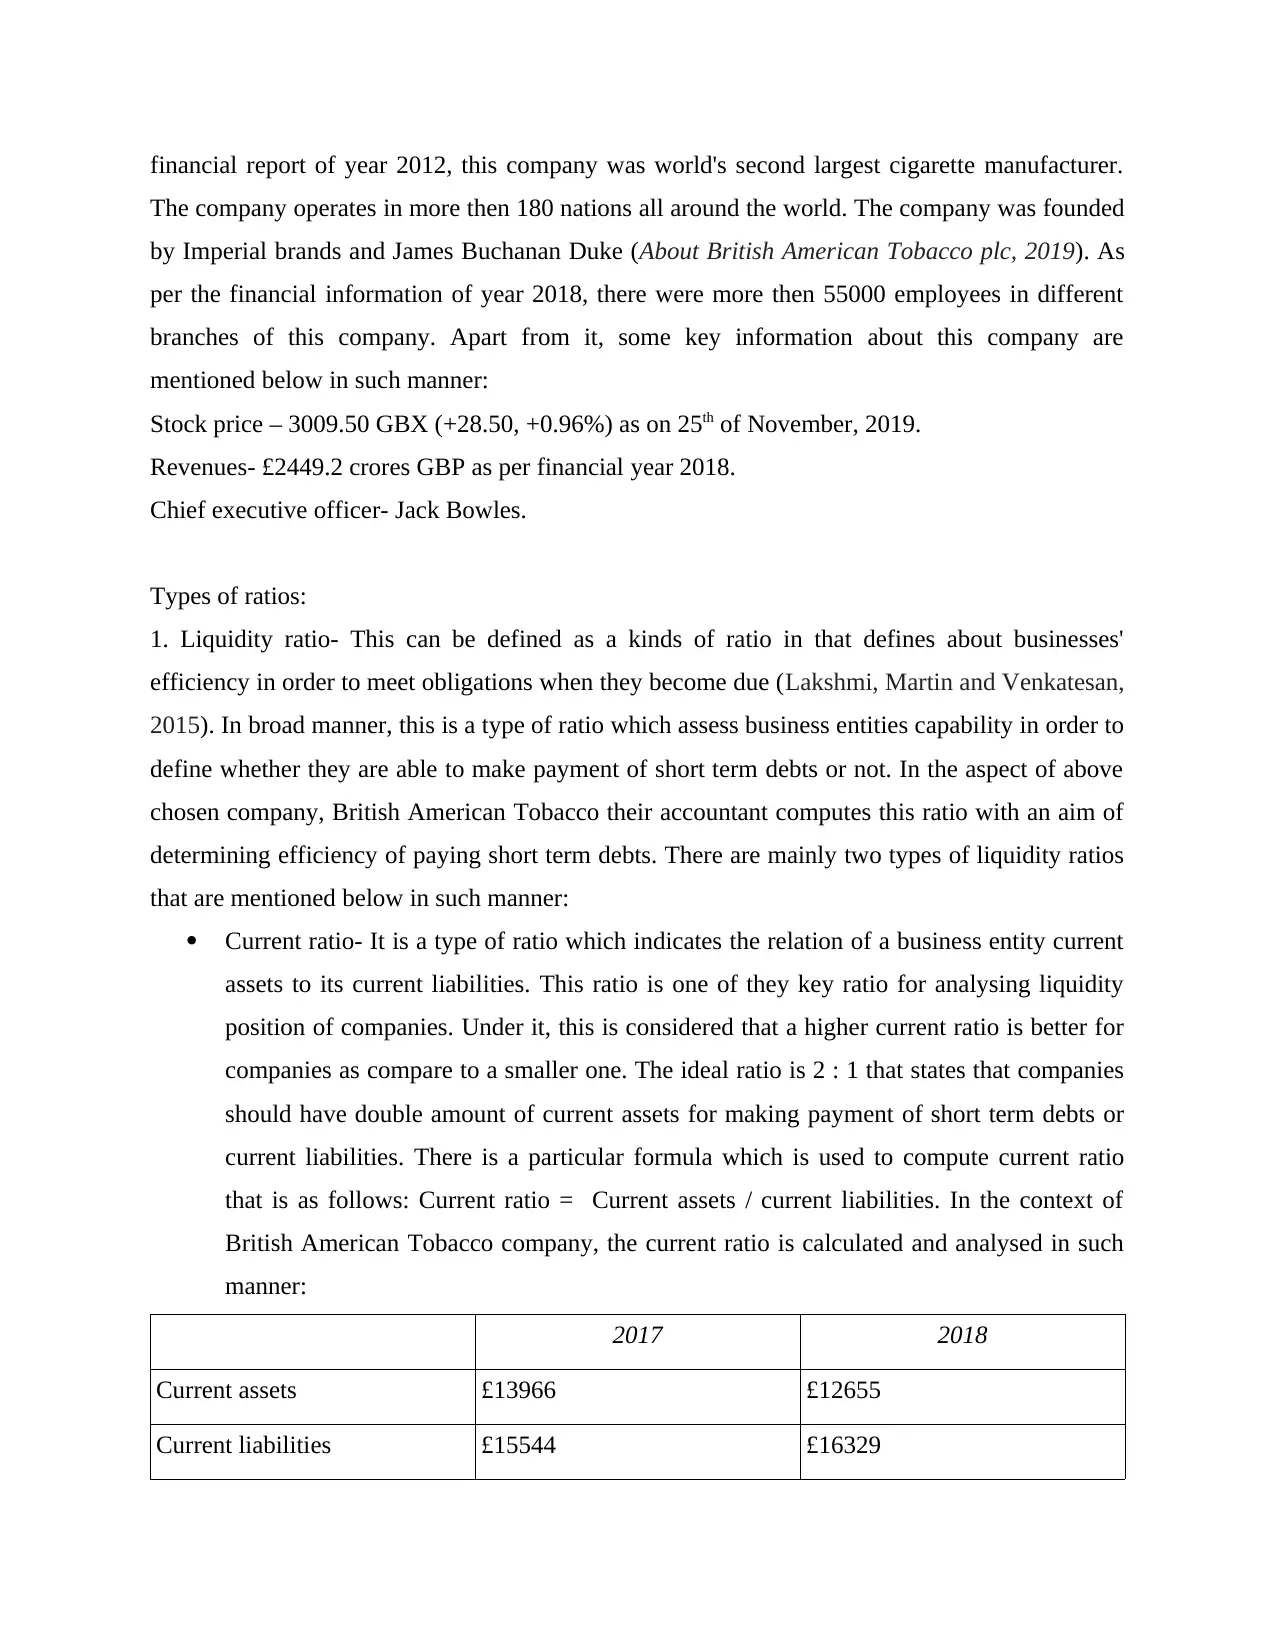
Current ratio- It is a type of ratio which indicates the relation of a business entity current
assets to its current liabilities. This ratio is one of they key ratio for analysing liquidity
position of companies. Under it, this is considered that a higher current ratio is better for
companies as compare to a smaller one. The ideal ratio is 2 : 1 that states that companies
should have double amount of current assets for making payment of short term debts or
current liabilities. There is a particular formula which is used to compute current ratio
that is as follows: Current ratio = Current assets / current liabilities. In the context of
British American Tobacco company, the current ratio is calculated and analysed in such
manner:
2017 2018
Current assets £13966 £12655
Current liabilities £15544 £16329
The company operates in more then 180 nations all around the world. The company was founded
by Imperial brands and James Buchanan Duke (About British American Tobacco plc, 2019). As
per the financial information of year 2018, there were more then 55000 employees in different
branches of this company. Apart from it, some key information about this company are
mentioned below in such manner:
Stock price – 3009.50 GBX (+28.50, +0.96%) as on 25th of November, 2019.
Revenues- £2449.2 crores GBP as per financial year 2018.
Chief executive officer- Jack Bowles.
Types of ratios:
1. Liquidity ratio- This can be defined as a kinds of ratio in that defines about businesses'
efficiency in order to meet obligations when they become due (Lakshmi, Martin and Venkatesan,
2015). In broad manner, this is a type of ratio which assess business entities capability in order to
define whether they are able to make payment of short term debts or not. In the aspect of above
chosen company, British American Tobacco their accountant computes this ratio with an aim of
determining efficiency of paying short term debts. There are mainly two types of liquidity ratios
that are mentioned below in such manner:
Current ratio- It is a type of ratio which indicates the relation of a business entity current
assets to its current liabilities. This ratio is one of they key ratio for analysing liquidity
position of companies. Under it, this is considered that a higher current ratio is better for
companies as compare to a smaller one. The ideal ratio is 2 : 1 that states that companies
should have double amount of current assets for making payment of short term debts or
current liabilities. There is a particular formula which is used to compute current ratio
that is as follows: Current ratio = Current assets / current liabilities. In the context of
British American Tobacco company, the current ratio is calculated and analysed in such
manner:
2017 2018
Current assets £13966 £12655
Current liabilities £15544 £16329
Paraphrase This Document
Need a fresh take? Get an instant paraphrase of this document with our AI Paraphraser
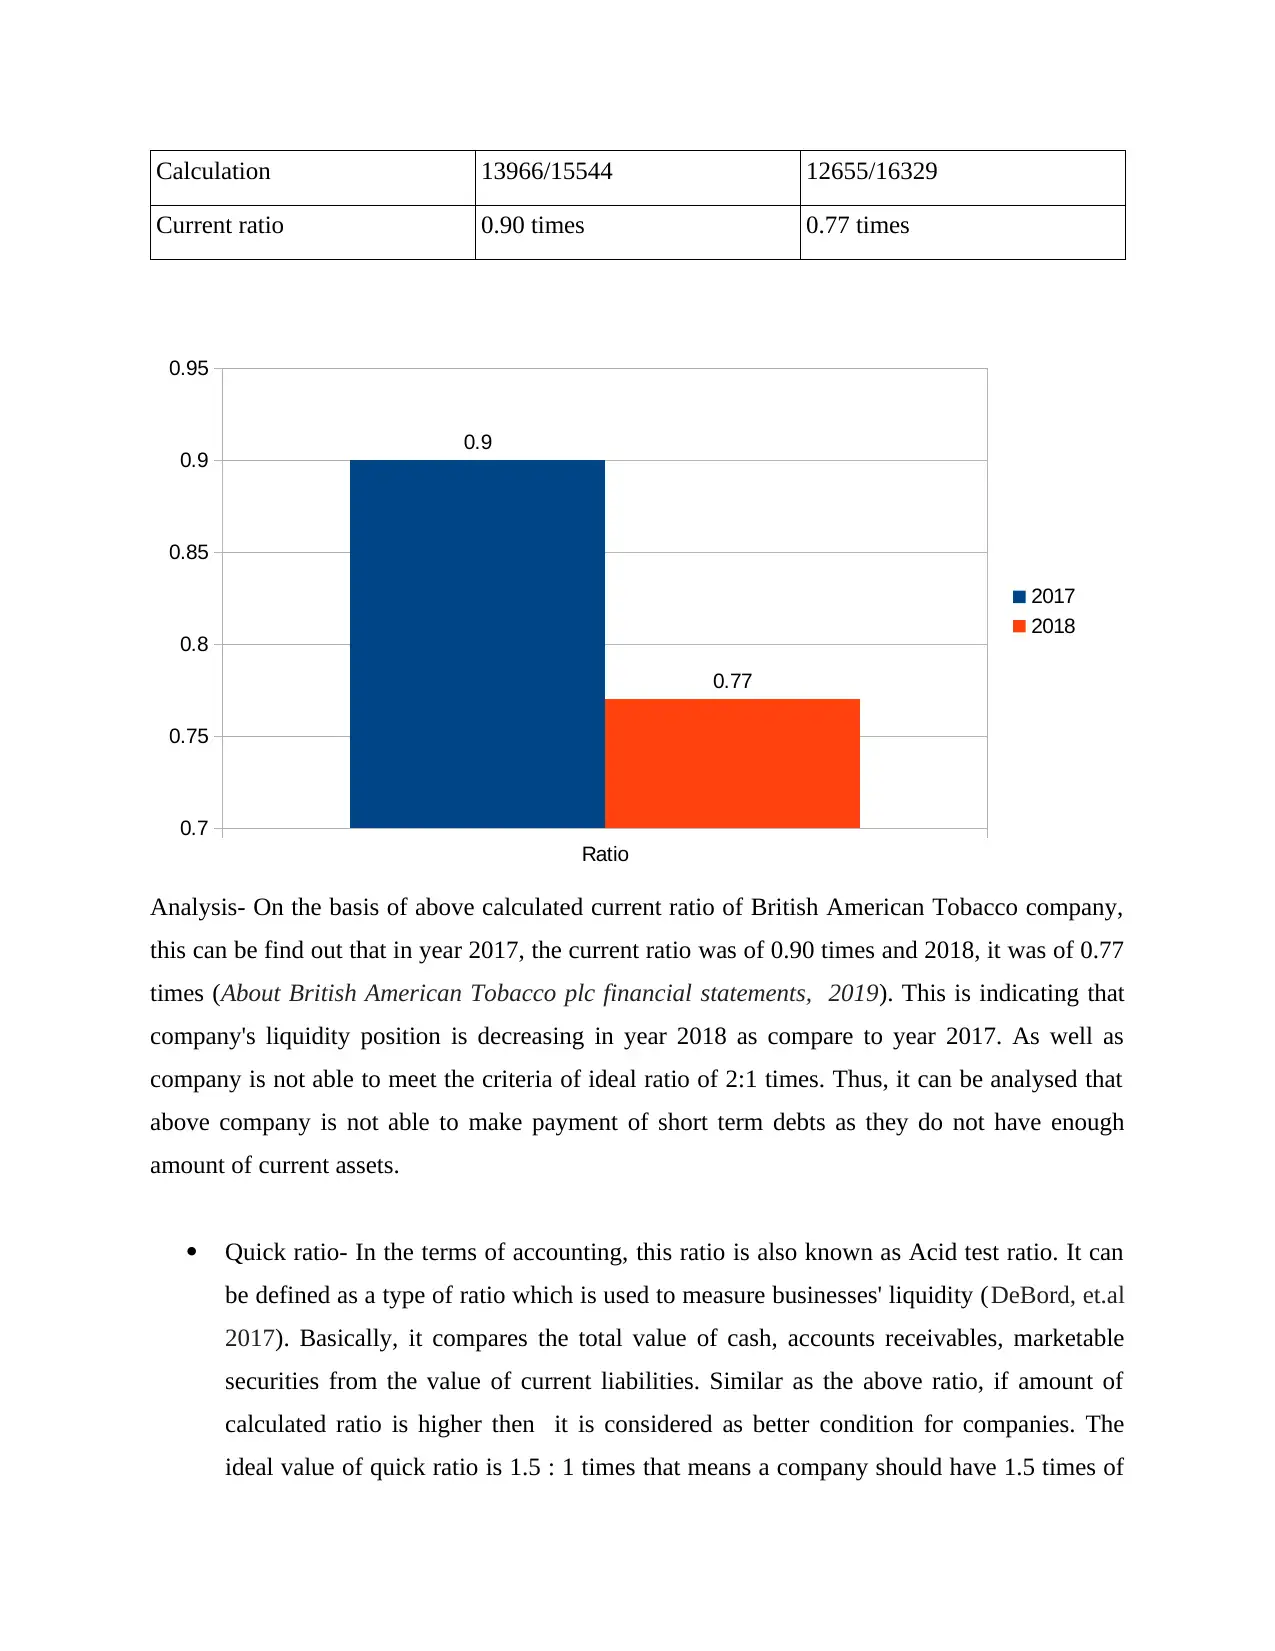
Calculation 13966/15544 12655/16329
Current ratio 0.90 times 0.77 times
Ratio
0.7
0.75
0.8
0.85
0.9
0.95
0.9
0.77
2017
2018
Analysis- On the basis of above calculated current ratio of British American Tobacco company,
this can be find out that in year 2017, the current ratio was of 0.90 times and 2018, it was of 0.77
times (About British American Tobacco plc financial statements, 2019). This is indicating that
company's liquidity position is decreasing in year 2018 as compare to year 2017. As well as
company is not able to meet the criteria of ideal ratio of 2:1 times. Thus, it can be analysed that
above company is not able to make payment of short term debts as they do not have enough
amount of current assets.
Quick ratio- In the terms of accounting, this ratio is also known as Acid test ratio. It can
be defined as a type of ratio which is used to measure businesses' liquidity (DeBord, et.al
2017). Basically, it compares the total value of cash, accounts receivables, marketable
securities from the value of current liabilities. Similar as the above ratio, if amount of
calculated ratio is higher then it is considered as better condition for companies. The
ideal value of quick ratio is 1.5 : 1 times that means a company should have 1.5 times of
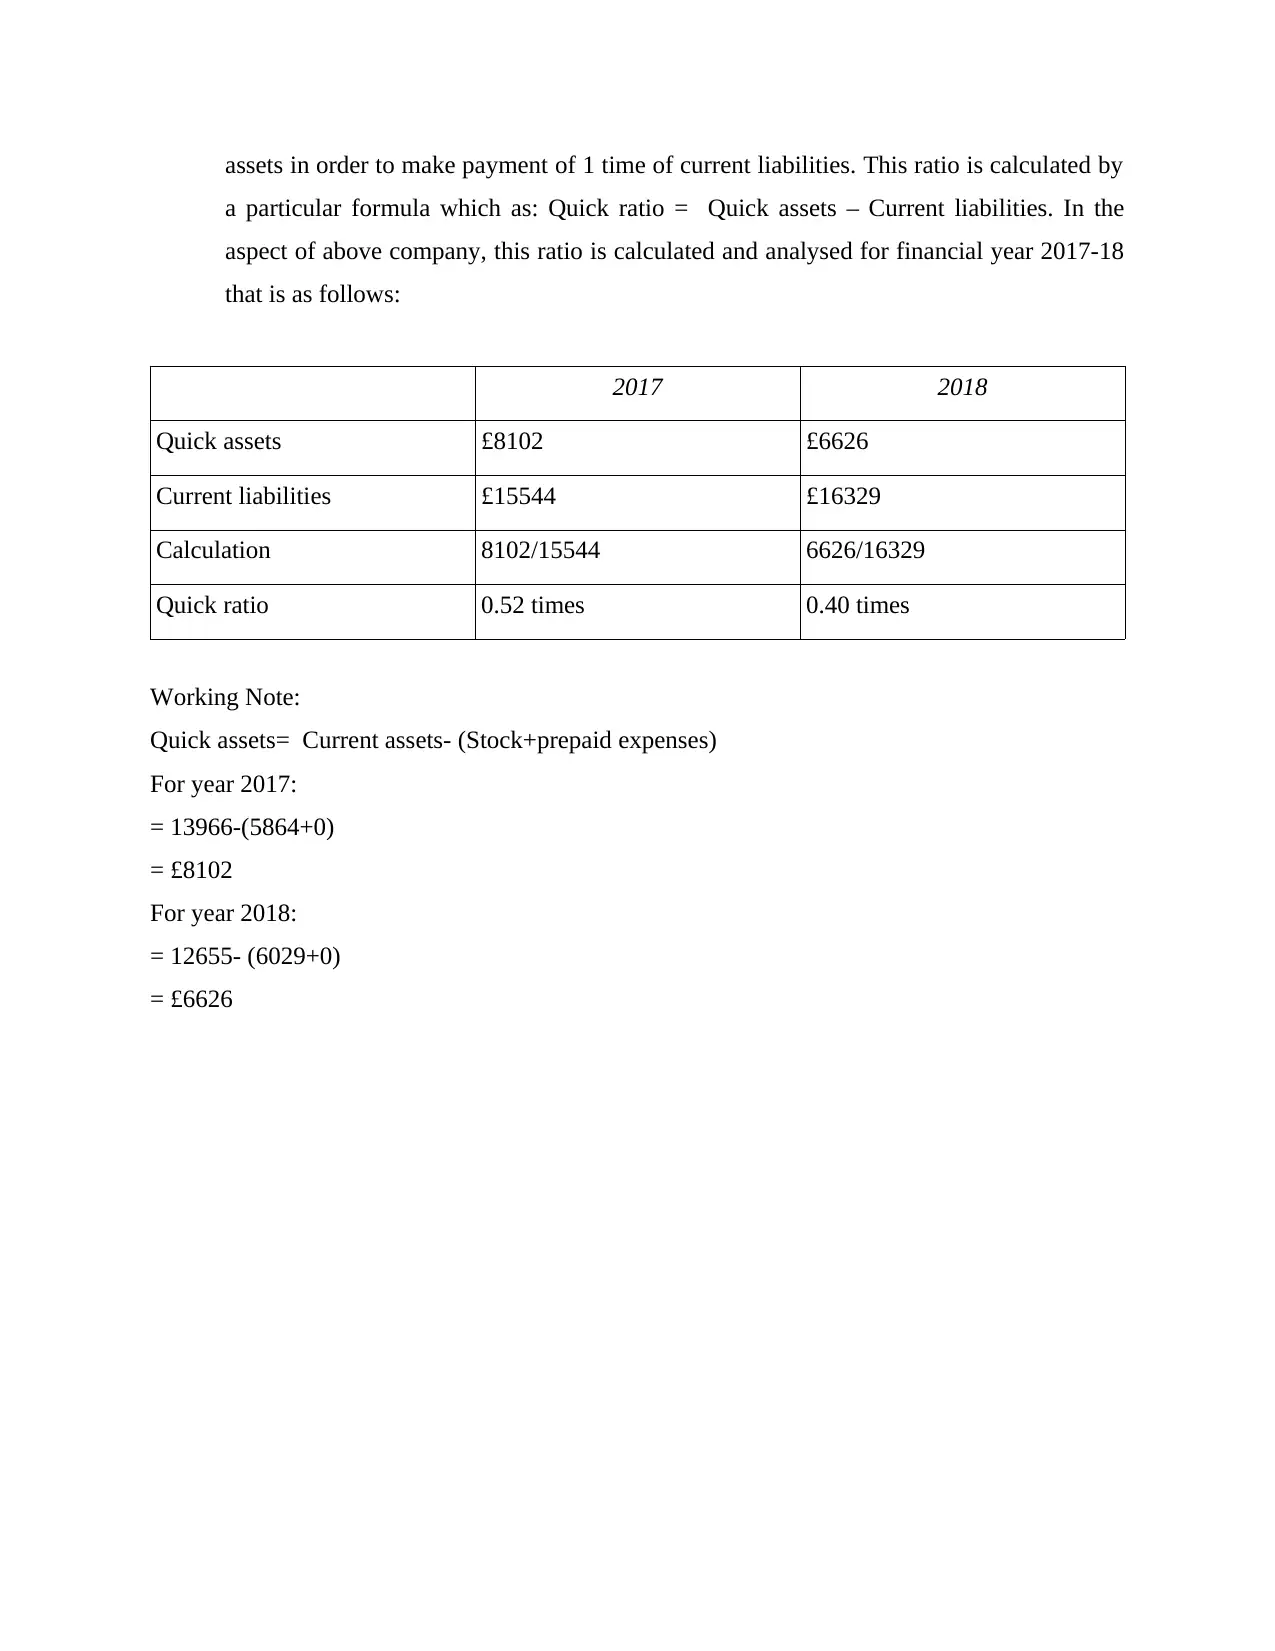
assets in order to make payment of 1 time of current liabilities. This ratio is calculated by
a particular formula which as: Quick ratio = Quick assets – Current liabilities. In the
aspect of above company, this ratio is calculated and analysed for financial year 2017-18
that is as follows:
2017 2018
Quick assets £8102 £6626
Current liabilities £15544 £16329
Calculation 8102/15544 6626/16329
Quick ratio 0.52 times 0.40 times
Working Note:
Quick assets= Current assets- (Stock+prepaid expenses)
For year 2017:
= 13966-(5864+0)
= £8102
For year 2018:
= 12655- (6029+0)
= £6626
⊘ This is a preview!⊘
Do you want full access?
Subscribe today to unlock all pages.
Trusted by 1+ million students worldwide
Ratio
0
0.1
0.2
0.3
0.4
0.5
0.6
0.52
0.4
2017
2018
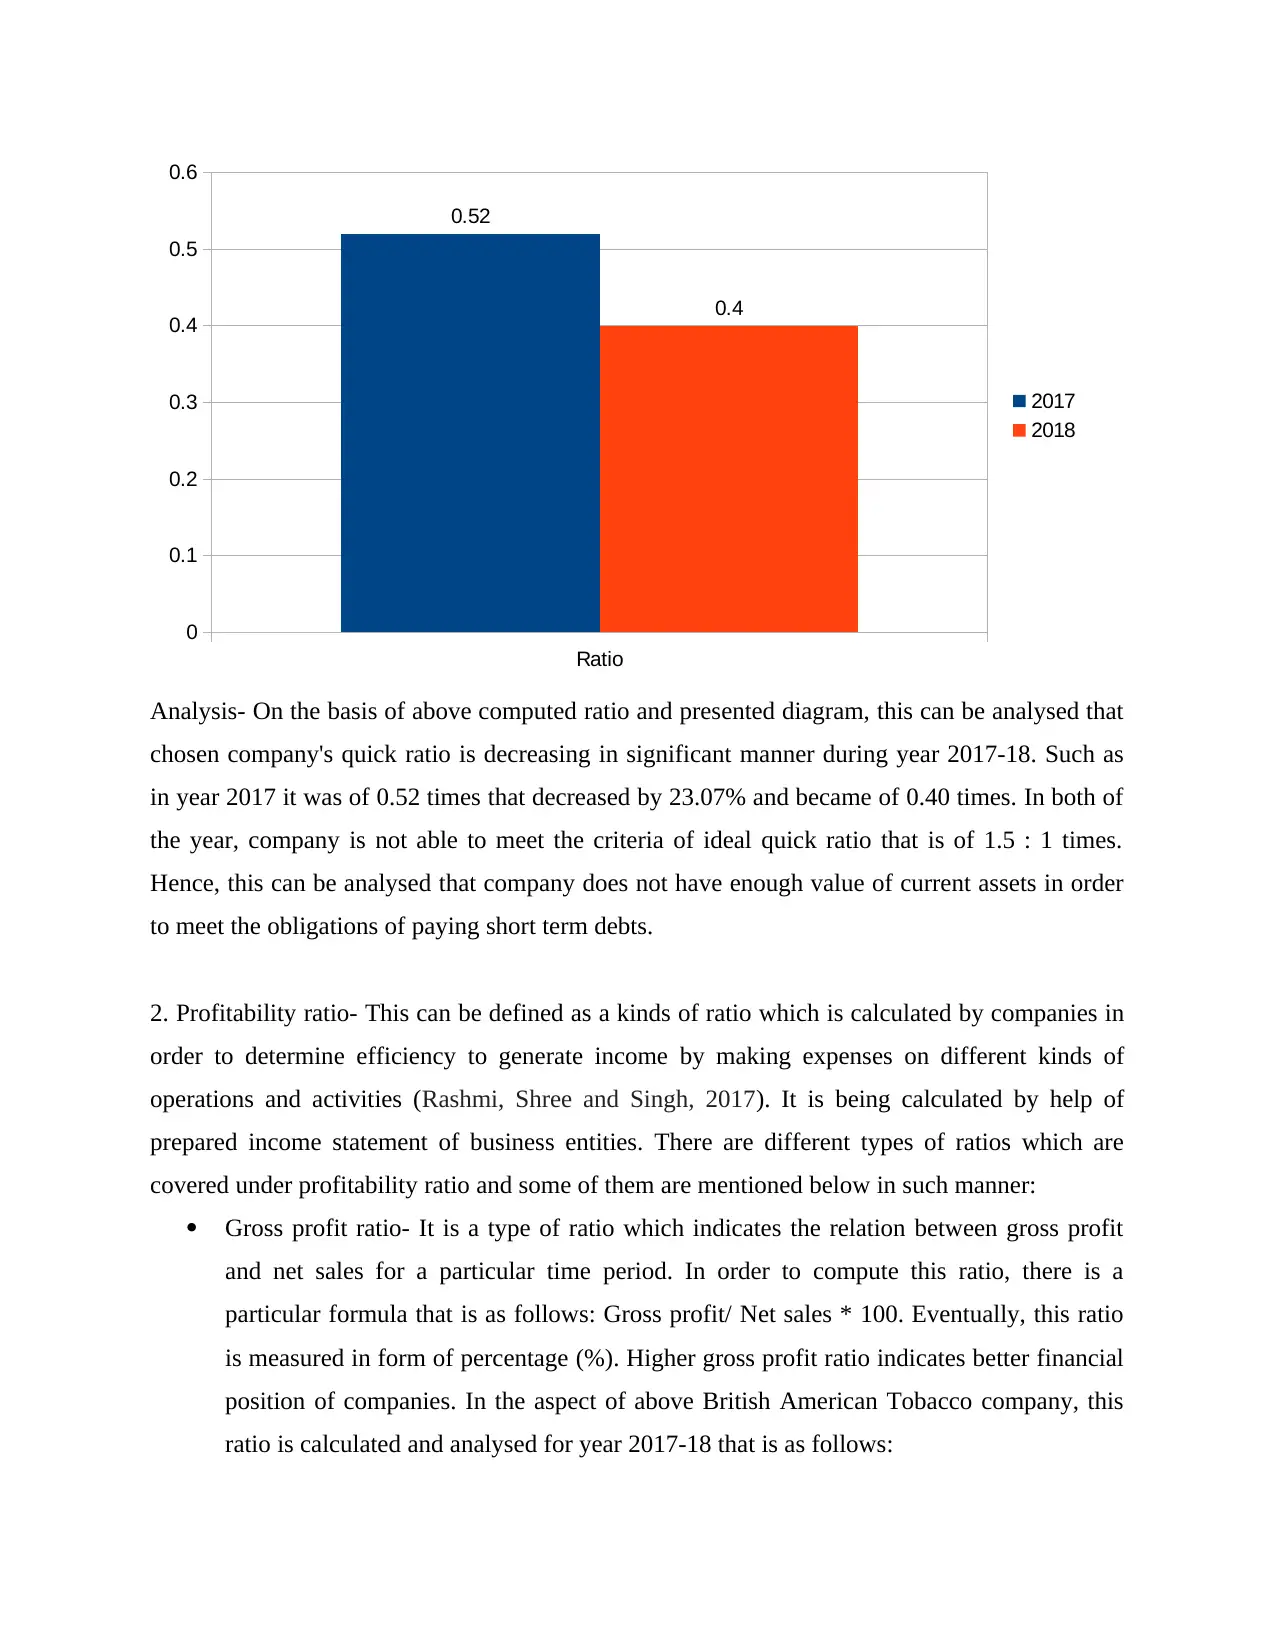
Analysis- On the basis of above computed ratio and presented diagram, this can be analysed that
chosen company's quick ratio is decreasing in significant manner during year 2017-18. Such as
in year 2017 it was of 0.52 times that decreased by 23.07% and became of 0.40 times. In both of
the year, company is not able to meet the criteria of ideal quick ratio that is of 1.5 : 1 times.
Hence, this can be analysed that company does not have enough value of current assets in order
to meet the obligations of paying short term debts.
2. Profitability ratio- This can be defined as a kinds of ratio which is calculated by companies in
order to determine efficiency to generate income by making expenses on different kinds of
operations and activities (Rashmi, Shree and Singh, 2017). It is being calculated by help of
prepared income statement of business entities. There are different types of ratios which are
covered under profitability ratio and some of them are mentioned below in such manner:
Gross profit ratio- It is a type of ratio which indicates the relation between gross profit
and net sales for a particular time period. In order to compute this ratio, there is a
particular formula that is as follows: Gross profit/ Net sales * 100. Eventually, this ratio
is measured in form of percentage (%). Higher gross profit ratio indicates better financial
position of companies. In the aspect of above British American Tobacco company, this
ratio is calculated and analysed for year 2017-18 that is as follows:
0
0.1
0.2
0.3
0.4
0.5
0.6
0.52
0.4
2017
2018
Analysis- On the basis of above computed ratio and presented diagram, this can be analysed that
chosen company's quick ratio is decreasing in significant manner during year 2017-18. Such as
in year 2017 it was of 0.52 times that decreased by 23.07% and became of 0.40 times. In both of
the year, company is not able to meet the criteria of ideal quick ratio that is of 1.5 : 1 times.
Hence, this can be analysed that company does not have enough value of current assets in order
to meet the obligations of paying short term debts.
2. Profitability ratio- This can be defined as a kinds of ratio which is calculated by companies in
order to determine efficiency to generate income by making expenses on different kinds of
operations and activities (Rashmi, Shree and Singh, 2017). It is being calculated by help of
prepared income statement of business entities. There are different types of ratios which are
covered under profitability ratio and some of them are mentioned below in such manner:
Gross profit ratio- It is a type of ratio which indicates the relation between gross profit
and net sales for a particular time period. In order to compute this ratio, there is a
particular formula that is as follows: Gross profit/ Net sales * 100. Eventually, this ratio
is measured in form of percentage (%). Higher gross profit ratio indicates better financial
position of companies. In the aspect of above British American Tobacco company, this
ratio is calculated and analysed for year 2017-18 that is as follows:
Paraphrase This Document
Need a fresh take? Get an instant paraphrase of this document with our AI Paraphraser
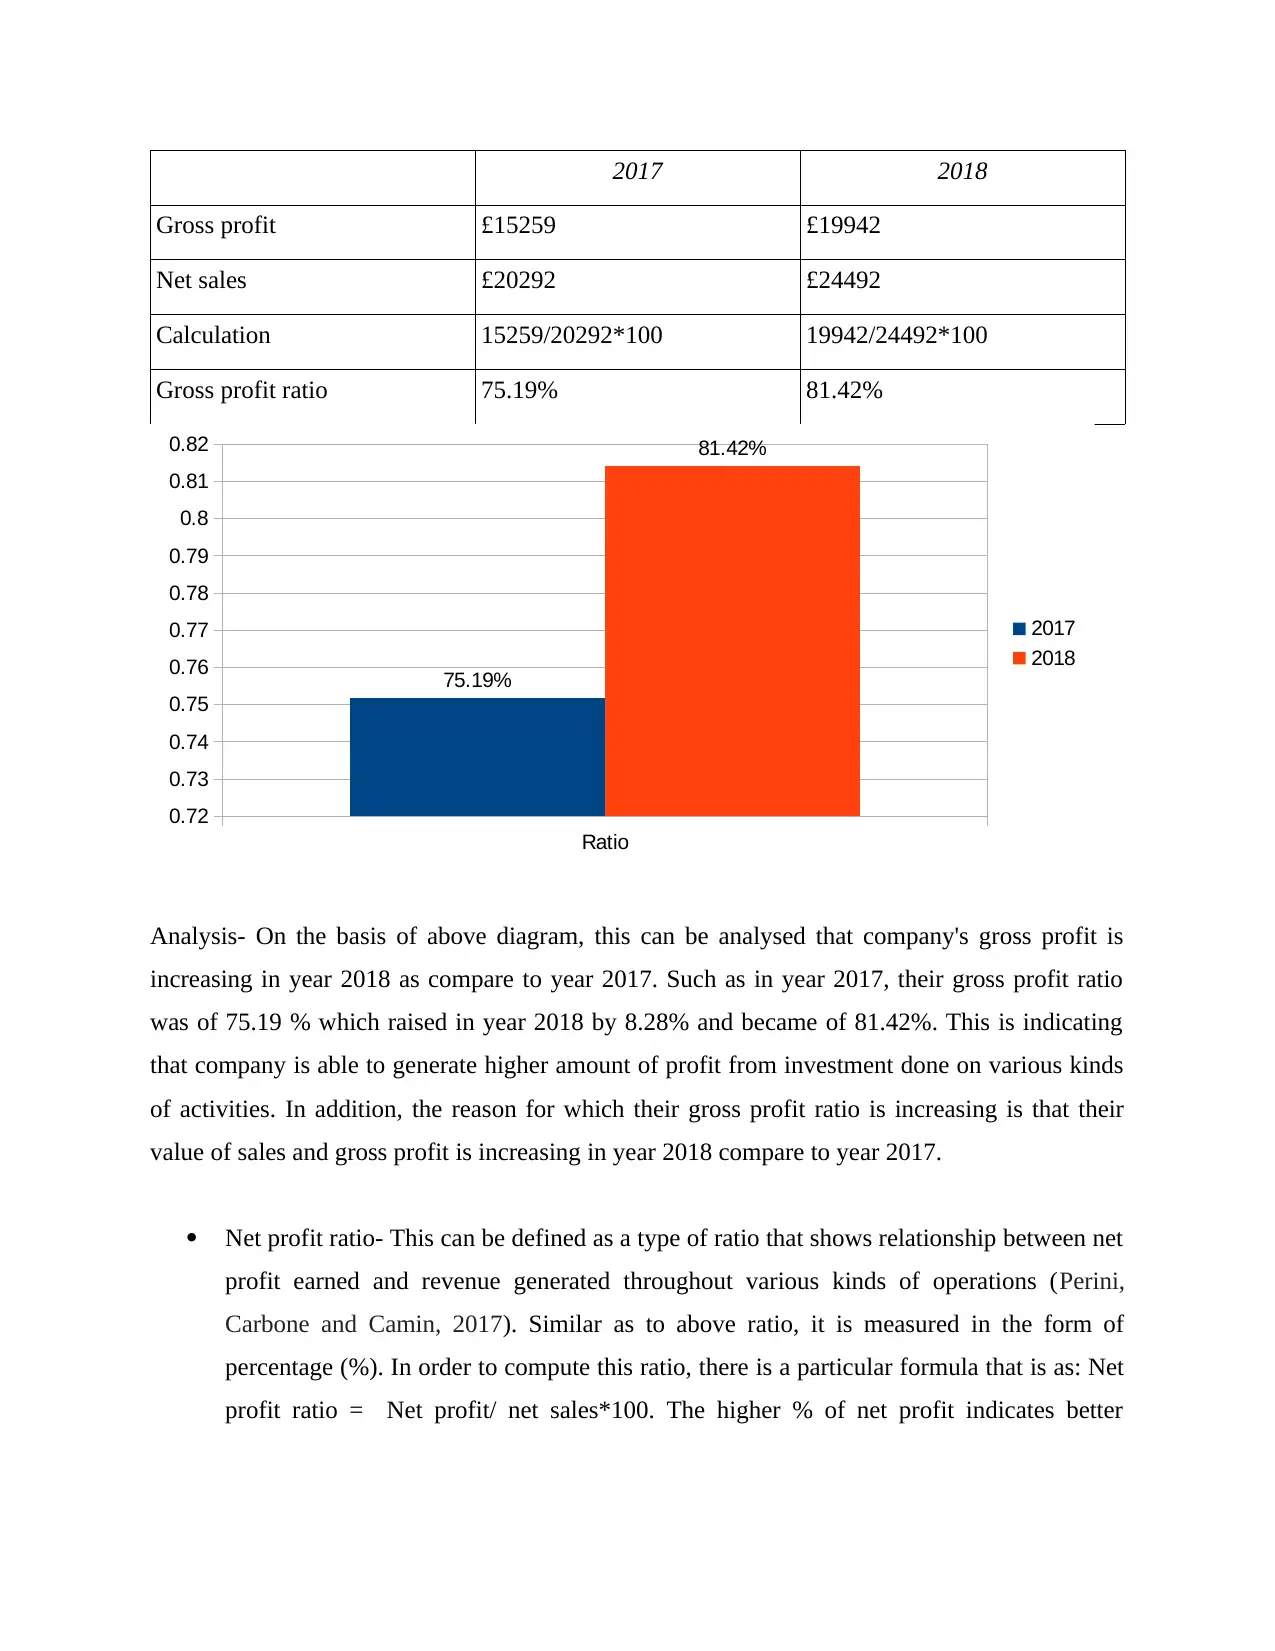
2017 2018
Gross profit £15259 £19942
Net sales £20292 £24492
Calculation 15259/20292*100 19942/24492*100
Gross profit ratio 75.19% 81.42%
Ratio
0.72
0.73
0.74
0.75
0.76
0.77
0.78
0.79
0.8
0.81
0.82
75.19%
81.42%
2017
2018
Analysis- On the basis of above diagram, this can be analysed that company's gross profit is
increasing in year 2018 as compare to year 2017. Such as in year 2017, their gross profit ratio
was of 75.19 % which raised in year 2018 by 8.28% and became of 81.42%. This is indicating
that company is able to generate higher amount of profit from investment done on various kinds
of activities. In addition, the reason for which their gross profit ratio is increasing is that their
value of sales and gross profit is increasing in year 2018 compare to year 2017.
Net profit ratio- This can be defined as a type of ratio that shows relationship between net
profit earned and revenue generated throughout various kinds of operations (Perini,
Carbone and Camin, 2017). Similar as to above ratio, it is measured in the form of
percentage (%). In order to compute this ratio, there is a particular formula that is as: Net
profit ratio = Net profit/ net sales*100. The higher % of net profit indicates better
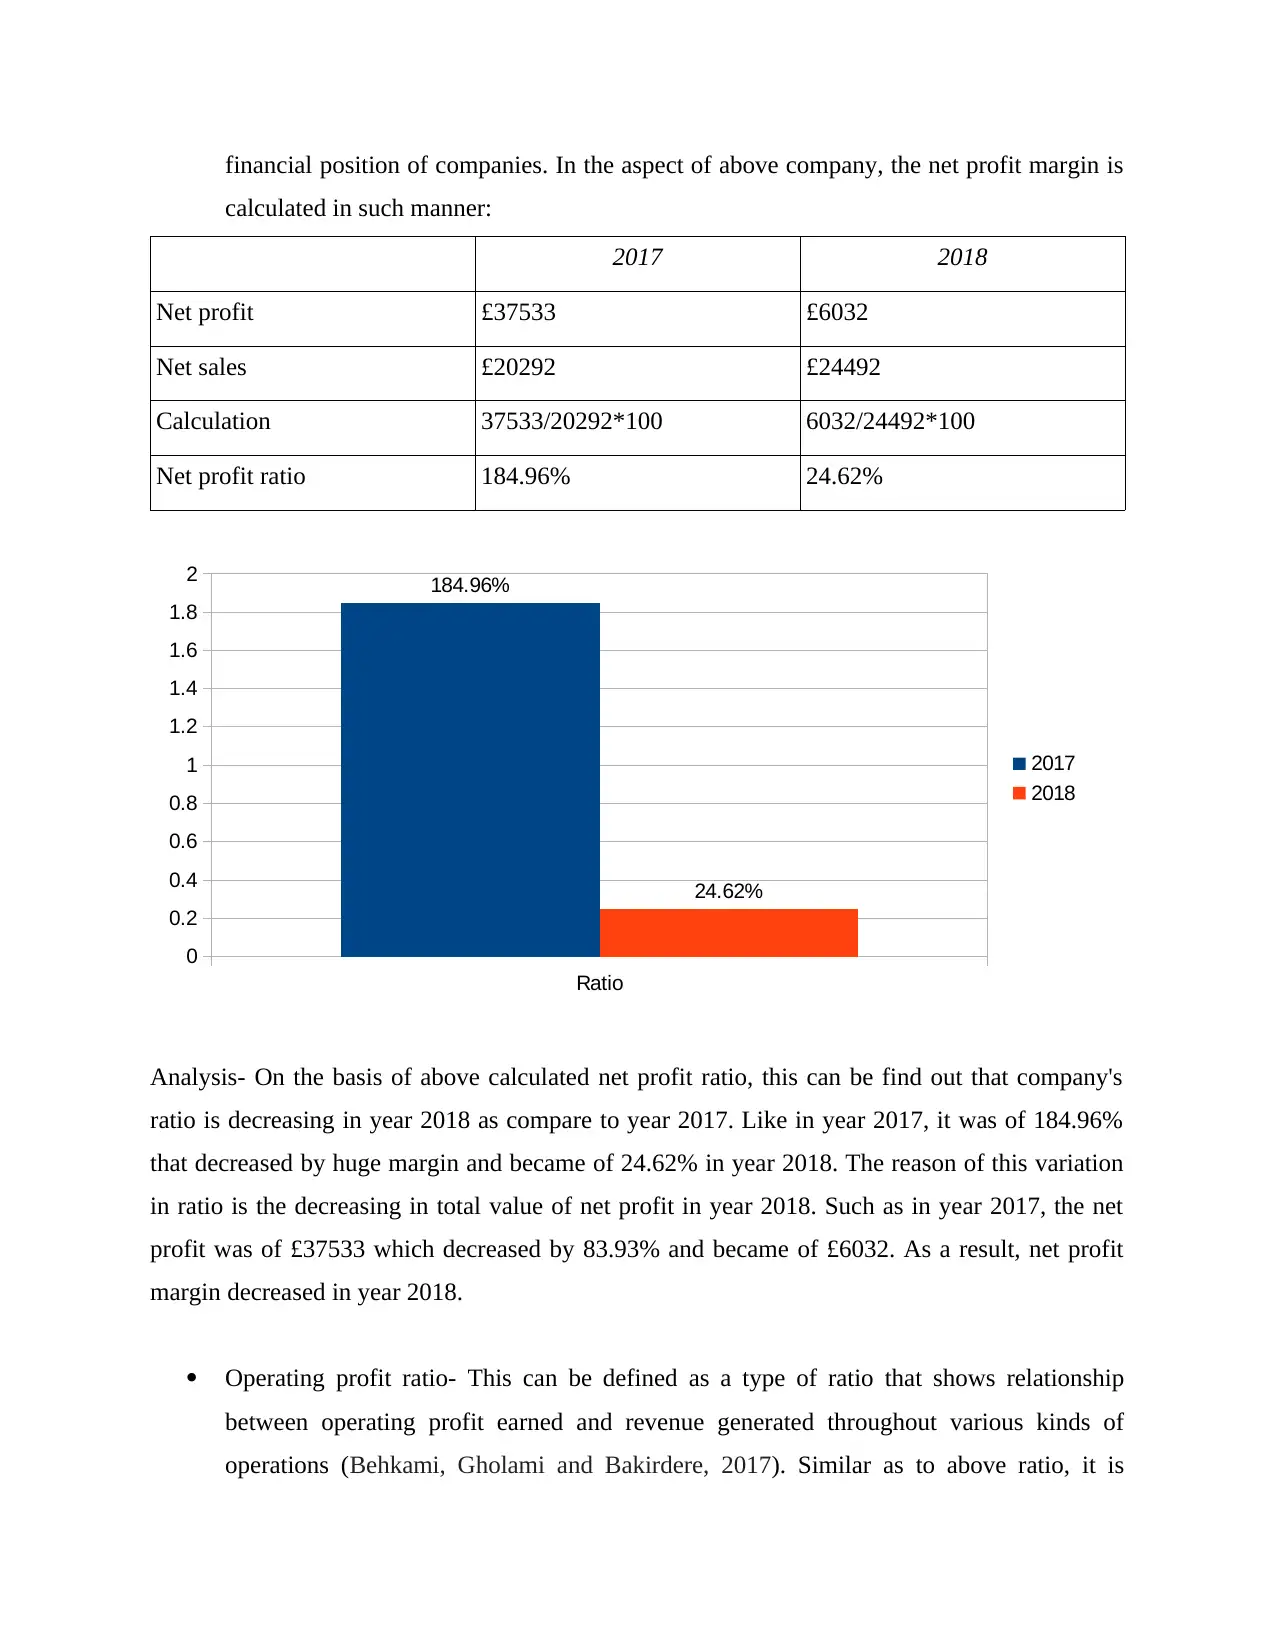
financial position of companies. In the aspect of above company, the net profit margin is
calculated in such manner:
2017 2018
Net profit £37533 £6032
Net sales £20292 £24492
Calculation 37533/20292*100 6032/24492*100
Net profit ratio 184.96% 24.62%
Ratio
0
0.2
0.4
0.6
0.8
1
1.2
1.4
1.6
1.8
2 184.96%
24.62%
2017
2018
Analysis- On the basis of above calculated net profit ratio, this can be find out that company's
ratio is decreasing in year 2018 as compare to year 2017. Like in year 2017, it was of 184.96%
that decreased by huge margin and became of 24.62% in year 2018. The reason of this variation
in ratio is the decreasing in total value of net profit in year 2018. Such as in year 2017, the net
profit was of £37533 which decreased by 83.93% and became of £6032. As a result, net profit
margin decreased in year 2018.
Operating profit ratio- This can be defined as a type of ratio that shows relationship
between operating profit earned and revenue generated throughout various kinds of
operations (Behkami, Gholami and Bakirdere, 2017). Similar as to above ratio, it is
⊘ This is a preview!⊘
Do you want full access?
Subscribe today to unlock all pages.
Trusted by 1+ million students worldwide
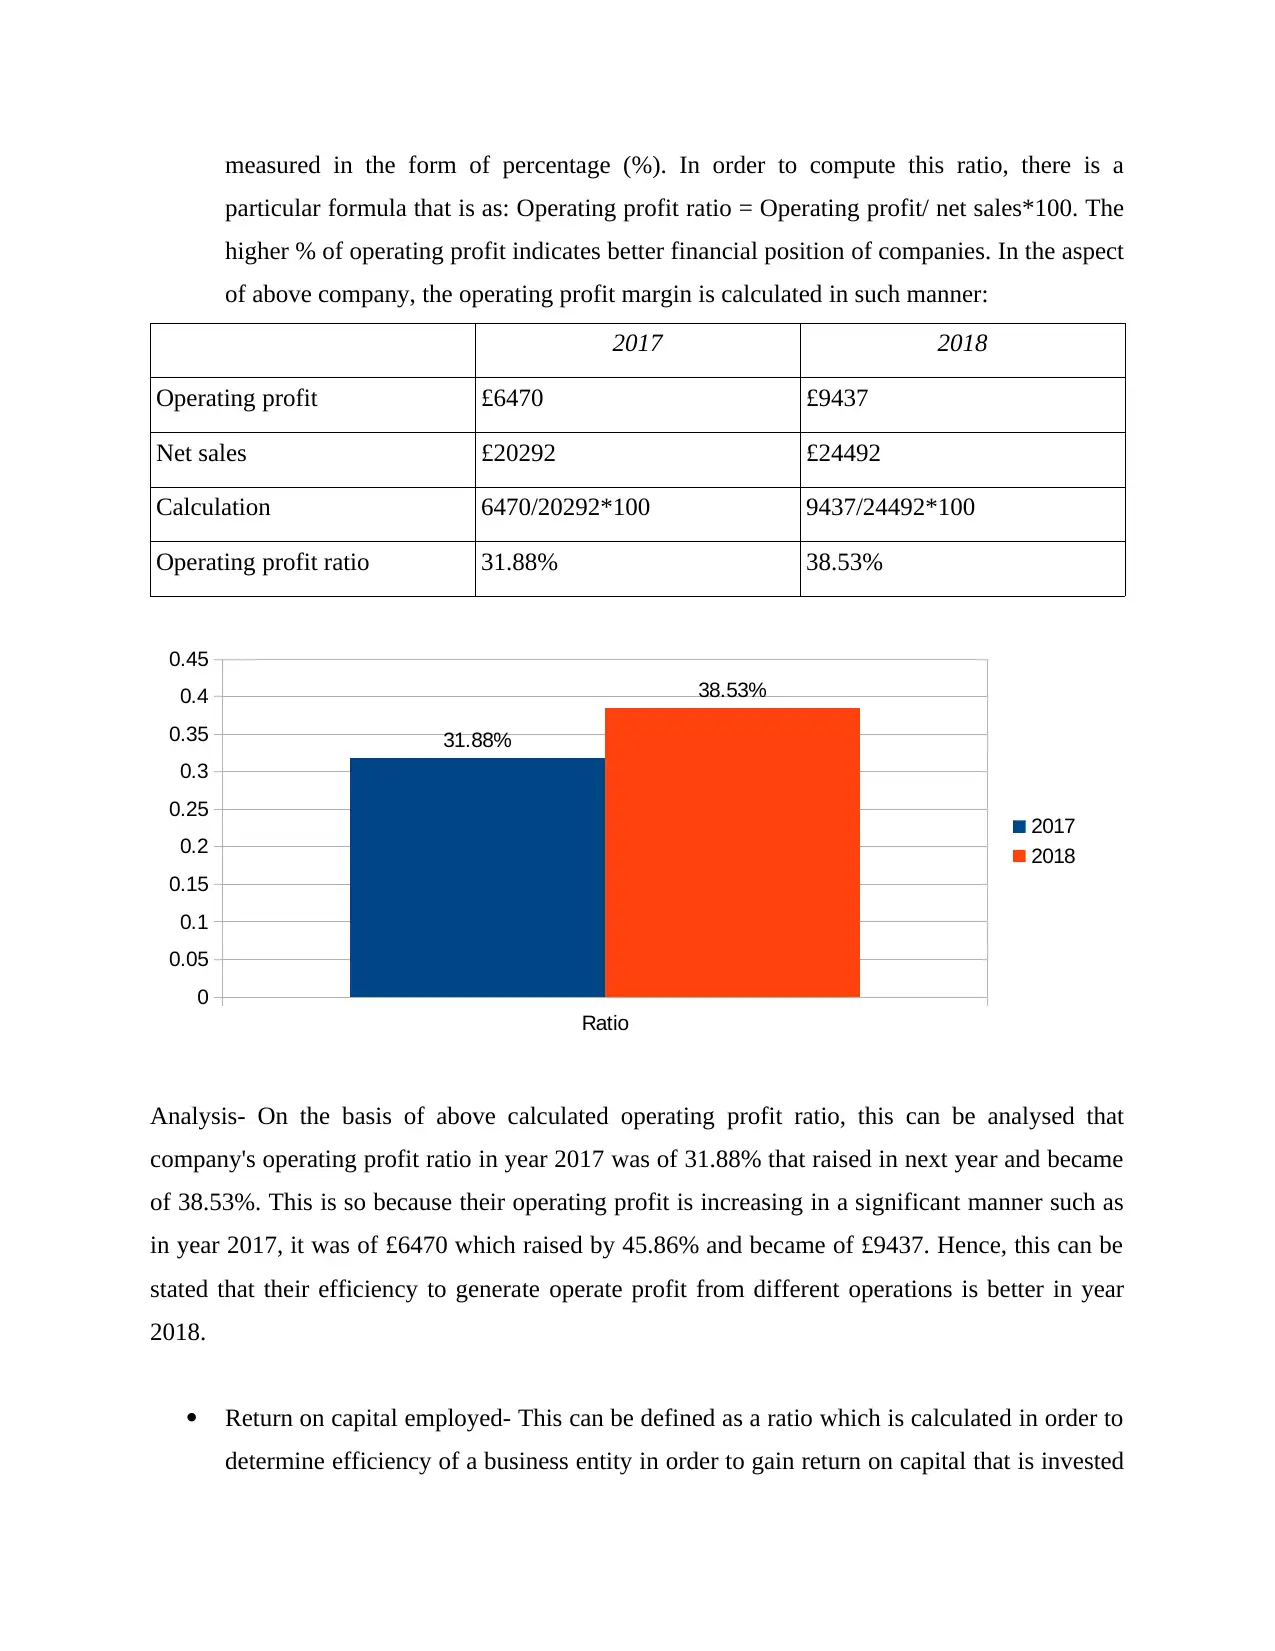
measured in the form of percentage (%). In order to compute this ratio, there is a
particular formula that is as: Operating profit ratio = Operating profit/ net sales*100. The
higher % of operating profit indicates better financial position of companies. In the aspect
of above company, the operating profit margin is calculated in such manner:
2017 2018
Operating profit £6470 £9437
Net sales £20292 £24492
Calculation 6470/20292*100 9437/24492*100
Operating profit ratio 31.88% 38.53%
Ratio
0
0.05
0.1
0.15
0.2
0.25
0.3
0.35
0.4
0.45
31.88%
38.53%
2017
2018
Analysis- On the basis of above calculated operating profit ratio, this can be analysed that
company's operating profit ratio in year 2017 was of 31.88% that raised in next year and became
of 38.53%. This is so because their operating profit is increasing in a significant manner such as
in year 2017, it was of £6470 which raised by 45.86% and became of £9437. Hence, this can be
stated that their efficiency to generate operate profit from different operations is better in year
2018.
Return on capital employed- This can be defined as a ratio which is calculated in order to
determine efficiency of a business entity in order to gain return on capital that is invested
Paraphrase This Document
Need a fresh take? Get an instant paraphrase of this document with our AI Paraphraser
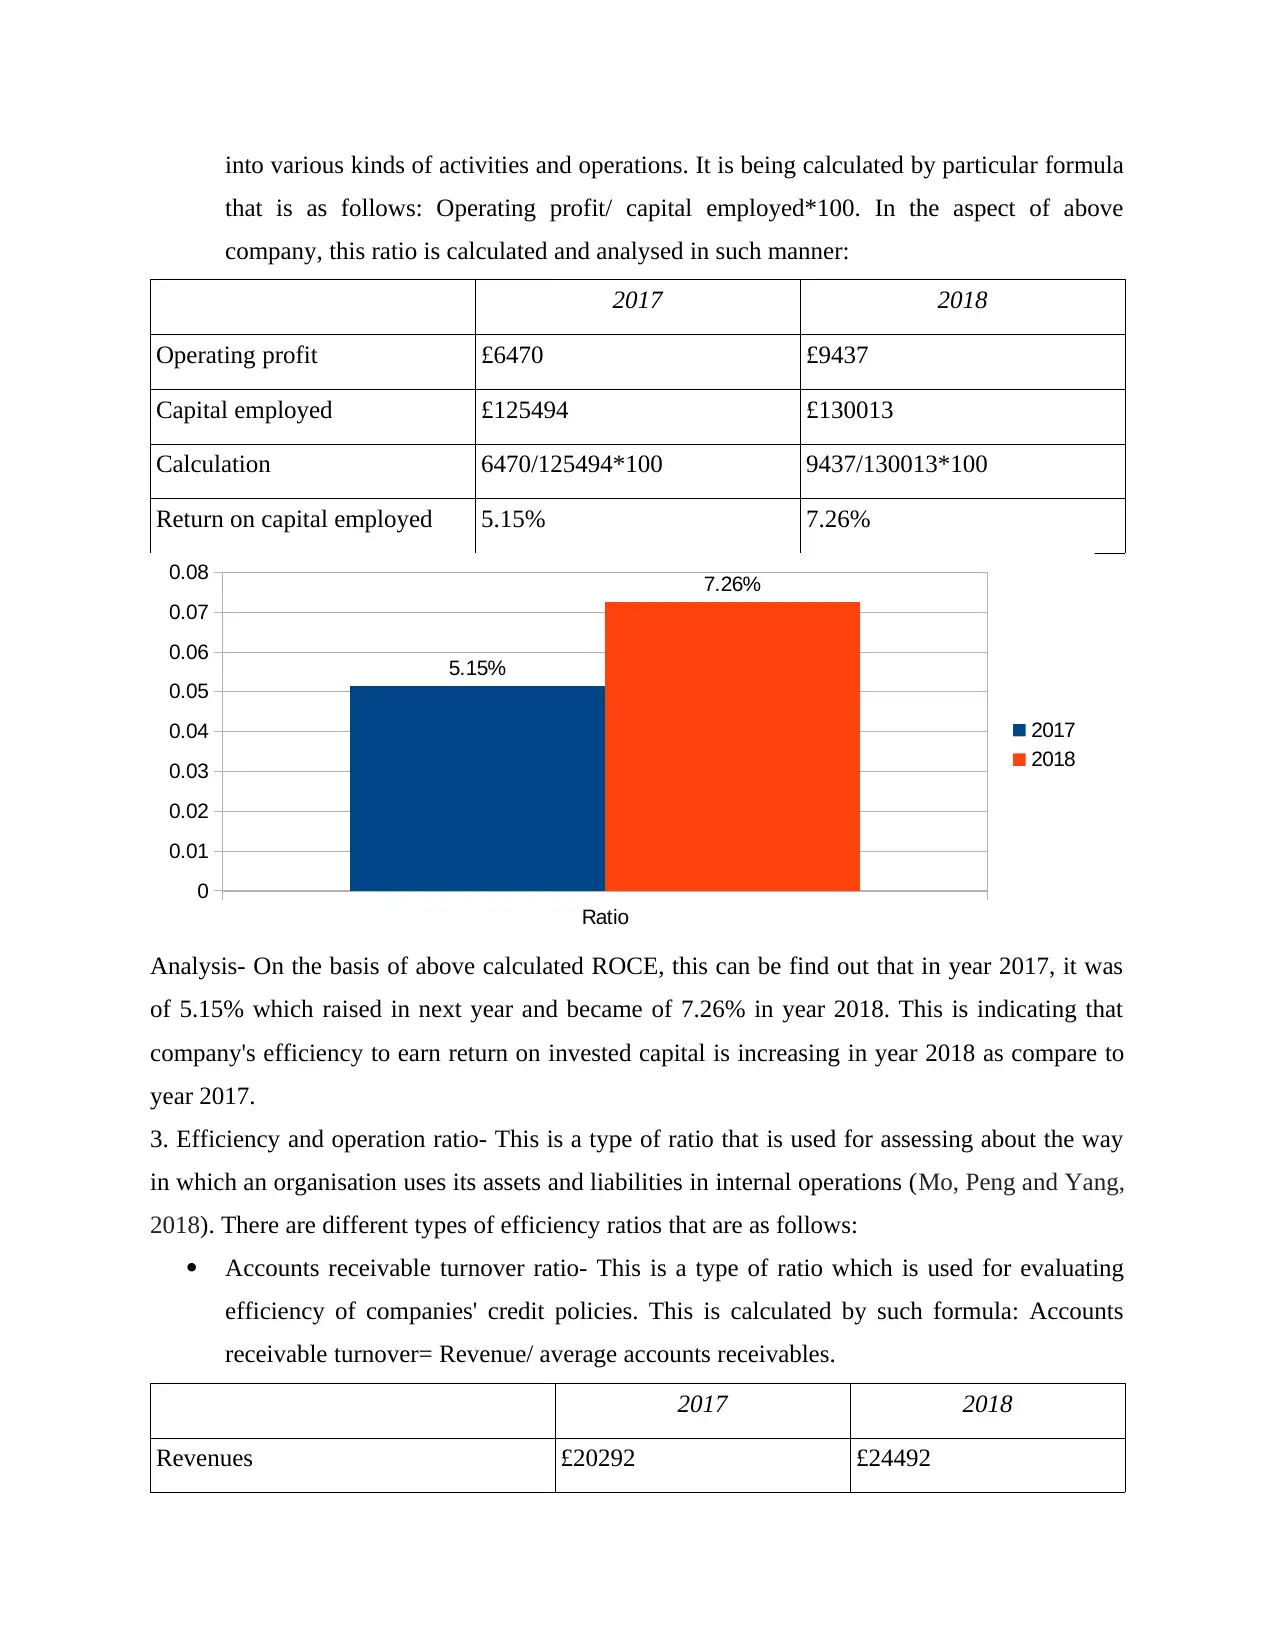
into various kinds of activities and operations. It is being calculated by particular formula
that is as follows: Operating profit/ capital employed*100. In the aspect of above
company, this ratio is calculated and analysed in such manner:
2017 2018
Operating profit £6470 £9437
Capital employed £125494 £130013
Calculation 6470/125494*100 9437/130013*100
Return on capital employed 5.15% 7.26%
Ratio
0
0.01
0.02
0.03
0.04
0.05
0.06
0.07
0.08
5.15%
7.26%
2017
2018
Analysis- On the basis of above calculated ROCE, this can be find out that in year 2017, it was
of 5.15% which raised in next year and became of 7.26% in year 2018. This is indicating that
company's efficiency to earn return on invested capital is increasing in year 2018 as compare to
year 2017.
3. Efficiency and operation ratio- This is a type of ratio that is used for assessing about the way
in which an organisation uses its assets and liabilities in internal operations (Mo, Peng and Yang,
2018). There are different types of efficiency ratios that are as follows:
Accounts receivable turnover ratio- This is a type of ratio which is used for evaluating
efficiency of companies' credit policies. This is calculated by such formula: Accounts
receivable turnover= Revenue/ average accounts receivables.
2017 2018
Revenues £20292 £24492
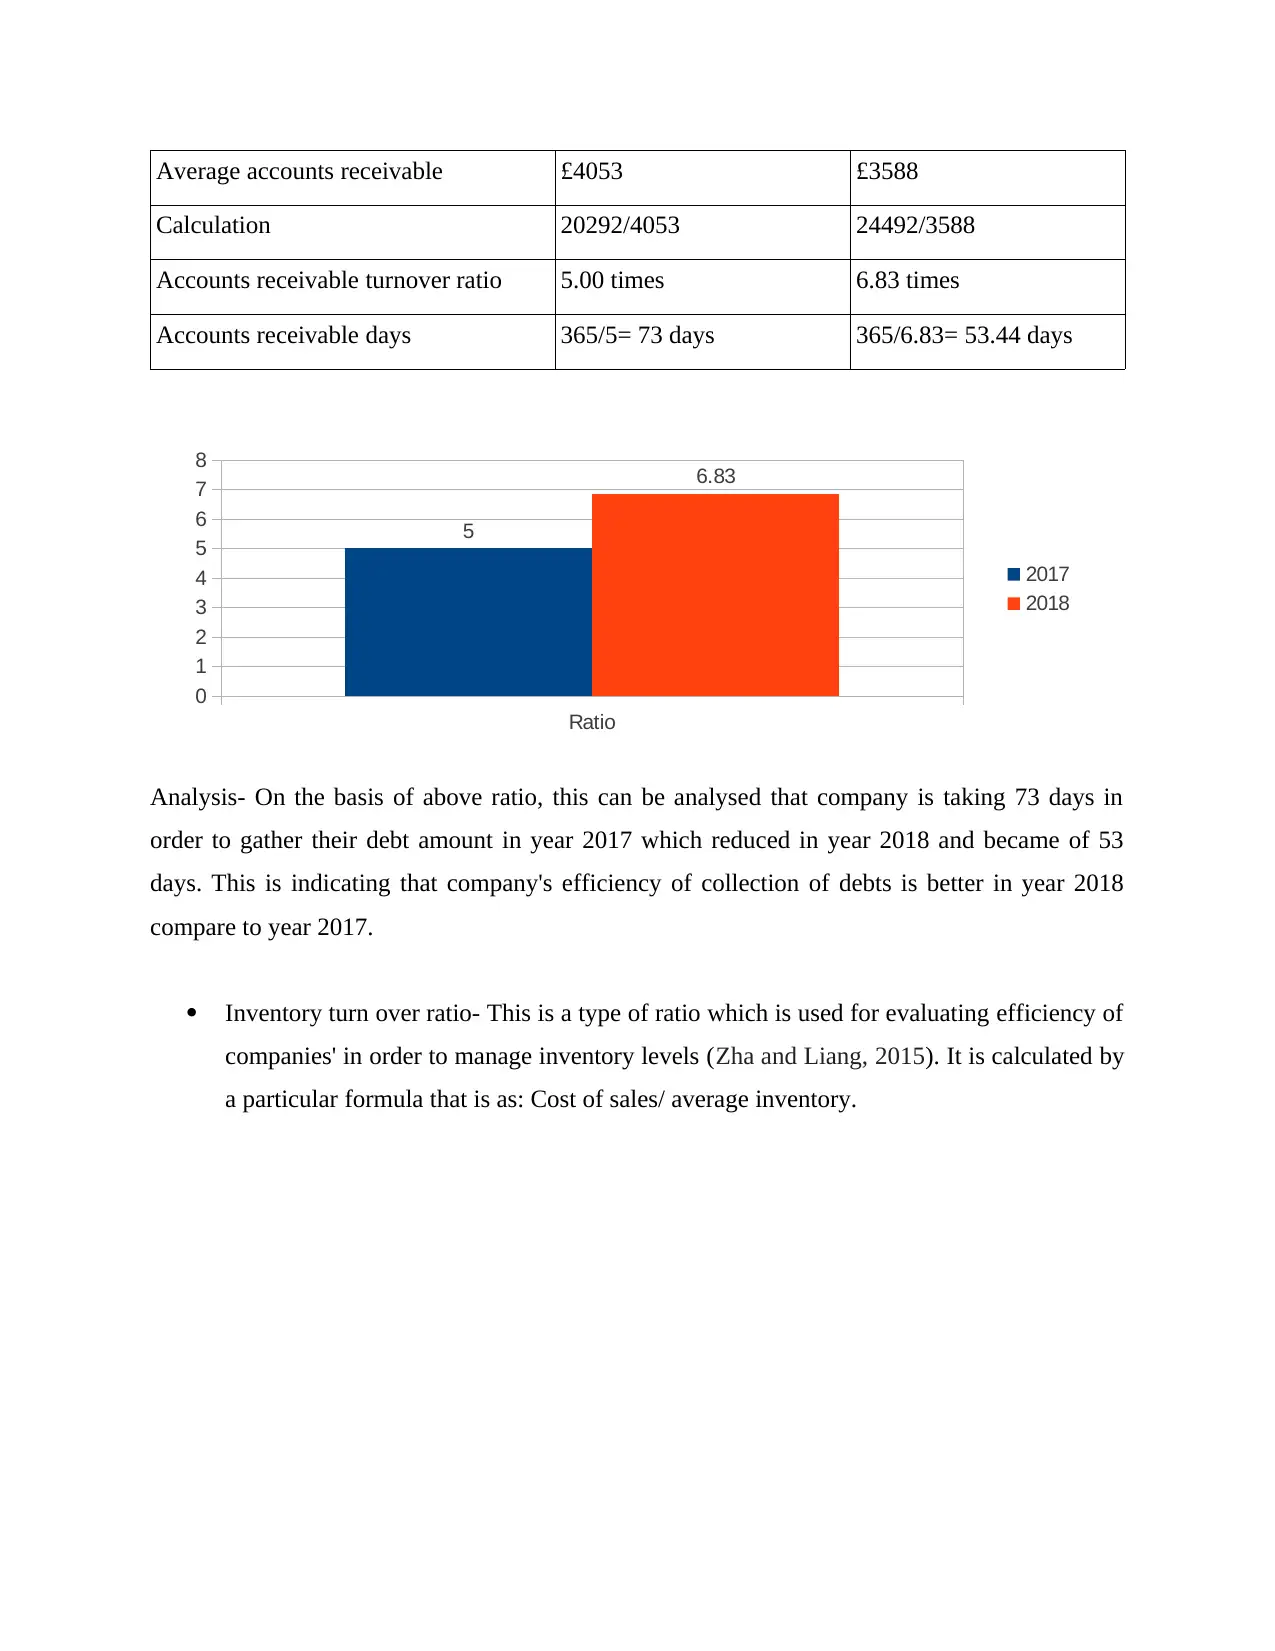
Average accounts receivable £4053 £3588
Calculation 20292/4053 24492/3588
Accounts receivable turnover ratio 5.00 times 6.83 times
Accounts receivable days 365/5= 73 days 365/6.83= 53.44 days
Ratio
0
1
2
3
4
5
6
7
8
5
6.83
2017
2018
Analysis- On the basis of above ratio, this can be analysed that company is taking 73 days in
order to gather their debt amount in year 2017 which reduced in year 2018 and became of 53
days. This is indicating that company's efficiency of collection of debts is better in year 2018
compare to year 2017.
Inventory turn over ratio- This is a type of ratio which is used for evaluating efficiency of
companies' in order to manage inventory levels (Zha and Liang, 2015). It is calculated by
a particular formula that is as: Cost of sales/ average inventory.
⊘ This is a preview!⊘
Do you want full access?
Subscribe today to unlock all pages.
Trusted by 1+ million students worldwide
1 out of 21
Related Documents


Your All-in-One AI-Powered Toolkit for Academic Success.
+13062052269
info@desklib.com
Available 24*7 on WhatsApp / Email
![[object Object]](/_next/static/media/star-bottom.7253800d.svg)
Unlock your academic potential
Copyright © 2020–2026 A2Z Services. All Rights Reserved. Developed and managed by ZUCOL.