Analysis of British Columbia Climate Patterns and Controls

Verified

Added on  2020/03/28

|8
|1002
|84
Homework Assignment
AI Summary
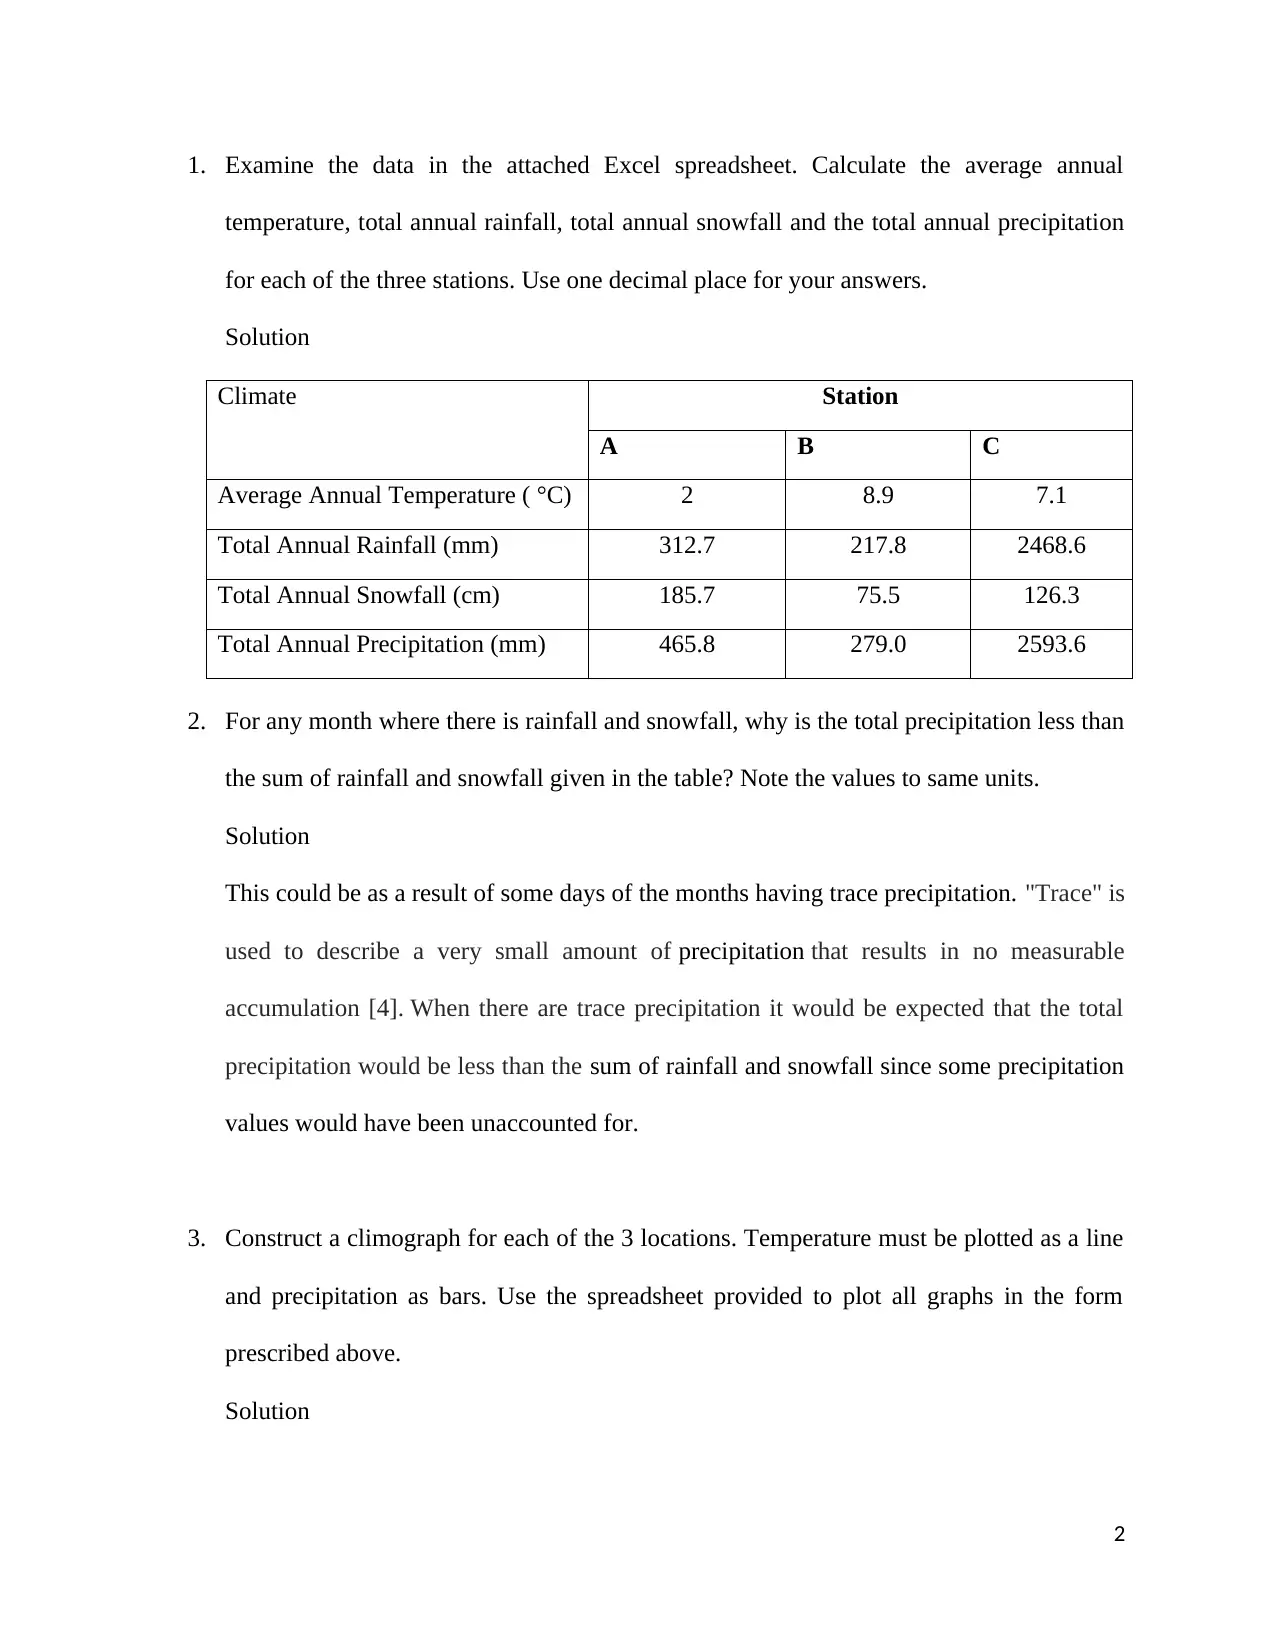
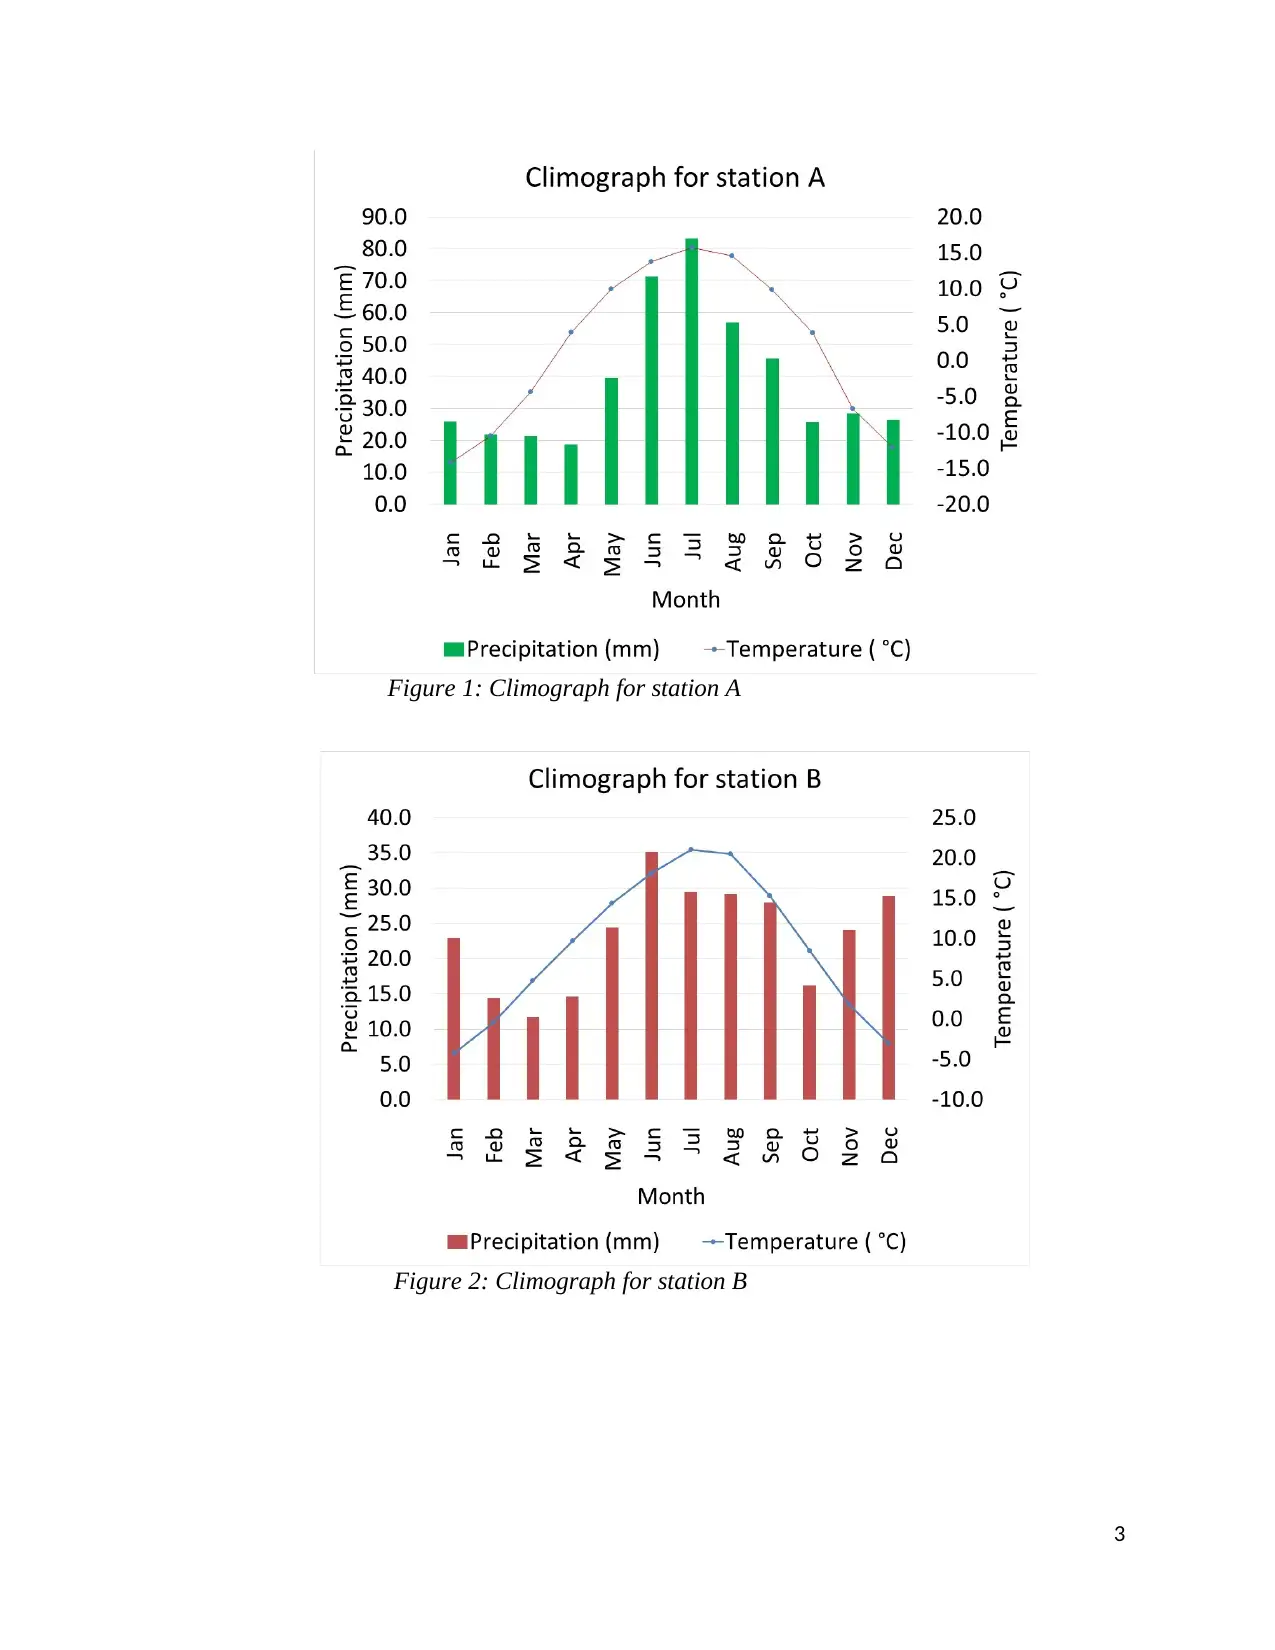
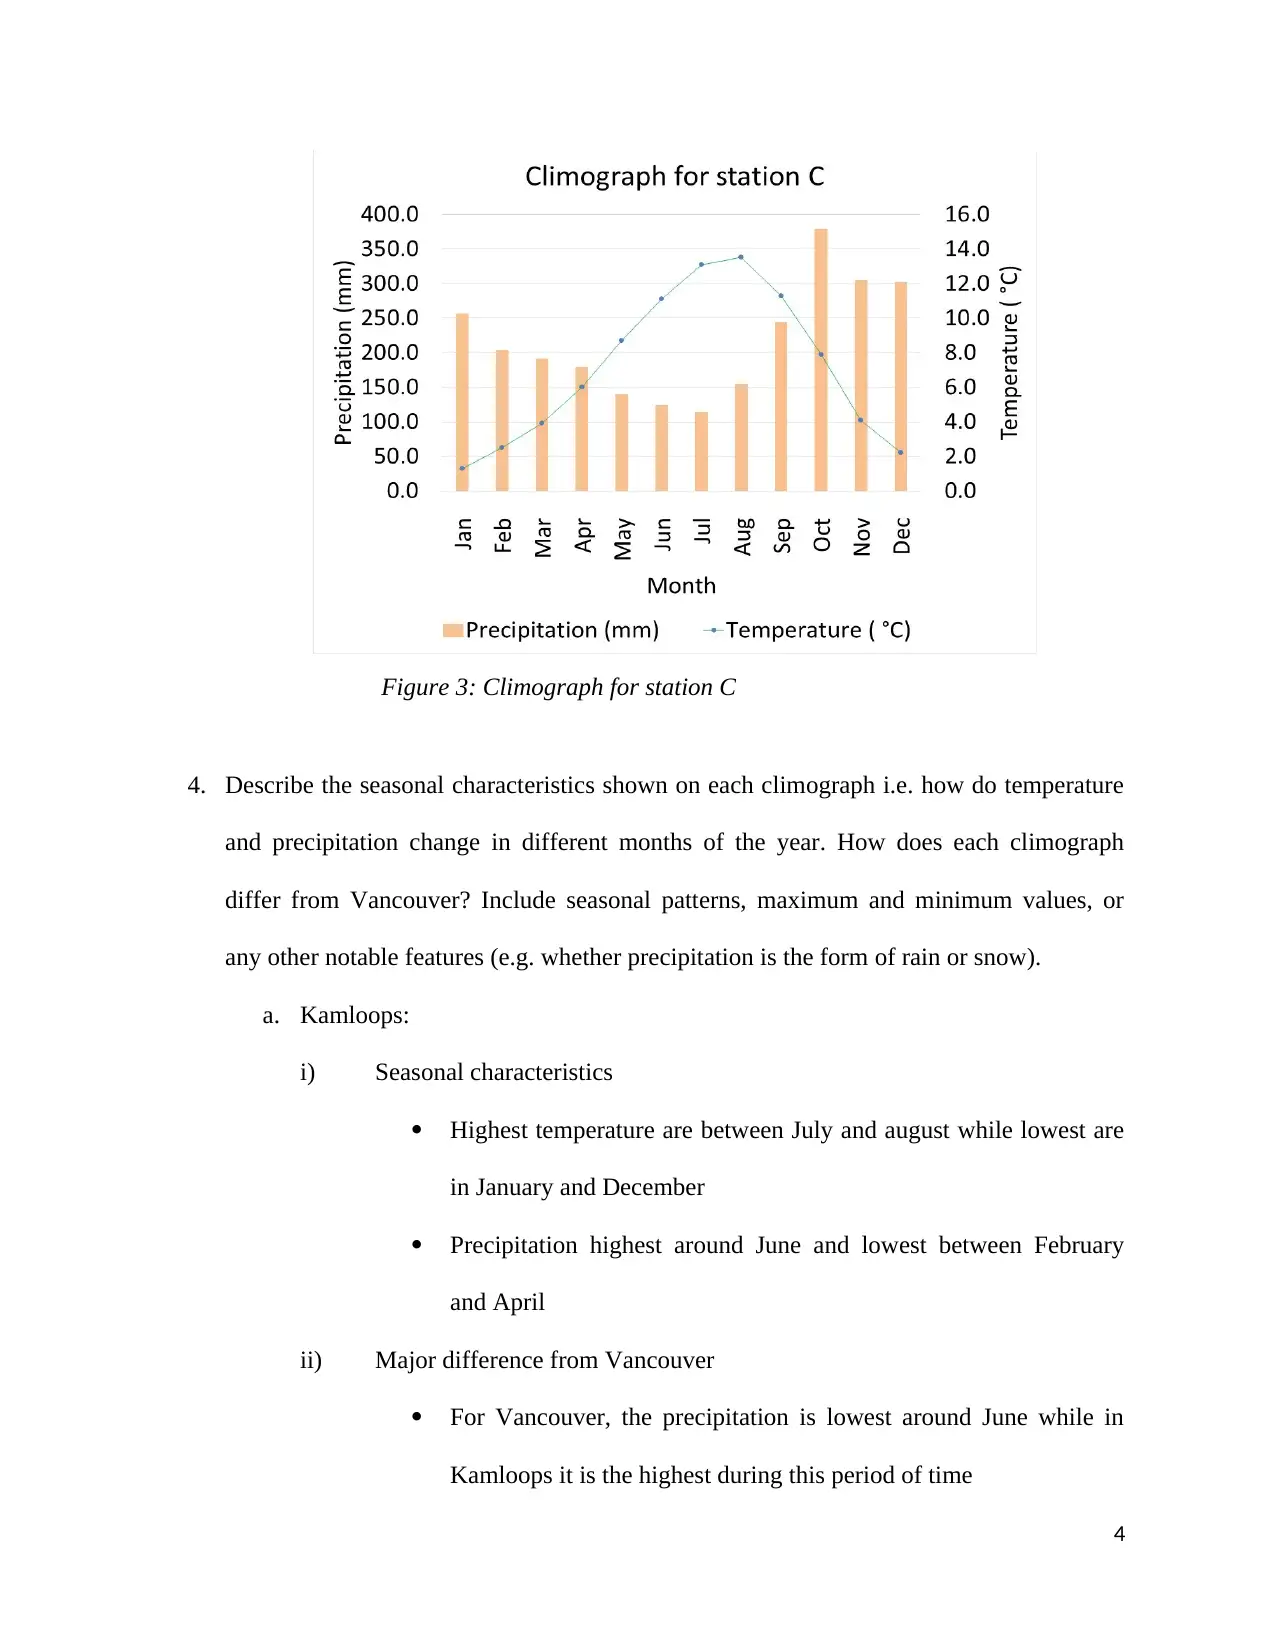
This assignment analyzes climate patterns and controls in British Columbia, focusing on data from three different stations. The student calculates average annual temperature, total annual rainfall, snowfall, and precipitation for each location, using data from an Excel spreadsheet. The assignment explores why total precipitation is sometimes less than the sum of rainfall and snowfall. Climographs are constructed for each station, and seasonal characteristics, including temperature and precipitation changes throughout the year, are described and compared to Vancouver. The student explains how the patterns relate to major climate controls such as rain shadow, continentality, latitude, air masses, and the maritime effect, providing reasoning for determining which climograph corresponds with which location. References from the Canadian Climate Normals and the Glossary of Meteorology are included to support the analysis.
Document Page
British Columbia climate patterns and controls
Name:
Lecturer name:
1st October 2017
1
tabler-icon-diamond-filled.svg

Paraphrase This Document

Need a fresh take? Get an instant paraphrase of this document with our AI Paraphraser
Document Page
1. Examine the data in the attached Excel spreadsheet. Calculate the average annual
temperature, total annual rainfall, total annual snowfall and the total annual precipitation
for each of the three stations. Use one decimal place for your answers.
Solution
Climate Station
A B C
Average Annual Temperature ( °C) 2 8.9 7.1
Total Annual Rainfall (mm) 312.7 217.8 2468.6
Total Annual Snowfall (cm) 185.7 75.5 126.3
Total Annual Precipitation (mm) 465.8 279.0 2593.6
2. For any month where there is rainfall and snowfall, why is the total precipitation less than
the sum of rainfall and snowfall given in the table? Note the values to same units.
Solution
This could be as a result of some days of the months having trace precipitation. "Trace" is
used to describe a very small amount of precipitation that results in no measurable
accumulation [4]. When there are trace precipitation it would be expected that the total
precipitation would be less than the sum of rainfall and snowfall since some precipitation
values would have been unaccounted for.
3. Construct a climograph for each of the 3 locations. Temperature must be plotted as a line
and precipitation as bars. Use the spreadsheet provided to plot all graphs in the form
prescribed above.
Solution
2
Document Page
Figure 1: Climograph for station A
Figure 2: Climograph for station B
3
Document Page
Figure 3: Climograph for station C
4. Describe the seasonal characteristics shown on each climograph i.e. how do temperature
and precipitation change in different months of the year. How does each climograph
differ from Vancouver? Include seasonal patterns, maximum and minimum values, or
any other notable features (e.g. whether precipitation is the form of rain or snow).
a. Kamloops:
i) Seasonal characteristics
Highest temperature are between July and august while lowest are
in January and December
Precipitation highest around June and lowest between February
and April
ii) Major difference from Vancouver
For Vancouver, the precipitation is lowest around June while in
Kamloops it is the highest during this period of time
4
tabler-icon-diamond-filled.svg

Paraphrase This Document

Need a fresh take? Get an instant paraphrase of this document with our AI Paraphraser
Document Page
b. Fort St. John:
i) Seasonal characteristics
Highest temperature are in July while lowest are in January and
December
Precipitation highest around June-July and lowest between January
to April and October to December.
ii) Major difference from Vancouver
For Vancouver, the precipitation is lowest around June while in
Fort St. John it is the highest during this period of time
c. Prince Rupert:
i) Seasonal characteristics
Highest temperature are in July-August while lowest are in January
and December
Precipitation lowest around June-July and highest between October
and December.
ii) Major difference from Vancouver
For Vancouver, the highest precipitation recorded within the
months was slightly above 150mm while in Prince Rupert the
highest precipitation recorded within the months was above
350mm. The lowest precipitation recorded was slightly below
150mm for Prince Rupert while for Vancouver it was below
50mm.
5
Document Page
5. Explain your reasoning for determining which climograph corresponds with which
location. Relate the patterns to the major climate controls discussed in the readings under
the “Climate of BC” forum.
a. Kamloops:
i) Rain shadow (effect of mountains on precipitation amounts received)
Kamloops is located in the rain shadow location and as such it is
expected to have little amount of total annual precipitation
received [2]. It is this logic that I used and came to conclusion that
station B is for Kamloops.
ii) Continentality (How does the interior location affect seasonal changes in
temperature?)
Kamloops is located in the south central British Columbia in
Canada at the confluence of the two branches of the Thompson
River near Kamloops Lake; the temperatures increase as one goes
to the South hence the high temperature levels for Kamloops. This
made it easier to locate station B as Kamloops for that matters.
b. Fort St. John:
i) Rain shadow (effect of mountains on precipitation amounts)
Fort St. John is located in an area with magnificent
Rocky Mountains. The Rocky Mountains causes Fort St. John to
be in a rain shadow [1]. This therefore meant that the area does not
receive much rainfall and hence I presumed the area to have low
6
Document Page
amount of precipitation received (though higher than that of
Kamloops) hence I opted for station A.
ii) Latitude (effect of location on the type of precipitation received)
Fort St. John is located on the latitude 56°14'N which is to the
North Eastern side of British Columbia, Canada; the expectation of
this area is not to have large amounts of precipitations hence the
choice for station A.
c. Prince Rupert:
i) Air masses (effect of air masses on the amount of precipitation received)
Prince Rupert is affected by air masses; in winter and summer for
instance, air masses that affect Prince Rupert originate over the
ocean [3]. These air masses come with much precipitation hence
explaining why the area receives large amounts of precipitation in
both summer and winter; this made it easier to identify station C as
that of Prince Rupert
ii) Maritime effect (effect of ocean on seasonal temperature variation)
Effect of the water (ocean) helps Prince Rupert to have moderate
temperatures. Among the three stations, Station C had moderate
temperature hence it was chosen as Prince Rupert.
7
tabler-icon-diamond-filled.svg

Paraphrase This Document

Need a fresh take? Get an instant paraphrase of this document with our AI Paraphraser
Document Page
References
[1]
Canadian Climate Normals, 2010. Fort St. John A, British Columbia.
[2] Canadian Climate Normals, 2010. Kamloops A.
[3] Canadian Climate Normals, 2010. Prince Rupert A.
[4] Glossary of Meteorology, 2009. Precipitation. American Meteorological Society.
8
chevron_up_icon
1 out of 8
circle_padding
hide_on_mobile
zoom_out_icon
[object Object]