216MAN: Financial Performance Analysis of British Red Cross
VerifiedAdded on 2022/12/09
|12
|3213
|385
Report
AI Summary
This report provides a comprehensive financial analysis of the British Red Cross (BRC), a UK-based charity organization. The analysis focuses on the financial statements of BRC for three consecutive years, utilizing ratio analysis to assess its financial health and performance. The report calculates and interprets various financial ratios, including current ratio, quick ratio, fund-raising efficiency ratio, program efficiency ratio, self-sufficiency ratio, viability ratio, defensive interval, liquid funds indicator, debt ratio, and operating reserve ratio. The interpretation of these ratios reveals trends and insights into BRC's financial position, highlighting areas of strength and weakness. Furthermore, the report explores the economic impact of these financial metrics and identifies key strategic decisions for BRC to improve its financial performance and achieve its charitable objectives. The report also considers the impact on external stakeholders. This report will be useful for students as a learning tool and for anyone interested in charity finance.

ECONOMIC AND FINANCIAL
MANAGEMENT
MANAGEMENT
Paraphrase This Document
Need a fresh take? Get an instant paraphrase of this document with our AI Paraphraser
TABLE OF CONTENTS
INTRODUCTION ..........................................................................................................................1
MAIN BODY...................................................................................................................................1
Ratio analysis...............................................................................................................................1
Interpretation................................................................................................................................3
Key strategic decisions................................................................................................................7
External stakeholder.....................................................................................................................8
CONCLUSION ...............................................................................................................................9
REFERENCES..............................................................................................................................10
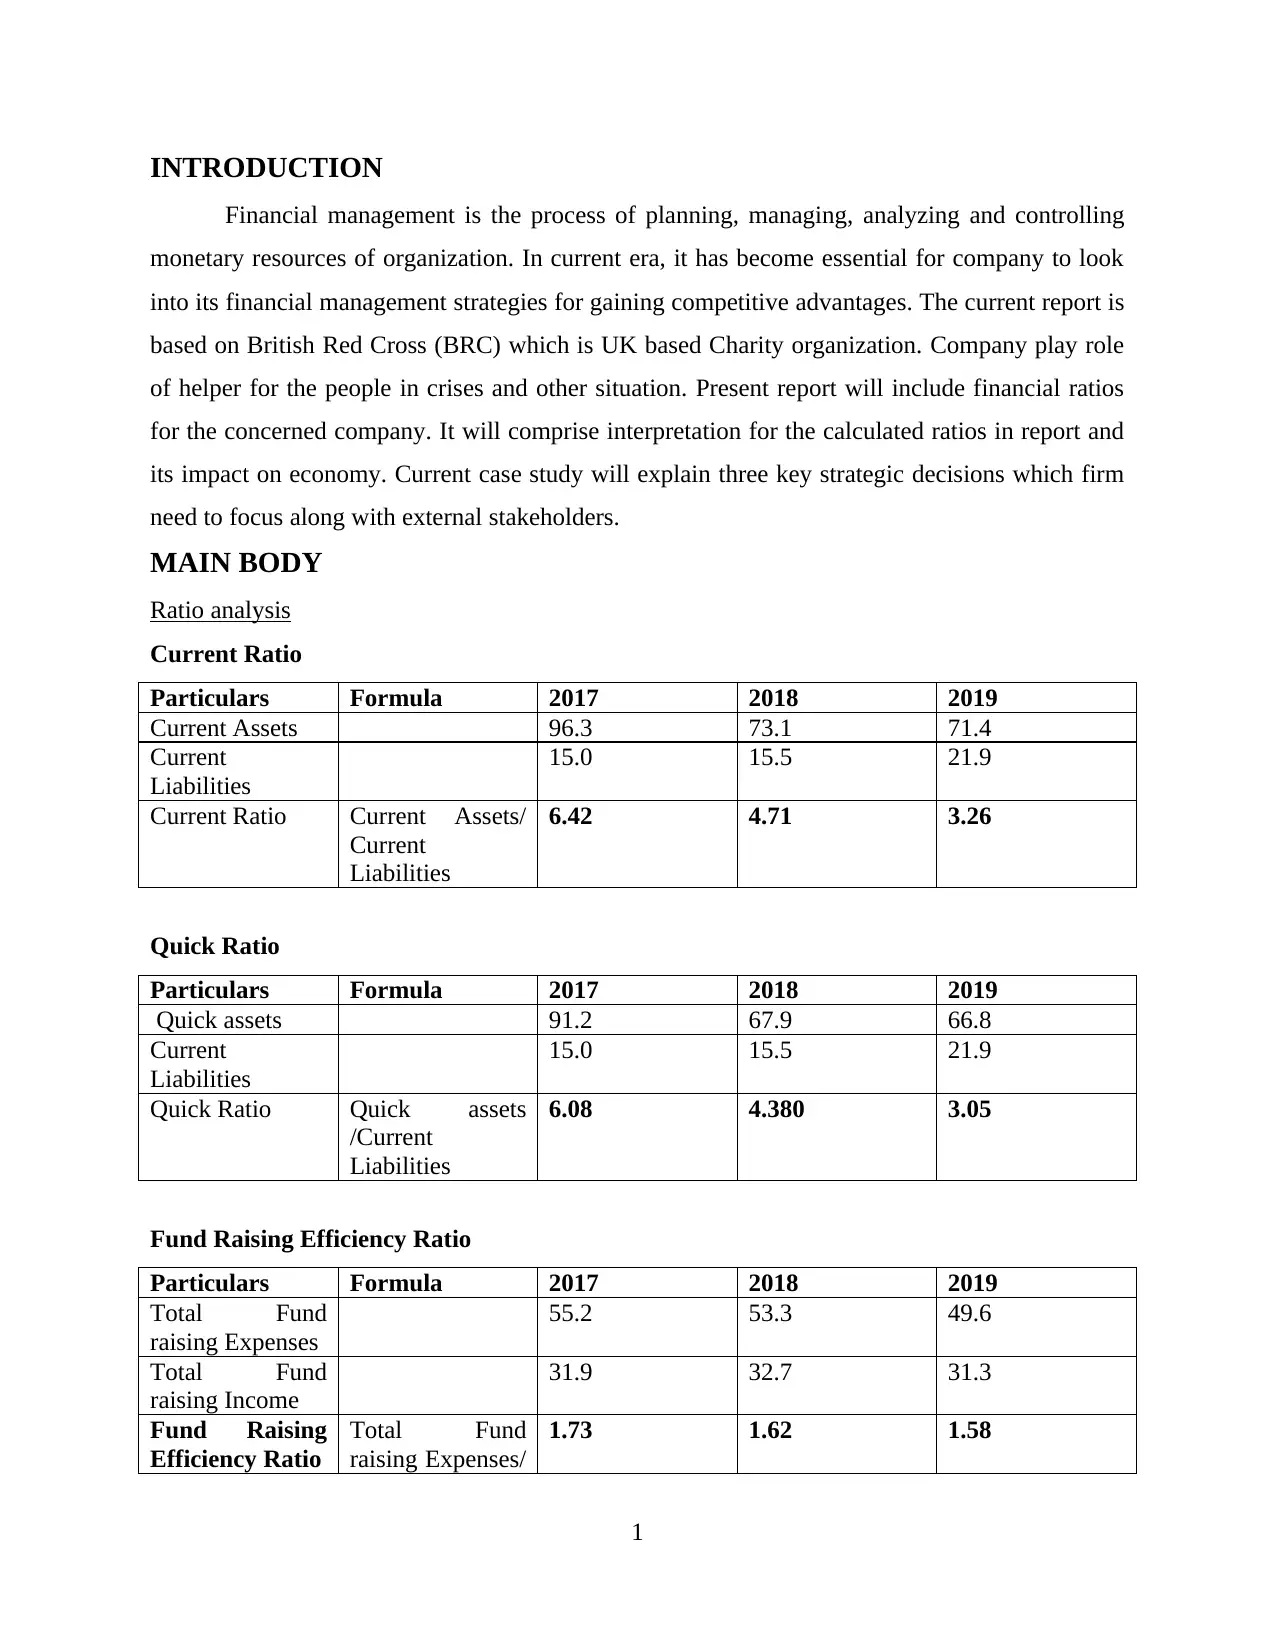
INTRODUCTION
Financial management is the process of planning, managing, analyzing and controlling
monetary resources of organization. In current era, it has become essential for company to look
into its financial management strategies for gaining competitive advantages. The current report is
based on British Red Cross (BRC) which is UK based Charity organization. Company play role
of helper for the people in crises and other situation. Present report will include financial ratios
for the concerned company. It will comprise interpretation for the calculated ratios in report and
its impact on economy. Current case study will explain three key strategic decisions which firm
need to focus along with external stakeholders.
MAIN BODY
Ratio analysis
Current Ratio
Particulars Formula 2017 2018 2019
Current Assets 96.3 73.1 71.4
Current
Liabilities
15.0 15.5 21.9
Current Ratio Current Assets/
Current
Liabilities
6.42 4.71 3.26
Quick Ratio
Particulars Formula 2017 2018 2019
Quick assets 91.2 67.9 66.8
Current
Liabilities
15.0 15.5 21.9
Quick Ratio Quick assets
/Current
Liabilities
6.08 4.380 3.05
Fund Raising Efficiency Ratio
Particulars Formula 2017 2018 2019
Total Fund
raising Expenses
55.2 53.3 49.6
Total Fund
raising Income
31.9 32.7 31.3
Fund Raising
Efficiency Ratio
Total Fund
raising Expenses/
1.73 1.62 1.58
1
⊘ This is a preview!⊘
Do you want full access?
Subscribe today to unlock all pages.
Trusted by 1+ million students worldwide
Total Fund
raising Income
Program Efficiency Ratio
Particulars Formula 2017 2018 2019
Program service
Expenses
220.9 190.6 197.5
Total
expenditure
276.1 243.9 247.1
Program
Efficiency Ratio
Program service
Expenses/ Total
expenditure
0.80 0.78 0.79
Self Sufficiency Ratio
Particulars Formula 2017 2018 2019
Total Earned
income
284.5 243.3 244.9
Total
Expenditure
276.1 243.9 247.1
Self Sufficiency
Ratio
1.030 0.99 0.99
S.N
O RATIOS FORMULA
CALCULATIO
NS
2019 2018 2017
1 Viability Ratio Net assets / Long term debt
1.465
8997
535
1.49
1789
1098
1.48
2463
6441
Net assets 178.4
172.
6
173.
3
Long term debt 121.7
115.
7
116.
9
2
Defensive
Interval
Cash + Marketable securities +Receivables /
Average monthly expenses
4.058
3232
078
4.27
5818
6398
4.95
3829
4405
Cash 4.4 8.6 6.5
Marketable
securities 17.7 16.8 45.9
Receivables 44.7 42.5 38.8
Average 16.46 15.8 18.4
2
Paraphrase This Document
Need a fresh take? Get an instant paraphrase of this document with our AI Paraphraser
monthly
expenses 8 1
3
Liquid Funds
Indicator
Total net assets- Restricted net assets- Fixed assets /
Average monthly expenses
2.788
5783
718
3.29
3450
8816
4.11
1895
7089
Total net assets 178.4
172.
6
173.
3
Restricted net
assets 10 9 6.4
Fixed assets 122.5
111.
3 91.2
Average
monthly
expenses 16.46
15.8
8
18.4
1
4 Debt Ratio Average total debts / Avearge total assets
0.883
4633
778
0.89
1954
6158
0.89
3759
6699
Average total
debts 175.5
172.
95
173.
3
Average total
assets
198.6
5
193.
9
193.
9
5
Operating
Reserve Ratio
Unrestricted net assets- (fixed assets- debt related to
fixed assets) / Annual expenses- depreciation and
amortization
193.5
5711
3079
7
184.
0796
7479
67
187.
3265
9228
27
Unrestricted net
assets 193.9
184.
4
187.
5
Fixed assets 122.5
111.
3 91.2
Debt related to
fixed asset 56.7 52.2 53.9
Annual expenses 197.5
190.
6
220.
9
Depreciation 5.6 6.1 5.8
Amortization 0 0 0
Interpretation
The interpretation of the above table of ratio analysis shows the trend that is followed by
the company and the financial position of the non profit organization and its sustainability in the
market. The information drawn from the above table is:-
3
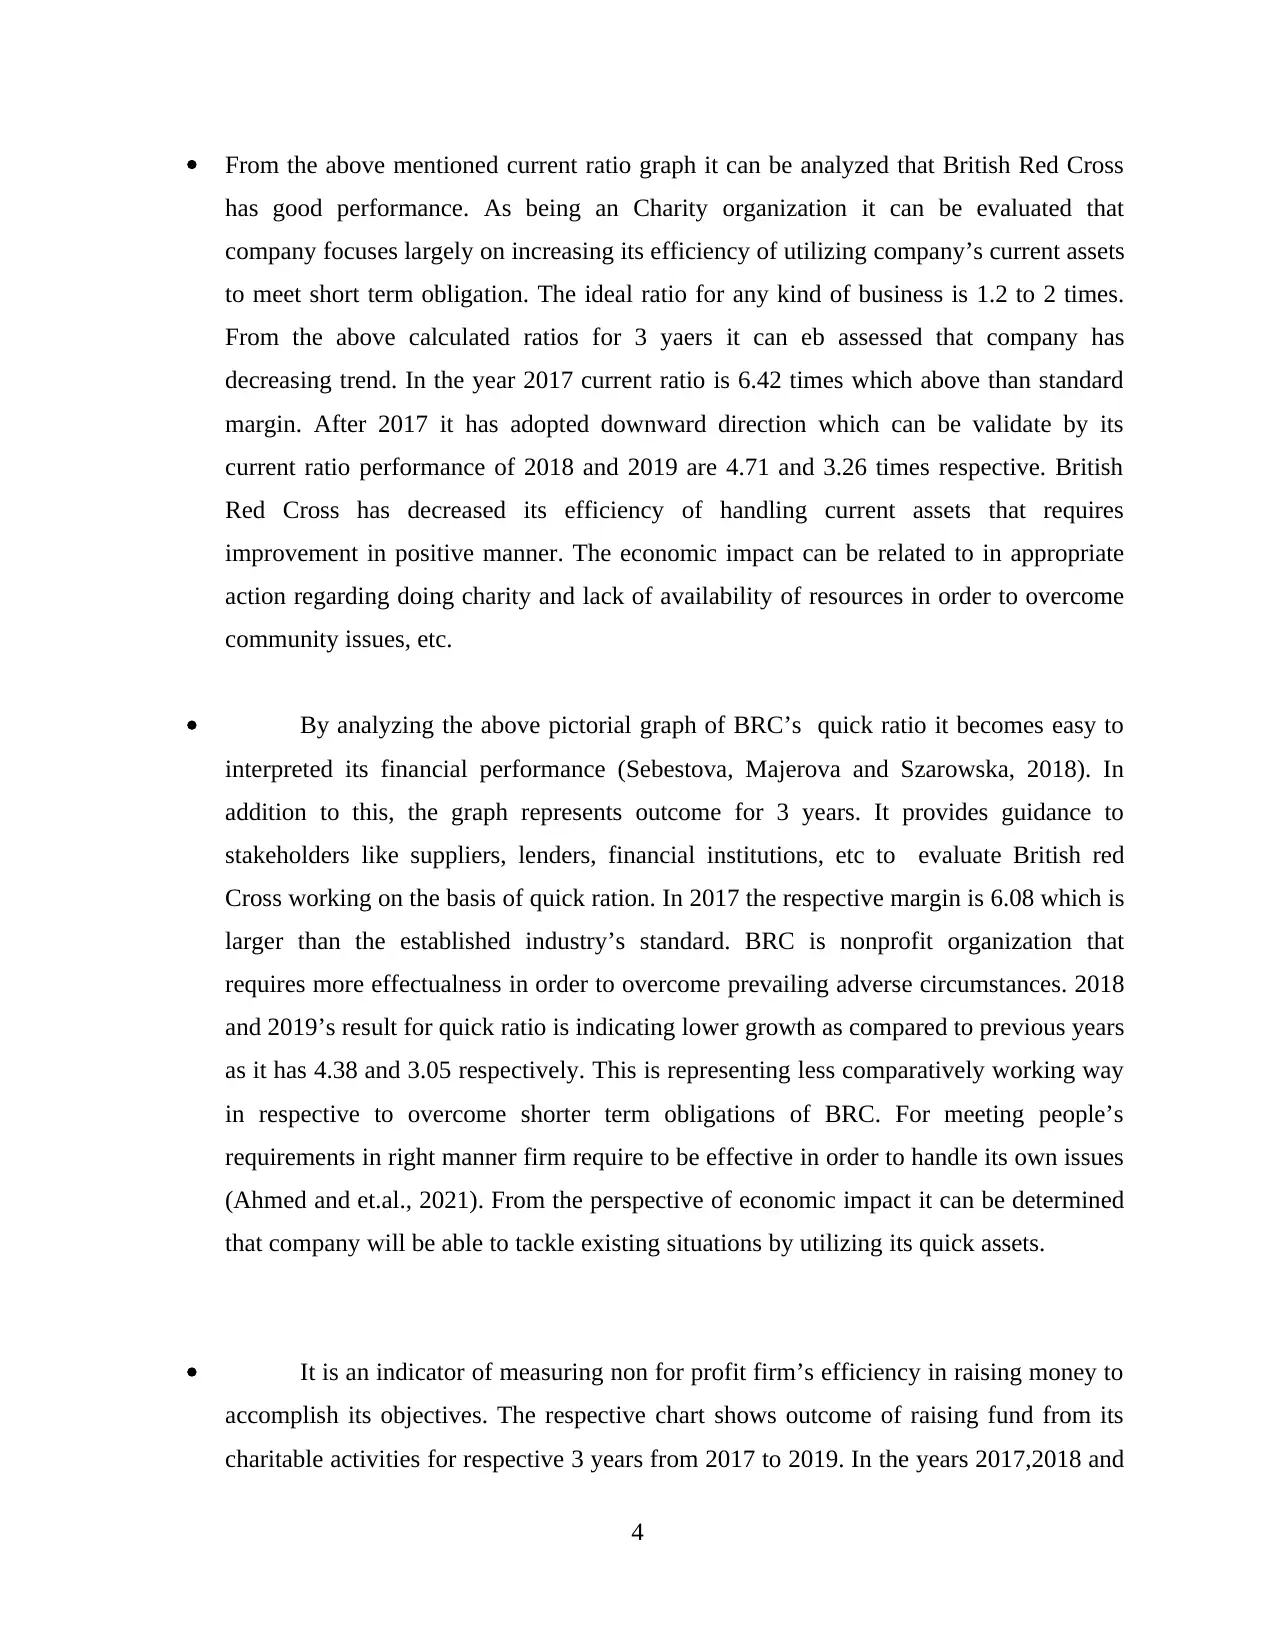
From the above mentioned current ratio graph it can be analyzed that British Red Cross
has good performance. As being an Charity organization it can be evaluated that
company focuses largely on increasing its efficiency of utilizing company’s current assets
to meet short term obligation. The ideal ratio for any kind of business is 1.2 to 2 times.
From the above calculated ratios for 3 yaers it can eb assessed that company has
decreasing trend. In the year 2017 current ratio is 6.42 times which above than standard
margin. After 2017 it has adopted downward direction which can be validate by its
current ratio performance of 2018 and 2019 are 4.71 and 3.26 times respective. British
Red Cross has decreased its efficiency of handling current assets that requires
improvement in positive manner. The economic impact can be related to in appropriate
action regarding doing charity and lack of availability of resources in order to overcome
community issues, etc.
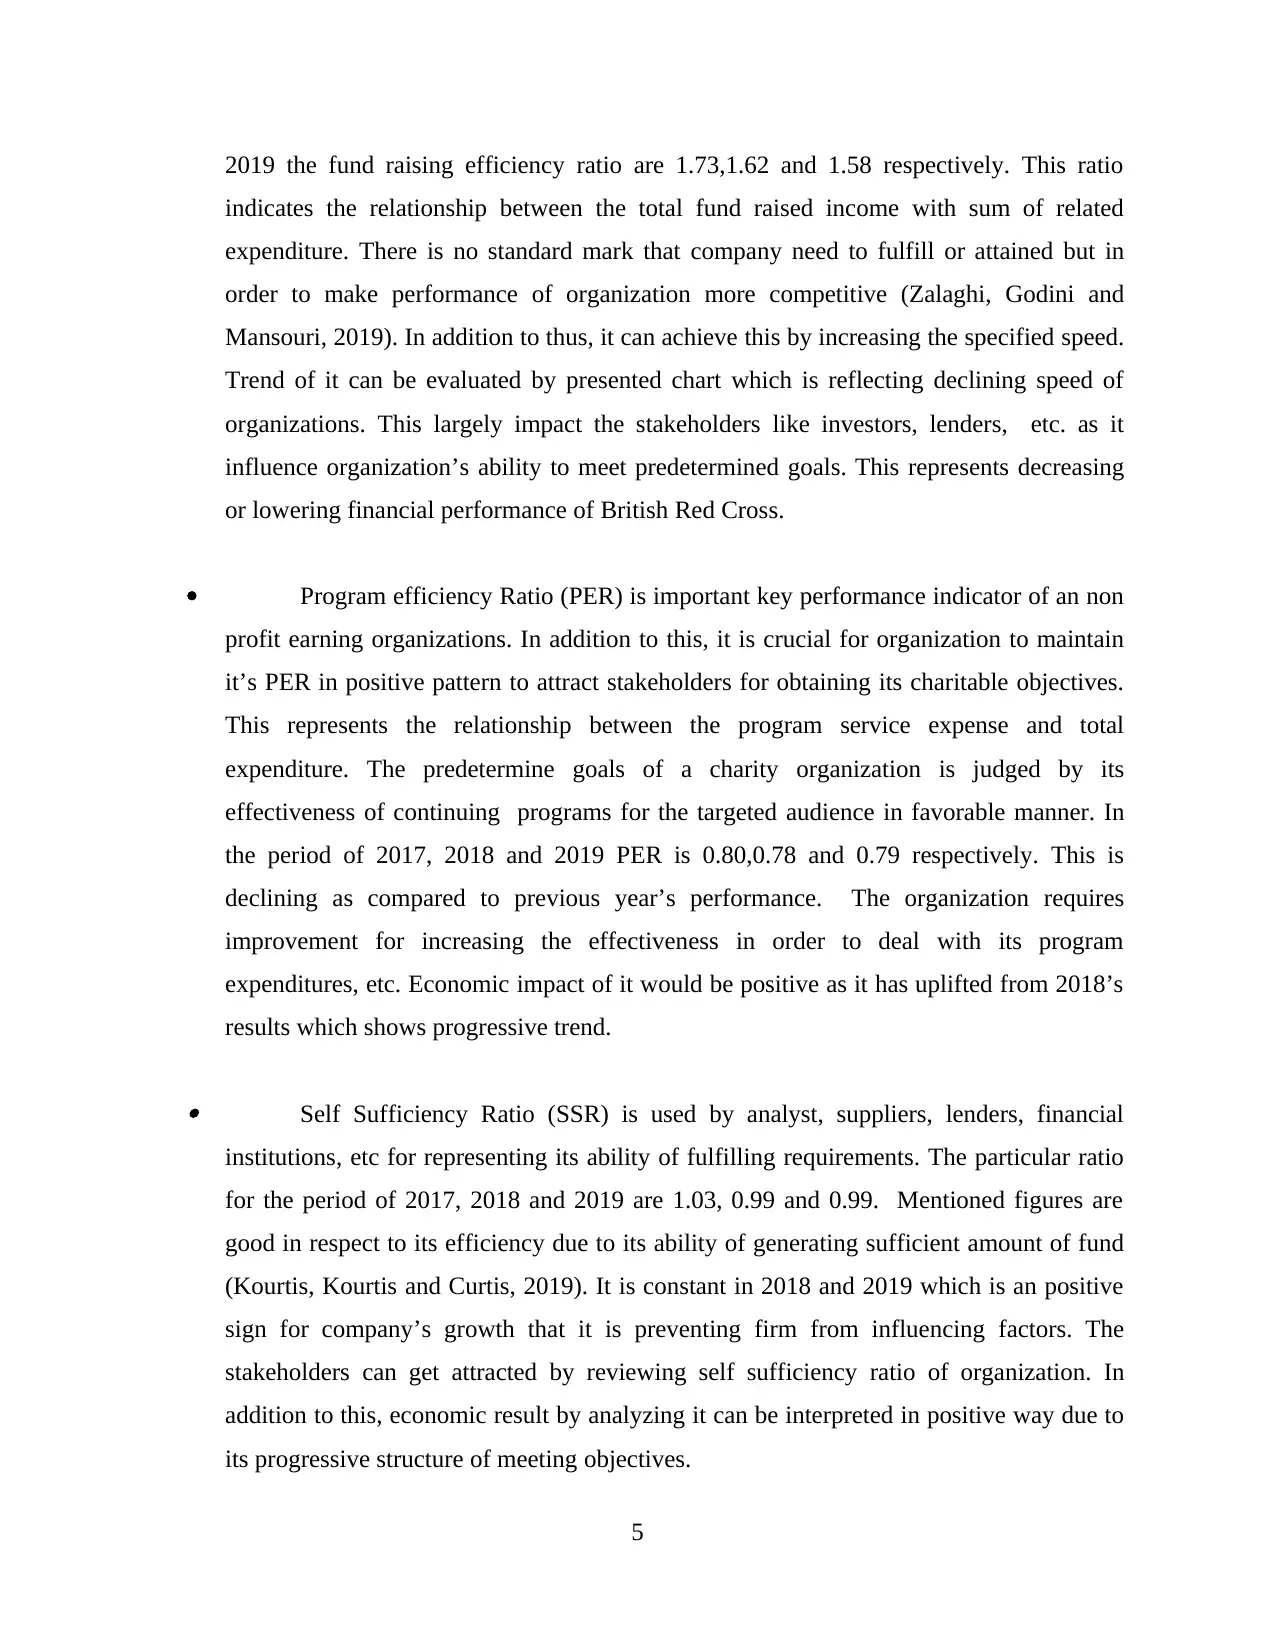
By analyzing the above pictorial graph of BRC’s quick ratio it becomes easy to
interpreted its financial performance (Sebestova, Majerova and Szarowska, 2018). In
addition to this, the graph represents outcome for 3 years. It provides guidance to
stakeholders like suppliers, lenders, financial institutions, etc to evaluate British red
Cross working on the basis of quick ration. In 2017 the respective margin is 6.08 which is
larger than the established industry’s standard. BRC is nonprofit organization that
requires more effectualness in order to overcome prevailing adverse circumstances. 2018
and 2019’s result for quick ratio is indicating lower growth as compared to previous years
as it has 4.38 and 3.05 respectively. This is representing less comparatively working way
in respective to overcome shorter term obligations of BRC. For meeting people’s
requirements in right manner firm require to be effective in order to handle its own issues
(Ahmed and et.al., 2021). From the perspective of economic impact it can be determined
that company will be able to tackle existing situations by utilizing its quick assets.
It is an indicator of measuring non for profit firm’s efficiency in raising money to
accomplish its objectives. The respective chart shows outcome of raising fund from its
charitable activities for respective 3 years from 2017 to 2019. In the years 2017,2018 and
4
has good performance. As being an Charity organization it can be evaluated that
company focuses largely on increasing its efficiency of utilizing company’s current assets
to meet short term obligation. The ideal ratio for any kind of business is 1.2 to 2 times.
From the above calculated ratios for 3 yaers it can eb assessed that company has
decreasing trend. In the year 2017 current ratio is 6.42 times which above than standard
margin. After 2017 it has adopted downward direction which can be validate by its
current ratio performance of 2018 and 2019 are 4.71 and 3.26 times respective. British
Red Cross has decreased its efficiency of handling current assets that requires
improvement in positive manner. The economic impact can be related to in appropriate
action regarding doing charity and lack of availability of resources in order to overcome
community issues, etc.
By analyzing the above pictorial graph of BRC’s quick ratio it becomes easy to
interpreted its financial performance (Sebestova, Majerova and Szarowska, 2018). In
addition to this, the graph represents outcome for 3 years. It provides guidance to
stakeholders like suppliers, lenders, financial institutions, etc to evaluate British red
Cross working on the basis of quick ration. In 2017 the respective margin is 6.08 which is
larger than the established industry’s standard. BRC is nonprofit organization that
requires more effectualness in order to overcome prevailing adverse circumstances. 2018
and 2019’s result for quick ratio is indicating lower growth as compared to previous years
as it has 4.38 and 3.05 respectively. This is representing less comparatively working way
in respective to overcome shorter term obligations of BRC. For meeting people’s
requirements in right manner firm require to be effective in order to handle its own issues
(Ahmed and et.al., 2021). From the perspective of economic impact it can be determined
that company will be able to tackle existing situations by utilizing its quick assets.
It is an indicator of measuring non for profit firm’s efficiency in raising money to
accomplish its objectives. The respective chart shows outcome of raising fund from its
charitable activities for respective 3 years from 2017 to 2019. In the years 2017,2018 and
4
⊘ This is a preview!⊘
Do you want full access?
Subscribe today to unlock all pages.
Trusted by 1+ million students worldwide
2019 the fund raising efficiency ratio are 1.73,1.62 and 1.58 respectively. This ratio
indicates the relationship between the total fund raised income with sum of related
expenditure. There is no standard mark that company need to fulfill or attained but in
order to make performance of organization more competitive (Zalaghi, Godini and
Mansouri, 2019). In addition to thus, it can achieve this by increasing the specified speed.
Trend of it can be evaluated by presented chart which is reflecting declining speed of
organizations. This largely impact the stakeholders like investors, lenders, etc. as it
influence organization’s ability to meet predetermined goals. This represents decreasing
or lowering financial performance of British Red Cross.
Program efficiency Ratio (PER) is important key performance indicator of an non
profit earning organizations. In addition to this, it is crucial for organization to maintain
it’s PER in positive pattern to attract stakeholders for obtaining its charitable objectives.
This represents the relationship between the program service expense and total
expenditure. The predetermine goals of a charity organization is judged by its
effectiveness of continuing programs for the targeted audience in favorable manner. In
the period of 2017, 2018 and 2019 PER is 0.80,0.78 and 0.79 respectively. This is
declining as compared to previous year’s performance. The organization requires
improvement for increasing the effectiveness in order to deal with its program
expenditures, etc. Economic impact of it would be positive as it has uplifted from 2018’s
results which shows progressive trend.
Self Sufficiency Ratio (SSR) is used by analyst, suppliers, lenders, financial
institutions, etc for representing its ability of fulfilling requirements. The particular ratio
for the period of 2017, 2018 and 2019 are 1.03, 0.99 and 0.99. Mentioned figures are
good in respect to its efficiency due to its ability of generating sufficient amount of fund
(Kourtis, Kourtis and Curtis, 2019). It is constant in 2018 and 2019 which is an positive
sign for company’s growth that it is preventing firm from influencing factors. The
stakeholders can get attracted by reviewing self sufficiency ratio of organization. In
addition to this, economic result by analyzing it can be interpreted in positive way due to
its progressive structure of meeting objectives.
5
Paraphrase This Document
Need a fresh take? Get an instant paraphrase of this document with our AI Paraphraser
Viability ratio:- The viability ratio is calculated in relation to the not for profit
organization depicting its financial strength and liquidity position in order to cover the
debts and obligations of the business. It shall be considering the various expandable
assets of the business that can be liquidated or are already in the form of cash and cash
equivalents in the business. It shall be measuring the sufficiency of these assets in order
to fulfil the long term obligations of the organization. The data in the table above shows
that such ratio is positive for the company as it can be said that the availability of the
assets is approximately 1.5 times of the liabilities. Such ratio is lowest in the recent year
2019 of 1.465 which shows a declining trend of efficiency for the company. Defensive interval:- The defence interval is another major ratio that is used to compare
the performance of the not for profit organization. This interval indicates the time period
which the organization can survive without the incorporation of the additional funds into
the business. It calculates the couple of months when the routine operations of the
business can be smoothly undertaken even though the business is unable to receive any
funds (Algharabat and et.al., 2018). The statistics of the company as gathered from its
financial statements shows that there is a declining graph in respect of this particular
ratio. This is because from 5 in 2017 the ratio has dropped down to 4 in the year 2019
showing the poor solvency position of the business. The most probable reason for this
sharp fall is estimated to be the decrease in the amount of marketable securities. Liquid funds indicator:- The liquid funds indicator is in proximity with the defence
interval ratio that is calculated by the business. The only major difference is that it takes
into consideration the liquid assets which are easily convertible to cash, required to meet
the expenses and obligations of the organization in absence of additional funds being
received. For this purpose it shall be removing the restricted assets that can be put to the
specific use through the company. And the fixed assets are also removed as they can take
higher time to get converted to cash. As per the financials of the British red cross charity
organization it can be assessed that the company is moving in the negative direction
pertaining to this ratio. From 4.11 in the year 2017 it has dropped down to 2.78 in the
year 2019 which is again alarming for the company and should plan strategically to
resolve the issue of the business.
6
Debt ratio:- The debt ratio of the business shows the proportion of the total assets of the
organization that are financed by the debt securities or the borrowed funds of the business
(Kim, 2017). Higher is such proportion for the company higher shall be the risk that is
being assumed in terms of liquidity problems that are to be arising in future, insufficient
profits in the business and the reduced capacity of the future borrowing by the company.
The data pertaining to the company shows that this ratio is consistent for the business and
has neither increased nor decreased for the business. Over the past three years he business
has been generating the similar debt ratio.
Operating reserve ratio:- This is one of the essential ratios that shall be indicating the
operational efficiency and the capacity of the business in order to survive without any
revenues earned over the raised funds. This is commonly set as the benchmark by the
non-profit organization which helps in knowing the time for which the company can
manage without having any revenues. This ratio is showing the positive signal for the
company as the time period is increasing over the span of three years indicating
operational efficiency.
Key strategic decisions
The company has good financial performance but requires some improvement for accomplishing
its chartable objectives. In addition to this, taking 3 strategic decisions can provide guidance for
moving towards success. The decisions are mentioned below:
Diverse Funding Sources
The basis strategy for improving the financial performance of company is related with
charitable organization should be based on those actions that increases its efficiency.
Diversifying funding sources is one of the best strategy which can assist business to incline its
financial performance. Depending on particular sources can make the funding of company less
competitive as this makes the firm to rely on this particular system for meeting financial
requirements. Diversifying provides the benefit of reducing risk of lack of monetary resources,
increases chance to acquire unforeseen changing circumstances of economy, etc. There are
various types of reasons that supports nonprofit organizations effectiveness. For this purpose
company need to maintain good records fro attracting shareholders in order to make huge
investment for charitable reasons.
This will aid BRC to respond financial problems in better pattern as compared to
7
⊘ This is a preview!⊘
Do you want full access?
Subscribe today to unlock all pages.
Trusted by 1+ million students worldwide
previous. In addition to this, involving different names for charitable reason increases goodwill
of organization (Schiltz, De Witte and Mazrekaj, 2020). Inclination of funds provides
opportunity to accomplish goals of firm in effectual pattern as they will be able to spend
positively on programs service. The specified charity organization should use varying platforms
for increasing its economic performance to get favorable impact on its operational activity
(Developing diverse fund sources, 2021). Income from different systems, structures,
relationships, and communications improves firm’s self, program, operational and other
efficiency.
Assessment of Program Cost
Obtaining required financial information in order to evaluate the needed fund fro
established programs. The budgeting is one of the significant method for determining the
program cost. In addition to this, it will help firm to assess the actual requirement of expenses
which is needed to accomplish its objective of doing charity.
Fund raising accordingly becomes possible after analyzing the program cost. Objective of
overcoming community problems is one of the foremost goal of British red Cross. It can be
attained by assessing the program cost which will modify the current financial performance
that’s going in decreasing direction. The stakeholders get negatively impacted from this way of
representing of organization’s performance. To overcome such negative perception of
stakeholders company can use strategy of assessing its program cost at initial stage for
accomplishing goals. Making a structure through budgeting gives assistance to BRC to derive
required funds to appropriately attain established programs.
Maintaining the liquidity and working capital cycle
The management of the liquidity position and the management of working capital
efficiently shall be securing the business for future times when they are unable to raise additional
funds or generate revenue funds for the company (Mitchell, 2017). The cash and cash
equivalents of the business must be effectively handled by the company.
External stakeholder
Government is one of the crucial external stakeholder who has to get satisfied by the
performance of the non-profit organization. They are to be monitored to arrange the funds in the
form of restricted and unrestricted government grants for facilitating the operations of the
8
Paraphrase This Document
Need a fresh take? Get an instant paraphrase of this document with our AI Paraphraser
business (Zietlow and et.al., 2018). Apart from that in order to avoid the interference they have
to function properly at apply the funds to the provided use.
CONCLUSION
From the above report it can be concluded that chosen charity organization in current
report is BRC. The financial ratios of nonprofit firm have been shown in current case study with
its interpretation regarding financial as well economic performance. The present report
comprises current, quick, self sufficiency, program efficiency, etc ratios. Current case study has
given emphasis on strategic decisions for improving present performance of BRC. This involves
diverse fund sources, assessment of program cost with budgeting, etc. It has also presented the
external stakeholders as audience.
9
REFERENCES
Books and Journals
Ahmed, B and et.al., 2021. Does Firm Life Cycle Impact Corporate Investment
Efficiency?. Sustainability. 13(1). p.197.
Algharabat, R. and et.al., 2018. The effect of telepresence, social presence and involvement on
consumer brand engagement: An empirical study of non-profit organizations. Journal of
Retailing and Consumer Services. 40. pp.139-149.
Kim, M., 2017. The relationship of nonprofits’ financial health to program outcomes: Empirical
evidence from nonprofit arts organizations. Nonprofit and Voluntary Sector
Quarterly. 46(3). pp.525-548.
Kourtis, E., Kourtis, G. and Curtis, P., 2019. Αn Integrated Financial Ratio Analysis as a
Navigation Compass through the Fraudulent Reporting Conundrum: Α Case
Study. International Journal of Finance, Insurance and Risk Management. 9(1-2).
pp.3-20.
Mitchell, G. E., 2017. Fiscal leanness and fiscal responsiveness: Exploring the normative limits
of strategic nonprofit financial management. Administration & Society. 49(9). pp.1272-
1296.
Schiltz, F., De Witte, K. and Mazrekaj, D., 2020. Managerial efficiency and efficiency
differentials in adult education: a conditional and bias-corrected efficiency
analysis. Annals of Operations Research. 288(2). pp.529-546.
Sebestova, J., Majerova, I. and Szarowska, I., 2018. Indicators for assessing the financial
condition and municipality management. Administration & Public Management Review.
(31).
Zalaghi, H., Godini, M. and Mansouri, K., 2019. The moderating role of firms characteristics on
the relationship between working capital management and financial
performance. Advances in Mathematical Finance and Applications. 4(1). pp.71-88.
Zietlow, J. and et.al., 2018. Financial management for nonprofit organizations: policies and
practices. John Wiley & Sons.
Online
Developing diverse fund sources. 2021. [Online] Available through: <
https://www.hhcpa.com/blogs/non-profit-accounting-services/developing-diverse-
funding-sources/>
10
⊘ This is a preview!⊘
Do you want full access?
Subscribe today to unlock all pages.
Trusted by 1+ million students worldwide
1 out of 12
Related Documents


Your All-in-One AI-Powered Toolkit for Academic Success.
+13062052269
info@desklib.com
Available 24*7 on WhatsApp / Email
![[object Object]](/_next/static/media/star-bottom.7253800d.svg)
Unlock your academic potential
Copyright © 2020–2026 A2Z Services. All Rights Reserved. Developed and managed by ZUCOL.