Financial Analysis of Britvic PLC: Key Ratios and Performance
VerifiedAdded on 2021/02/19
|20
|4634
|59
Report
AI Summary
This report presents a financial analysis of Britvic PLC, a soft drink manufacturer, evaluating its performance from 2015 to 2017. The analysis includes a brief overview of the company, its current mid-term outlook, and a comparison with its competitor, Fever tree plc. Key financial ratios, such as profitability (gross profit, net profit, operating profit, and return on equity), liquidity (current and quick ratios), and efficiency ratios (inventory turnover, fixed assets turnover, and assets turnover) are calculated and assessed to evaluate Britvic's financial position. The report also examines the company's approach to working capital management. The analysis reveals insights into Britvic's strengths and weaknesses relative to its competitor, highlighting trends and providing an overall evaluation of its financial health and strategic decisions within the soft drink industry.

FINANCIAL
ANALYSIS
ANALYSIS
Paraphrase This Document
Need a fresh take? Get an instant paraphrase of this document with our AI Paraphraser

Table of Contents
INTRODUCTION ..........................................................................................................................3
MAIN BODY...................................................................................................................................3
Question 1........................................................................................................................................3
(a) Brief introduction about company and current mid term outlook....................................3
(b) Calculation of key financial ratios of Britvic and its competitor company......................4
(c) Evaluation of financial position of Britvic plc..................................................................9
(d) Company's approach to working capital management...................................................13
Question 2......................................................................................................................................14
CONCLUSION..............................................................................................................................16
REFERENCES..............................................................................................................................18

INTRODUCTION
The term financial analysis can be defined as a kind of analysis in which company's
financial position is evaluated with help of various kind of financial statements and ratios
(Williams and Dobelman, 2017). This kind of analysis is useful for not only to the internal
stakeholders but also for external stakeholders. It is so because with the help of proper evaluation
of financial position of company, they make decision regarding to investment. Under the project
report, Britvic company's financial analysis is done with the help of financial ratios and financial
statements. In addition, company's approach towards the working capital management is also
described.
MAIN BODY
Question 1.
(a) Brief introduction about company and current mid term outlook.
The Britvic plc operates in production of soft drinks and it is based in Hemel Hempstead.
This company manufactures a wide range of soft drinks under own name (Revelli and Viviani,
2015). It was founded in year 1845 and its headquarter is at Hertfordshire, United Kingdom. The
company is listed on London stock exchange. The company's CEO is “Simon Lither-land”
appointed on February, 2013. They operate their operations in various countries such as United
Kingdom, Ireland, France and Brazil. Though most of their operations are operated in United
Kingdom and Ireland. The ownership of company is public as well as their major products are
Britvic 55, Robinsons, Tango, J2O, UK and Ireland licensee of Pepsi Co products. As per the
financial information of year 2018, their revenue is of £ 1503.6 million and net income is of £
166.1 million (About Britvic plc, 2019). In addition, the company focus on below mentioned
three activities that are as follows:
Production of soft drinks without any compromise with taste and quality.
Regular innovation in products and ranges. Motivating and educating to customers with help of power of brand.
In recent three to five years, company has achieved many milestones which they targeted such
as:
Acquisition of east coast in Ireland that is enhancing the brand image.
Launching of Teisseire fruit shoot in France.
⊘ This is a preview!⊘
Do you want full access?
Subscribe today to unlock all pages.
Trusted by 1+ million students worldwide

Launching of fruit shoot hydro sparkling in United states of America.
Acquisition with Bela Ischia to increase the market growth in the Brazil.
The future goal of Britvic company are as follows:
The company is focusing to launch two new Robinson range that are fruit creation and
cordials.
Try to increase the supply of soft drinks in supermarket of USA (Wagner, Block, 2015).
(b) Calculation of key financial ratios of Britvic and its competitor company.
Ratio analysis- It can be defined as a kind of technique for financial analysis in which
various kind of ratios such as profitability, efficiency ratio etc. are calculated and analysed
(Vogel, 2016). Herein, comparison of Britvic plc and its competitor company, Fever tree plc is
done in terms of ratio analysis:
1. Profitability ratio:
Gross profit ratio- Gross profit / net sales x 100
Ratio of Britvic plc:
Particulars Year 2015 Year 2016 Year 2017
Gross profit 719 772 817
Net sales 1300 1431 1540
Calculation 719/1300*100 772/1431*100 817/1540*100
Gross profit ratio 55.30% 53.94% 53.05%
Ratio of Fever tree plc:
Gross profit ratio 51.10% 55.20% 53.50%
Analysis- Britvic company's gross profit ratio is quite decreasing in these three years like in
year 2015 it was of 55.30% that decreased and became of 53.94% in year 2016. As well as in
year 2017, it was of 53.05%. While competitor company's ratio is fluctuating in all three years
such as in year 2015, it was of 51.10% that raised and became of 55.20% in 2016, then decreased
in next year. So as per above analysis, Fever tree plc seems better as compare to Britvic plc.
Paraphrase This Document
Need a fresh take? Get an instant paraphrase of this document with our AI Paraphraser

Net profit ratio- Net profit / net sales x 100
Ratio of Britvic plc:
Particulars Year 2015 Year 2016 Year 2017
Net profit 104 115 112
Net sales 1300 1431 1540
Calculation 104/1300*100 115/1431*100 112/1540*100
Net profit ratio 8.00% 8.03% 7.27%
Ratio of Fever tree plc:
Net profit ratio 22.50% 26.90% 26.74%
Analysis- As per the above analysis of both companies ratio, this can be find out that net
profit ratio of Britvic company, is similar in both year 2015 and 2016. While in year 2017, this
ratio decreased and became of 7.27%. On the other hand, competitive company's ratio is much
better and higher. Their ratio is of 22.50, 26.90 and 26.74 % in all three years 2015, 2016 and
2017 respectively. So it can be analysed that Fever tree plc is in better position.
Operating profit ratio- Operating profit / net sales x 100
Ratio of Britvic plc:
Particulars Year 2015 Year 2016 Year 2017
Operating profit 169 178 163
Net sales 1300 1431 1540
Calculation 169/1300*100 178/1431*100 163/1540*100
Operating profit ratio 13.00% 12.44% 10.58%
Ratio of Fever tree plc:
Operating profit ratio 29.14% 33.62% 33.15%
Ratio of Britvic plc:
Particulars Year 2015 Year 2016 Year 2017
Net profit 104 115 112
Net sales 1300 1431 1540
Calculation 104/1300*100 115/1431*100 112/1540*100
Net profit ratio 8.00% 8.03% 7.27%
Ratio of Fever tree plc:
Net profit ratio 22.50% 26.90% 26.74%
Analysis- As per the above analysis of both companies ratio, this can be find out that net
profit ratio of Britvic company, is similar in both year 2015 and 2016. While in year 2017, this
ratio decreased and became of 7.27%. On the other hand, competitive company's ratio is much
better and higher. Their ratio is of 22.50, 26.90 and 26.74 % in all three years 2015, 2016 and
2017 respectively. So it can be analysed that Fever tree plc is in better position.
Operating profit ratio- Operating profit / net sales x 100
Ratio of Britvic plc:
Particulars Year 2015 Year 2016 Year 2017
Operating profit 169 178 163
Net sales 1300 1431 1540
Calculation 169/1300*100 178/1431*100 163/1540*100
Operating profit ratio 13.00% 12.44% 10.58%
Ratio of Fever tree plc:
Operating profit ratio 29.14% 33.62% 33.15%

Analysis- On the basis of above table this can be addressed that Britvic company's operating
profit ratio is continuously decreasing. Such as in year 2015, this was of 13% that decreased in
next year and became of 12.44% in year 2016. As well as in year 2017, it became of 10.58%. In
compare, Fever tree plc company's ratio is increasing in all three years and higher. Their ratio is
of 29.14, 33.62 and 33.15% in year 2015, 2016 and 2017 respectively. Hence, it can be
interpreted that fever tree plc's financial position is better as compare to Britvic.
Return on equity ratio- Net income/ shareholder's equity x 100
Ratio of Britvic plc:
Particulars Year 2015 Year 2016 Year 2017
Net income 104 115 112
Shareholder's equity 212 281 339
Calculation 104/212*100 115/281*100 112/339*100
Return on equity ratio 49.05% 40.92% 33.03%
Ratio of Fever tree plc:
Return on equity ratio 22.46% 35.62% 41.55%
Analysis- On the basis of above table, this can be analysed that Britvic company's ROE
is of 49.05% in year 2015 which decreased in next two years and became of 40.92% in year
2016. As well as 33.03% in year 2017. In compare, fever plc 's ROE ratio is lower that is of
22.46, 35.62 and 41.55% in year 2015, 2016 and 2017 respectively. Due to this, it can be
analysed in term of ability of providing return on equity the Britvic plc is better. (H udson,
2017).
2. Liquidity ratio:
Current ratio- Current assets / current liabilities
Ratio of Britvic plc:
Particulars Year 2015 Year 2016 Year 2017
⊘ This is a preview!⊘
Do you want full access?
Subscribe today to unlock all pages.
Trusted by 1+ million students worldwide

Current assets 635 724 572
Current liabilities 459 779 618
Calculation 635/459 724/779 572/618
Current ratio 1.38:1 0.92:1 0.92:1
Ratio of Fever tree plc:
Current ratio 3.37 3.54 3.54
Analysis- The current ratio of Britvic company in all three years is not as per ideal ratio that
is of 2:1 times. In year 2015, it was of 1.38:1 that decreased in next year and became of 0.92:1
and remain same in year 2017. In compare, the fever tree plc 's liquidity position is strong in all
three years. As well as meeting the ideal ratio criteria. It is so because their ratio is of 3.37:1,
3.54:1 and 3.54:1 times in year 2015, 2016 and 2017. This indicates that fever tree plc 's ability
to pay short-term debts is better in compare to Britvic plc.
Quick ratio- Quick assets/ current liabilities
Ratio of Britvic plc:
Particulars Year 2015 Year 2016 Year 2017
Quick assets 533 588 404
Current liabilities 459 779 618
Calculation 533/459 588/779 404/618
Quick ratio 1.16:1 0.75:1 0.65:1
Ratio of Fever tree plc:
Quick ratio 2.73 2.96 3.07
Analysis- On the basis of above table, this can be find out that Britvic company's quick
ratio is of 1.16:1 in year 2015 that decreased and became of 0.75:1 in year 2016. As well as in
year 2017, it was of 0.65:1. While competitive company's quick ratio is meeting with ideal ratio
Current liabilities 459 779 618
Calculation 635/459 724/779 572/618
Current ratio 1.38:1 0.92:1 0.92:1
Ratio of Fever tree plc:
Current ratio 3.37 3.54 3.54
Analysis- The current ratio of Britvic company in all three years is not as per ideal ratio that
is of 2:1 times. In year 2015, it was of 1.38:1 that decreased in next year and became of 0.92:1
and remain same in year 2017. In compare, the fever tree plc 's liquidity position is strong in all
three years. As well as meeting the ideal ratio criteria. It is so because their ratio is of 3.37:1,
3.54:1 and 3.54:1 times in year 2015, 2016 and 2017. This indicates that fever tree plc 's ability
to pay short-term debts is better in compare to Britvic plc.
Quick ratio- Quick assets/ current liabilities
Ratio of Britvic plc:
Particulars Year 2015 Year 2016 Year 2017
Quick assets 533 588 404
Current liabilities 459 779 618
Calculation 533/459 588/779 404/618
Quick ratio 1.16:1 0.75:1 0.65:1
Ratio of Fever tree plc:
Quick ratio 2.73 2.96 3.07
Analysis- On the basis of above table, this can be find out that Britvic company's quick
ratio is of 1.16:1 in year 2015 that decreased and became of 0.75:1 in year 2016. As well as in
year 2017, it was of 0.65:1. While competitive company's quick ratio is meeting with ideal ratio
Paraphrase This Document
Need a fresh take? Get an instant paraphrase of this document with our AI Paraphraser

and higher then Britvic. Their quick ratio is 2.73, 2.96 and 3.07 times in all three years 2015,
2016 and 2017. Hence, this can be analysed that fever tree plc 's liquidity position is better than
to Britvic.
3. Efficiency ratio:
Inventory turn over ratio- Cost of goods sold/ average inventory
Ratio of Britvic plc:
Particulars Year 2015 Year 2016 Year 2017
Cost of goods sold 581 659 724
Average inventory 87 113 147
Calculation 581/87 659/113 724/147
Inventory turn over ratio 6.67 5.83 4.92
Ratio of Fever tree plc:
Inventory turn over ratio 5.29 5.42 6.66
Analysis- On the basis of above inventory turn over ratio of Britvic plc, this can be assessed
that in 2015, this ratio is of 6.67 that decreased and became of 5.83 in next year 2016. As well as
4.92 in year 2017. While their competitive company, Fever tree plc 's ratio is of 5.29, 5.42 and
6.66 in year 2015, 2016 and 2017. This shows that their ratio is lower. So it can be analysed that,
fever tree plc is in better position because the ideal inventory turn over ratio is between 4 to 6.
Fixed assets turn over ratio- Net sales / (Fixed assets-depreciation)
Ratio of Britvic plc:
Particulars Year 2015 Year 2016 Year 2017
Net sales 1300 1431 1540
Fixed assets-depreciation 244-41= 203 382-50= 332 462-59= 403
Calculation 1300/203 1431/332 1540/403
Fixed assets turn over ratio 6.4 4.31 3.82

Ratio of Fever tree plc:
Fixed assets turn over ratio 125.92 116.68 107.75
Analysis- The fixed assets turn over ratio of Britvic plc is of 6.4 in year 2015 which
decreased in next year 2016 and became of 4.31. As well as in year 2017, it was of 3.82. In
comparison, fever tree plc 's ratio is of 125.92, 116.8 and 107.75 in all three years 2015, 2016
and 2017. This indicates that, they are making sales and purchase of their fixed assets in a
repetitive manner. Hence, fever tree plc 's position is better due to effective flow of fund in all
three years.
Assets turn over ratio- Net sales/ total assets
Ratio of Britvic plc:
Particulars Year 2015 Year 2016 Year 2017
Net sales 1300 1431 1540
Total assets 1299 1634 1613
Calculation 1300/1299 1431/1634 1540/1613
Assets turn over ratio 1 0.87 0.95
Ratio of Fever tree plc:
Assets turn over ratio 0.78 1.01 1.17
Analysis- The assets turn over ratio of Britvic plc is unequal in all three years. This is so
because in year 2015, it was of 1 that decreased and became of 0.87 in year 2016. As well as in
year 2017, it again increased and became of 0.95. On the other hand, fever tree plc 's ratio is
higher and that is of 0.78 in year 2015 and 1.01 in 2016. As well as in year 2017, it was of 1.17.
Due to this, it can be find out that fever tree plc is in better condition as compared to Britvic plc.
(c) Evaluation of financial position of Britvic plc.
Income statement of Britvic plc (About Britvic plc financial statements, 2019):
⊘ This is a preview!⊘
Do you want full access?
Subscribe today to unlock all pages.
Trusted by 1+ million students worldwide
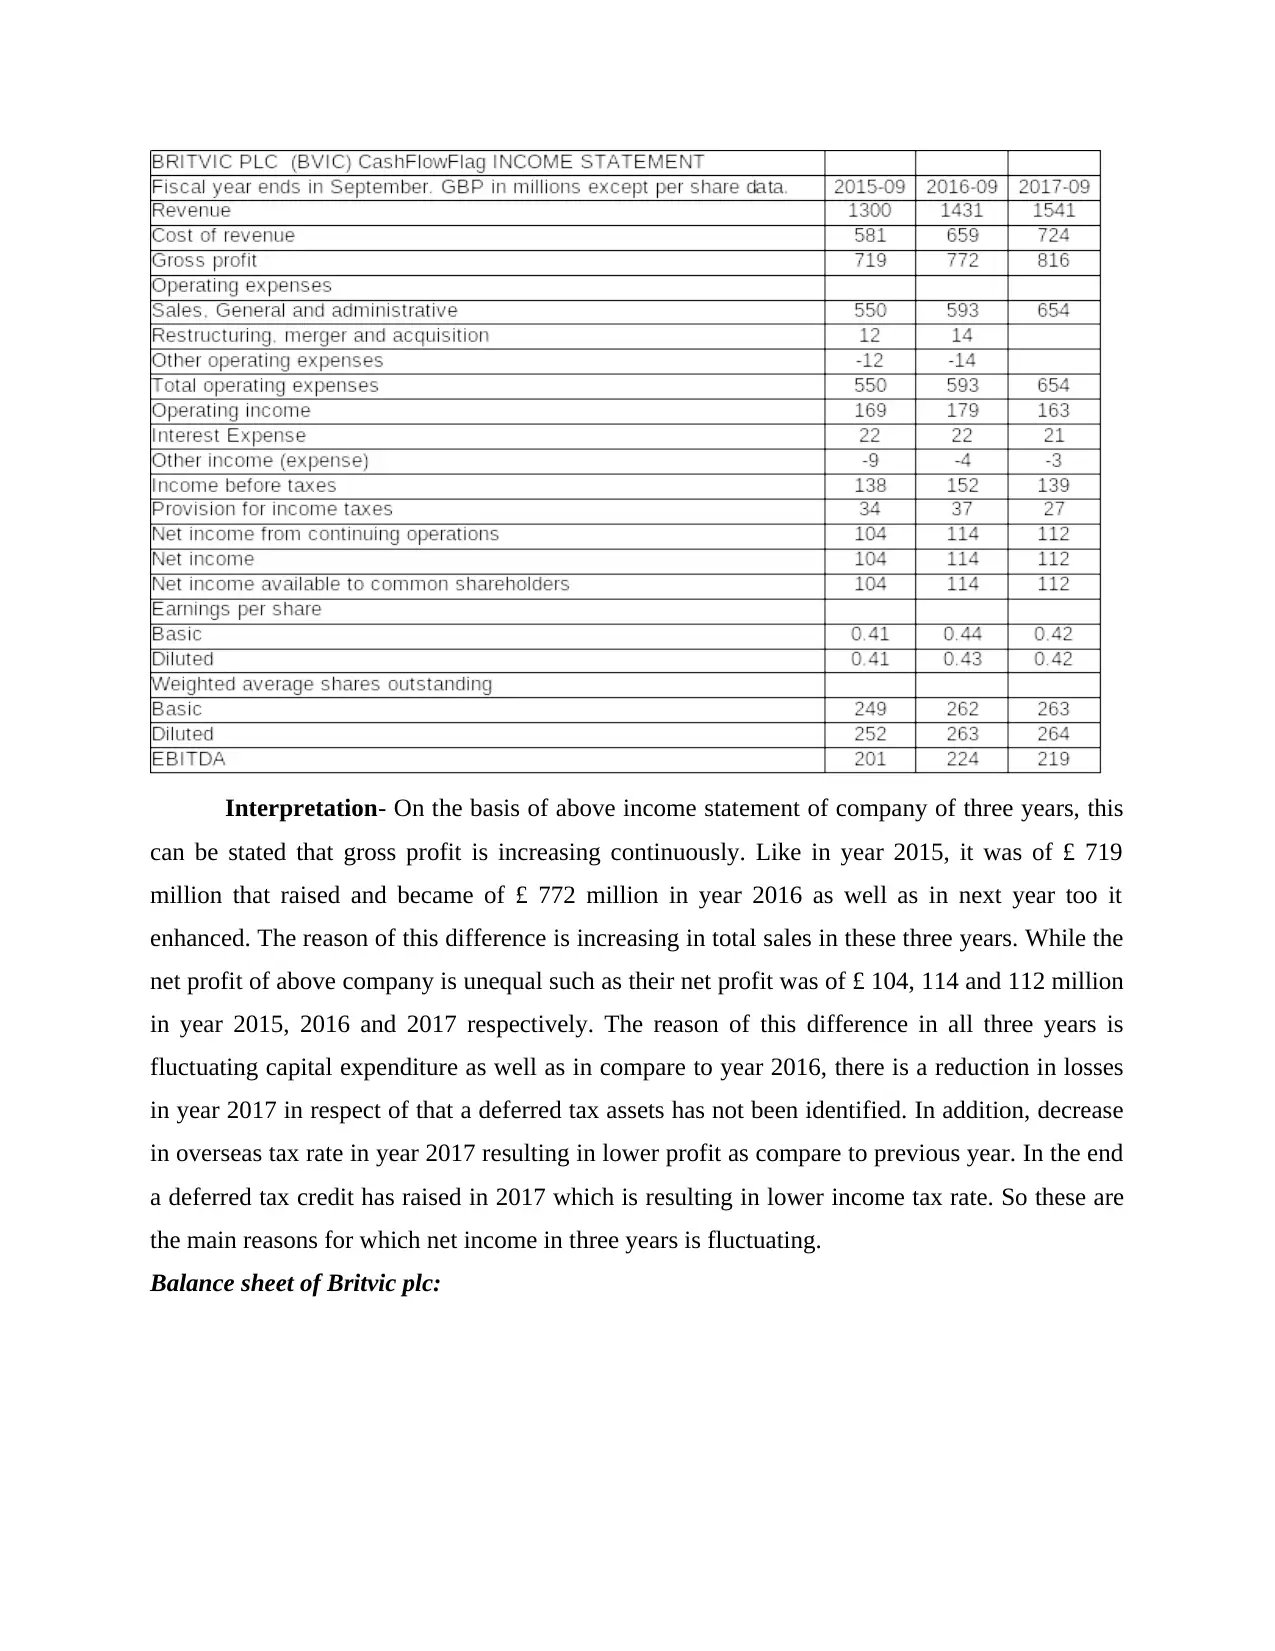
Interpretation- On the basis of above income statement of company of three years, this
can be stated that gross profit is increasing continuously. Like in year 2015, it was of £ 719
million that raised and became of £ 772 million in year 2016 as well as in next year too it
enhanced. The reason of this difference is increasing in total sales in these three years. While the
net profit of above company is unequal such as their net profit was of £ 104, 114 and 112 million
in year 2015, 2016 and 2017 respectively. The reason of this difference in all three years is
fluctuating capital expenditure as well as in compare to year 2016, there is a reduction in losses
in year 2017 in respect of that a deferred tax assets has not been identified. In addition, decrease
in overseas tax rate in year 2017 resulting in lower profit as compare to previous year. In the end
a deferred tax credit has raised in 2017 which is resulting in lower income tax rate. So these are
the main reasons for which net income in three years is fluctuating.
Balance sheet of Britvic plc:
Paraphrase This Document
Need a fresh take? Get an instant paraphrase of this document with our AI Paraphraser

Interpretation- On the basis of analysis of balance sheet of company, this can be
addressed that total assets are higher in year 2016 of £ 1634 million. While in rest of two years,
addressed that total assets are higher in year 2016 of £ 1634 million. While in rest of two years,

the amount of total assets is of £ 1299 and 1613 million in year 2015 and 2017. The reason of
this difference is lower current assets in both of years. Same as the total assets, the total liabilities
are also higher in year 2016 as compare of 2015 and 2017. Hence, it can be interpreted that
company financial position is better in year 2017 because in this year their total assets are of £
1613 million and liabilities are of £ 1274 million. The reason of difference in amount of total non
current assets is higher purchasing in year 2016 and 2017. The rate of purchasing of non current
assets was of 37% and 14% in year 2015 to 2016 and 2016 to 2017. As well as an item of
property, plant is unrecognised from continual use of assets that is resulting in difference in
amount of assets. In the aspect of liabilities, bills payable which have 30 to 90 days terms are,
identified at lower of actual invoiced value and recoverable value that is resulting in difference.
As well as provision of collection money is not longer and considered probable.
Cash flow statement of Britvic plc:
⊘ This is a preview!⊘
Do you want full access?
Subscribe today to unlock all pages.
Trusted by 1+ million students worldwide
1 out of 20
Related Documents


Your All-in-One AI-Powered Toolkit for Academic Success.
+13062052269
info@desklib.com
Available 24*7 on WhatsApp / Email
![[object Object]](/_next/static/media/star-bottom.7253800d.svg)
Unlock your academic potential
Copyright © 2020–2026 A2Z Services. All Rights Reserved. Developed and managed by ZUCOL.