Britvic PLC: Detailed Financial Analysis, Ratio Evaluation, Comparison
VerifiedAdded on 2023/06/04
|15
|3614
|267
Report
AI Summary
This report provides a comprehensive financial analysis of Britvic PLC, evaluating its financial statements, key financial ratios, and overall performance. It includes a comparison with competitors like Fever-Tree Drinks Plc and Coca-Cola HBC AG, using common size statements to benchmark Britvic's performance. The analysis covers liquidity, solvency, efficiency, and profitability ratios, offering insights into Britvic's strengths and weaknesses. The report also examines key performance indicators (KPIs) and market data to assess Britvic's competitive position. The document, contributed by a student and available on Desklib, serves as a valuable resource for understanding Britvic's financial health and market dynamics.
Accounting and
Finance AAF0446
Finance AAF0446
Paraphrase This Document
Need a fresh take? Get an instant paraphrase of this document with our AI Paraphraser
Contents
1. A short introduction, its financial position and the key features of the Nichols Plc........4
Financial statement of Nichols plc..................................................................................................5
2. Evaluation of the financial statements and other financial information of Britvic plc
and ratio analysis thereof..........................................................................................................5
3. Britvic PLC. company performance against with its competitors , includes analysis of
the common size statements....................................................................................................12
CONCLUSION..............................................................................................................................15
REFERENCES..............................................................................................................................16
1. A short introduction, its financial position and the key features of the Nichols Plc
Nichols plc is a manufacturing company dealing in soft drinks situated in England and its
headquarter is in Hemel Hempstead. The company produces all major kinds of soft drinks and
was established in the year 1845. John Daly is the current chairman of Nichols company and
Simon Litherland is the Chief executive officer of Britvic (Atanasovski and Minovski, 2019).
The company is registered in London stock exchange as the element of FTSE 250 index. The
company has its various range of products like Tango, Robinson, and the Lemonade brand. The
company also has the franchise of the Pepsi and 7 up. The organisation in the year 2012 has
proposed to collaborate with the soft drink maker A.G. Barr in the Scotland. The company was
set up in 19th century and was known as the British Vitamin goods company. It work on creating
better tomorrow in the life of its customers and help people enjoy everyday life moments. The
net income of the company is £ 103.2 million and the number of employees working in the
organisation is around 4113. The frequent change in the taste of the consumers towards the
product is a big threat for the company as the customers can switch to other competition like
Shafer and Szado. Here in this report comparison will be done with the company Nichols plc
based in Newton-le-Willows, Merseyside, England especially known for Vimto and Cordial. Its
revenue is increasing day by day. In the year 2020 its revenue was 118.66M whereas in the year
2021 it was increase by 21.63% which is 144.33M. Thus this gives tough competition to the
Britvic plc. Its financials are attached below in this report. Still the company is maintaining the
stability in the market. The company is building its position day by day. The detailed information
of the company is given in this report which include the financial information and the deep
analysis which is taken from various monetary reports. The interpretation of comparison and
calculation of different ratios is given in this report that will figure out the financial key
indicators and the business.
⊘ This is a preview!⊘
Do you want full access?
Subscribe today to unlock all pages.
Trusted by 1+ million students worldwide
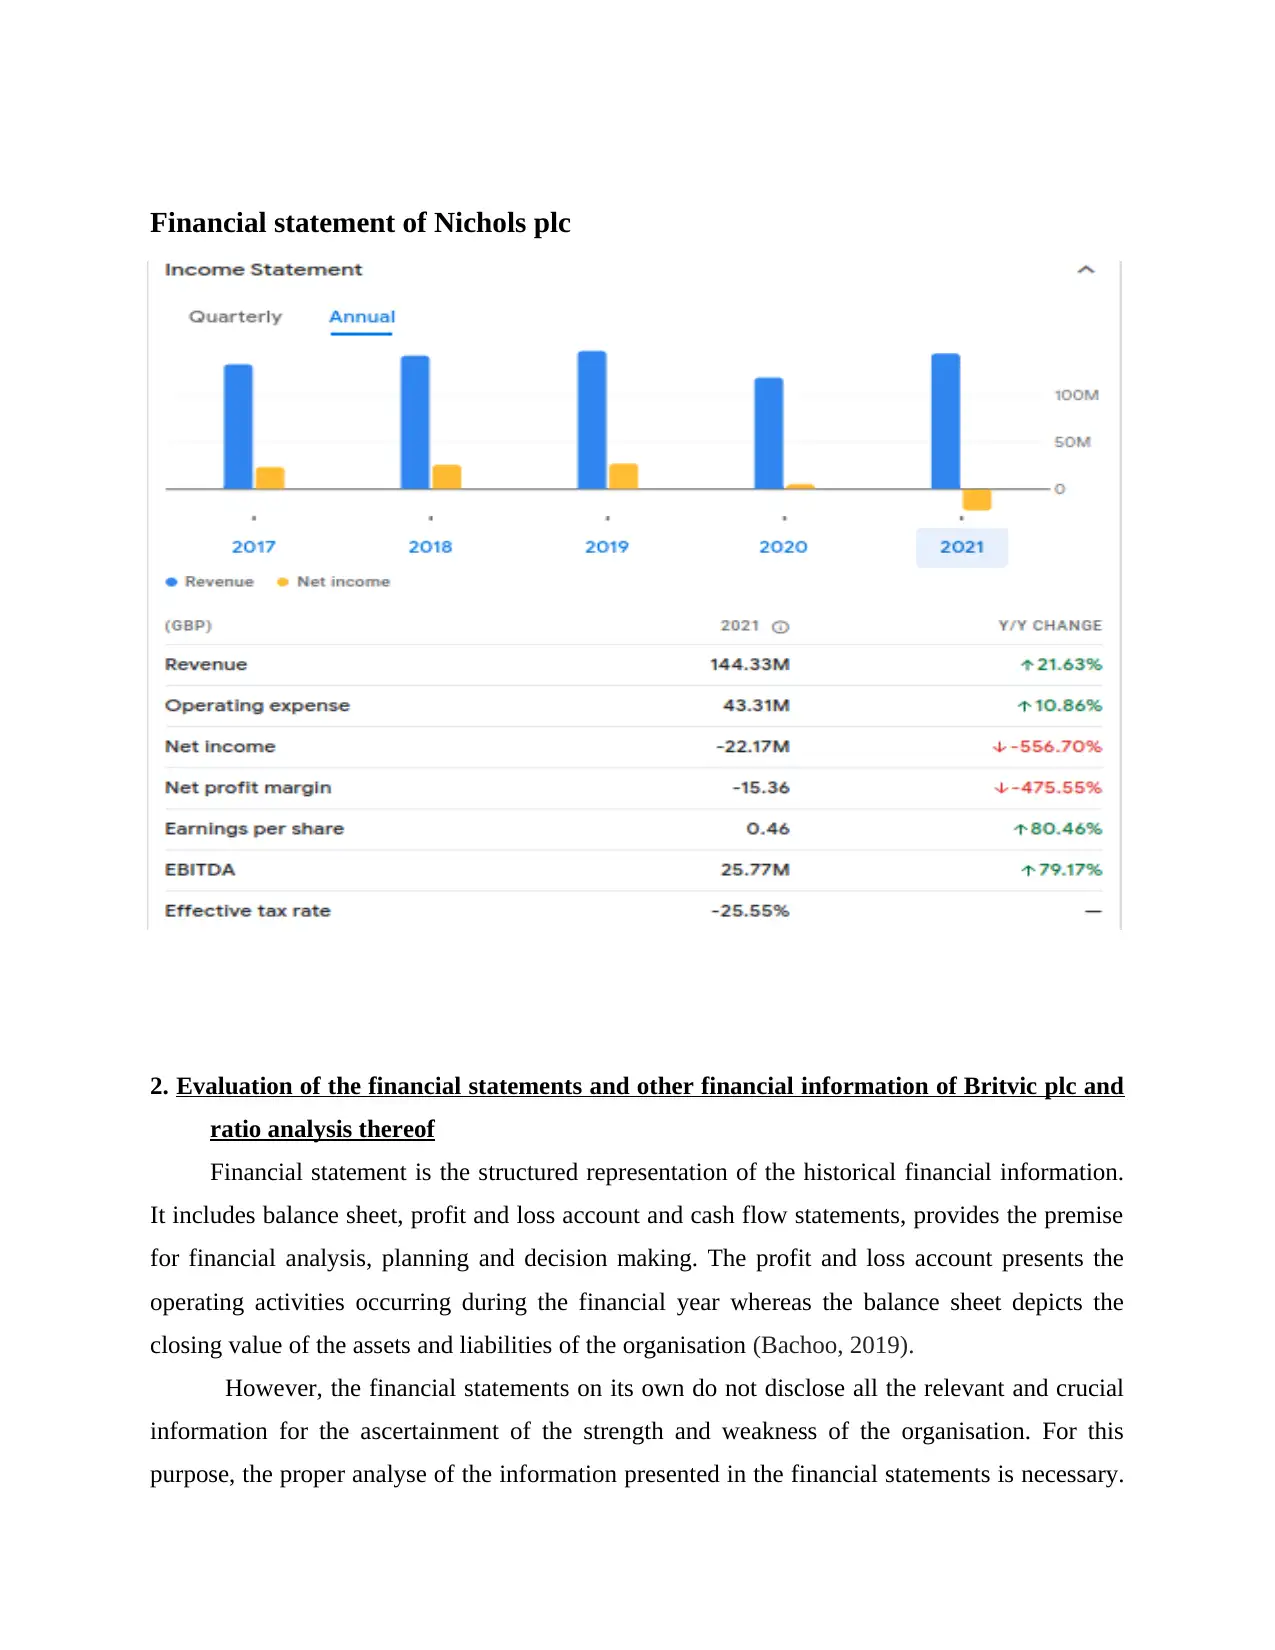
Financial statement of Nichols plc
2. Evaluation of the financial statements and other financial information of Britvic plc and
ratio analysis thereof
Financial statement is the structured representation of the historical financial information.
It includes balance sheet, profit and loss account and cash flow statements, provides the premise
for financial analysis, planning and decision making. The profit and loss account presents the
operating activities occurring during the financial year whereas the balance sheet depicts the
closing value of the assets and liabilities of the organisation (Bachoo, 2019).
However, the financial statements on its own do not disclose all the relevant and crucial
information for the ascertainment of the strength and weakness of the organisation. For this
purpose, the proper analyse of the information presented in the financial statements is necessary.
Paraphrase This Document
Need a fresh take? Get an instant paraphrase of this document with our AI Paraphraser
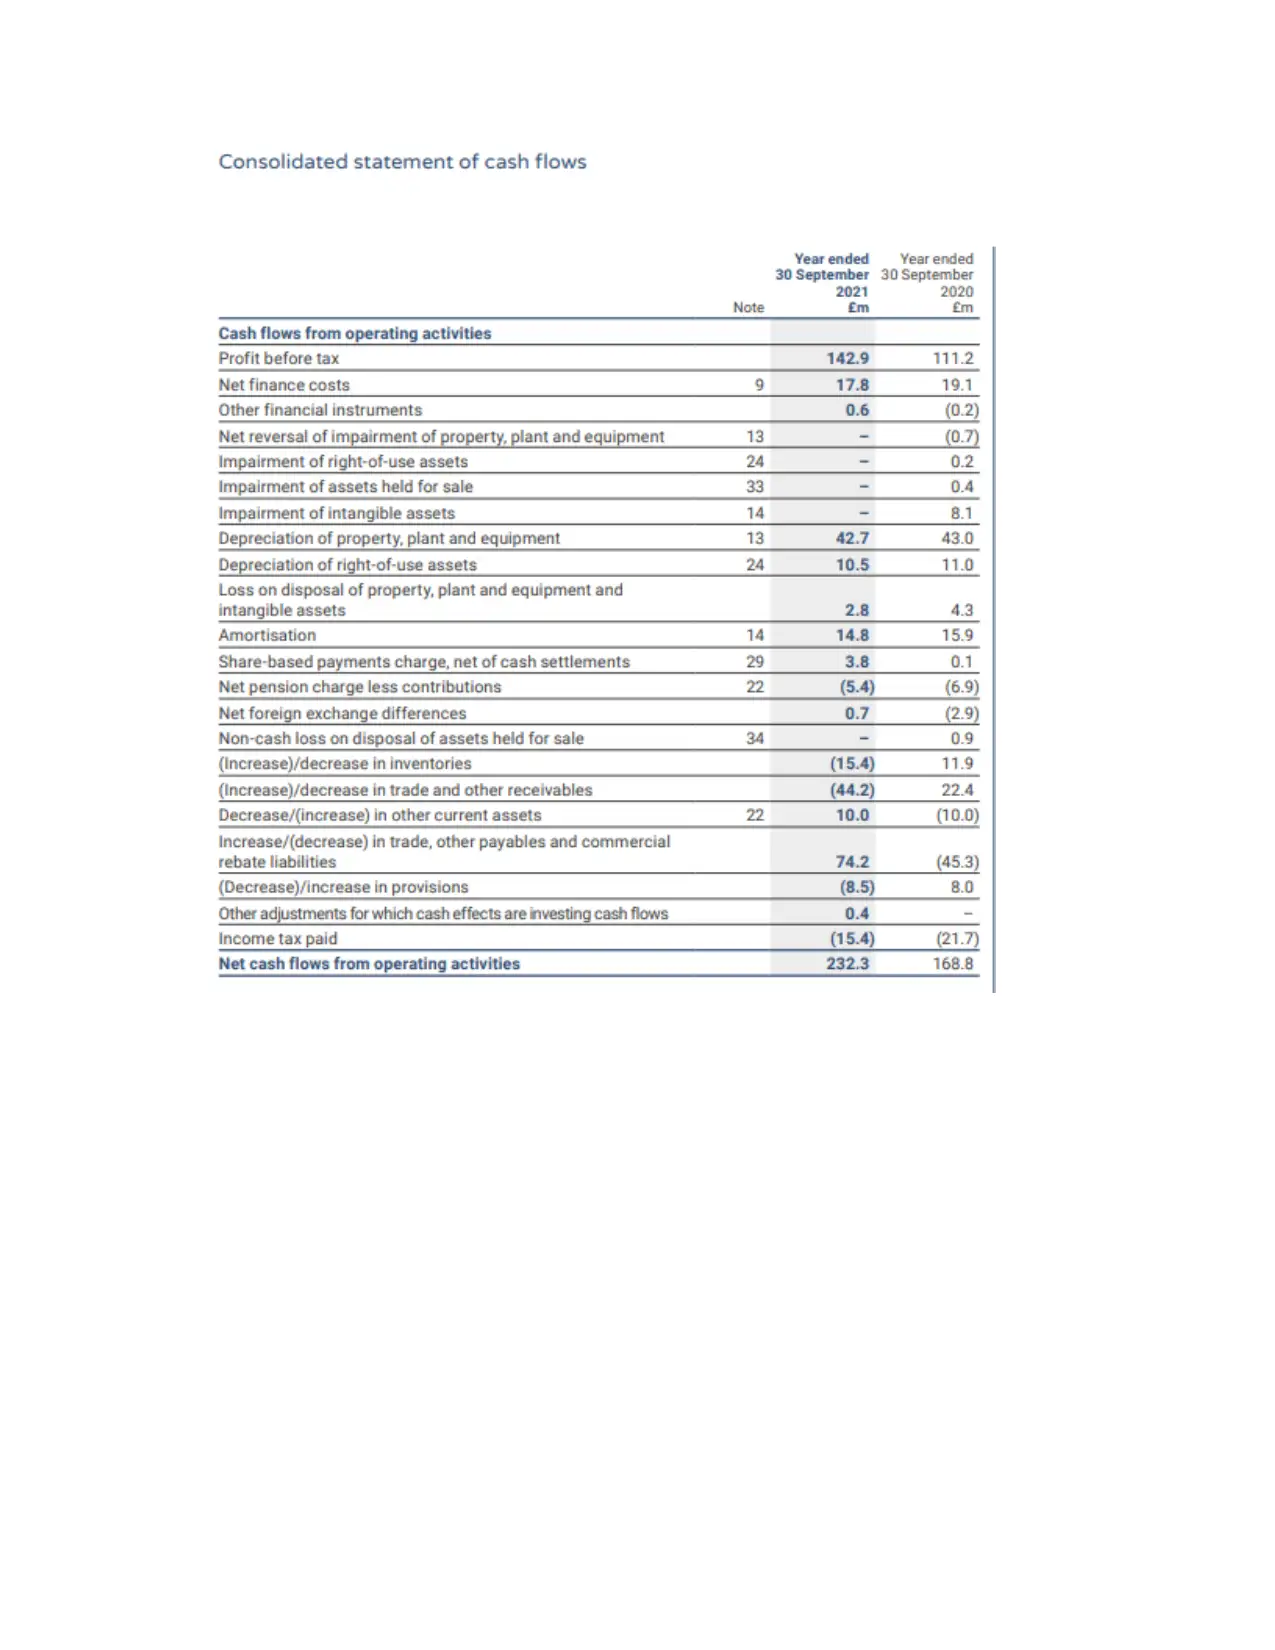
Thus, for the adequate interpretation of the financial statements, the ratios of the financial
statements are analysed.
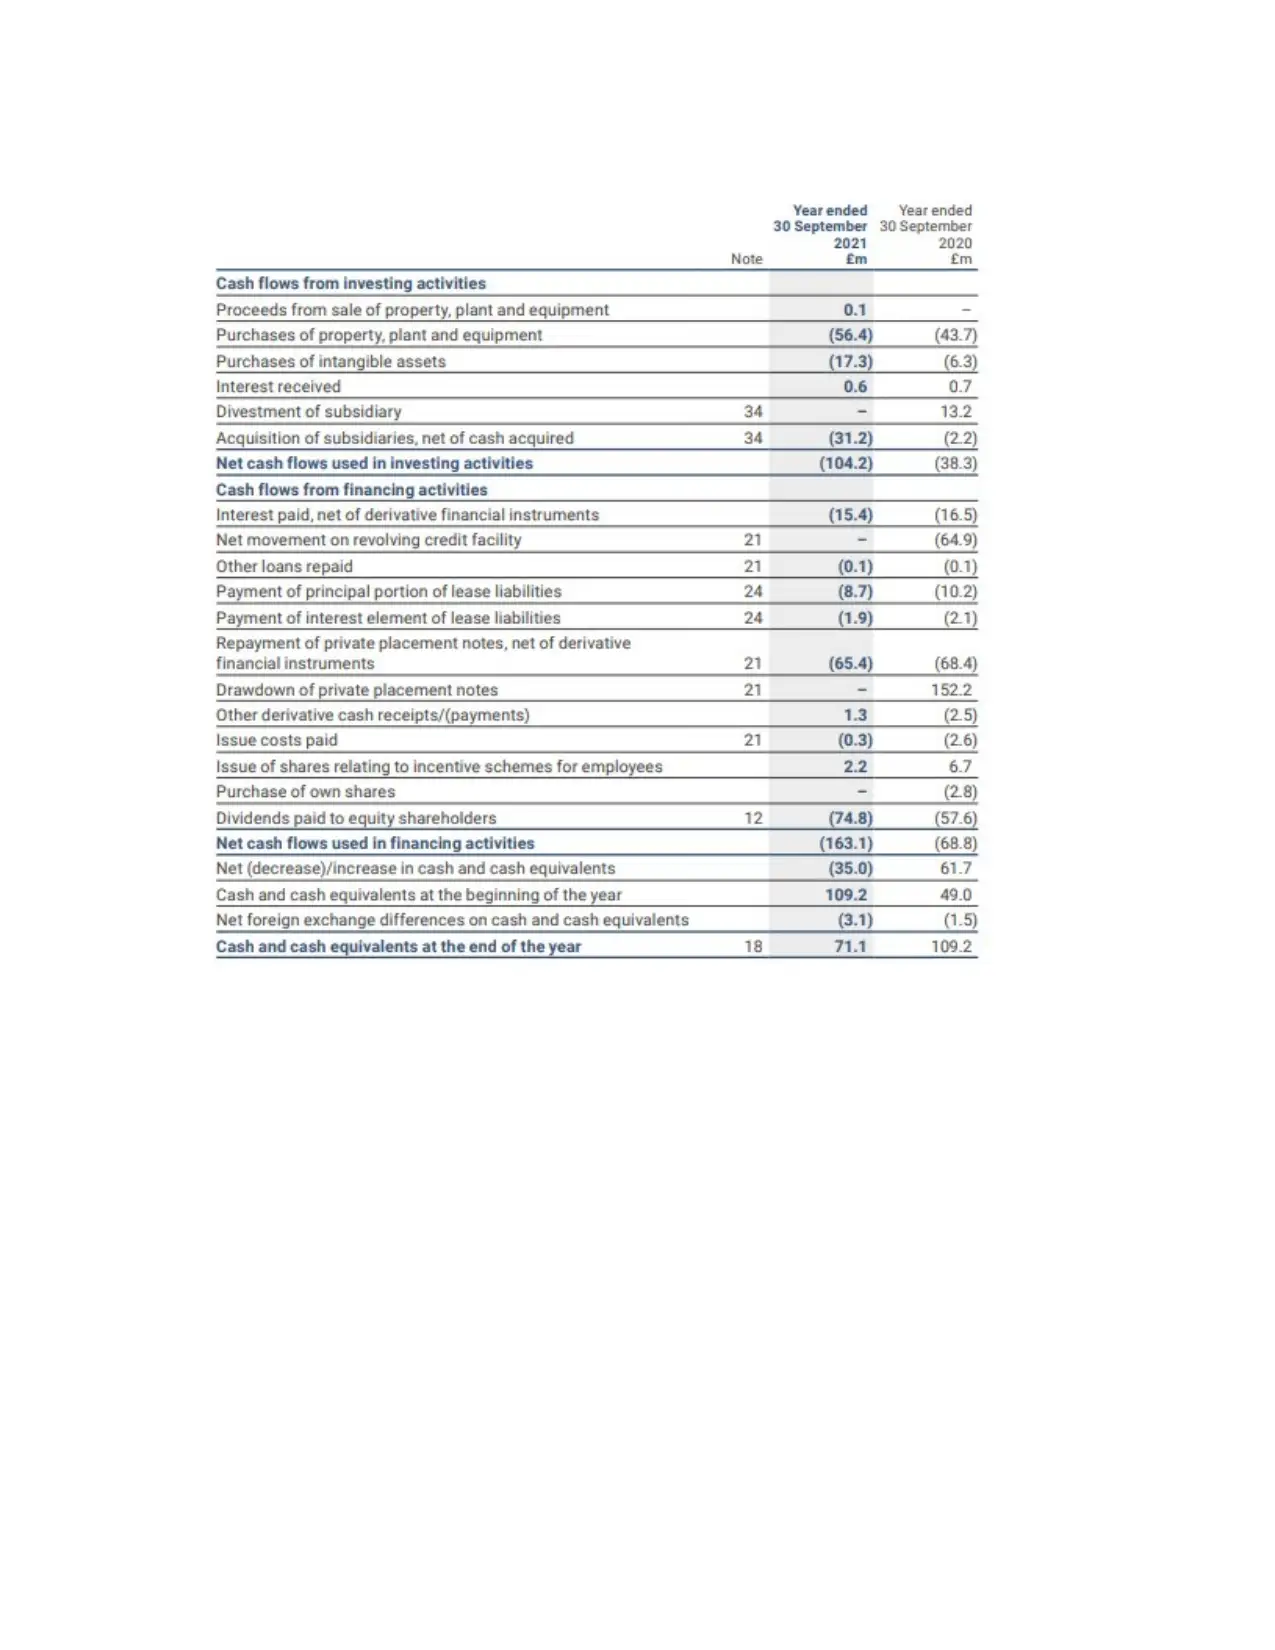
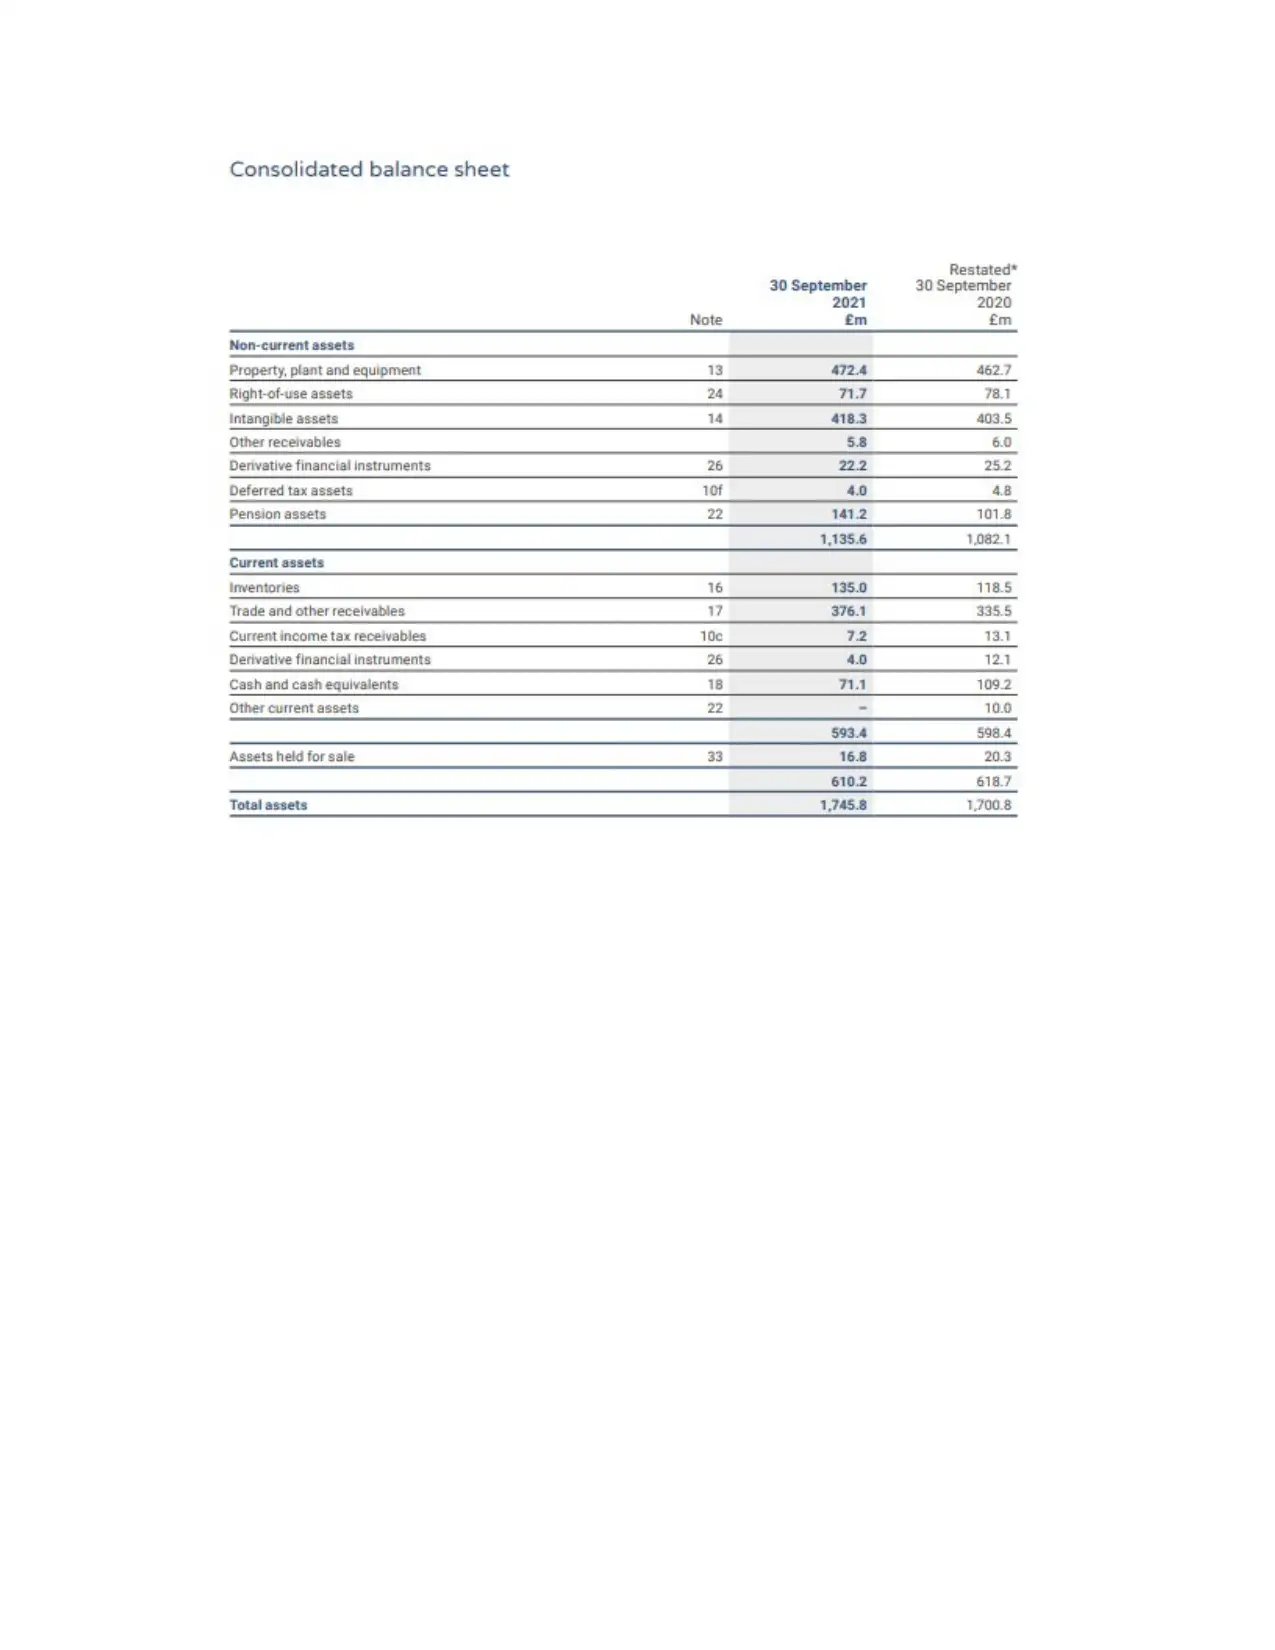
The total assets of the company has been increased to £1745.8M in the year 2021 the
value of which in the year 2020 was £1700.8M, due to which property, plant and equipment has
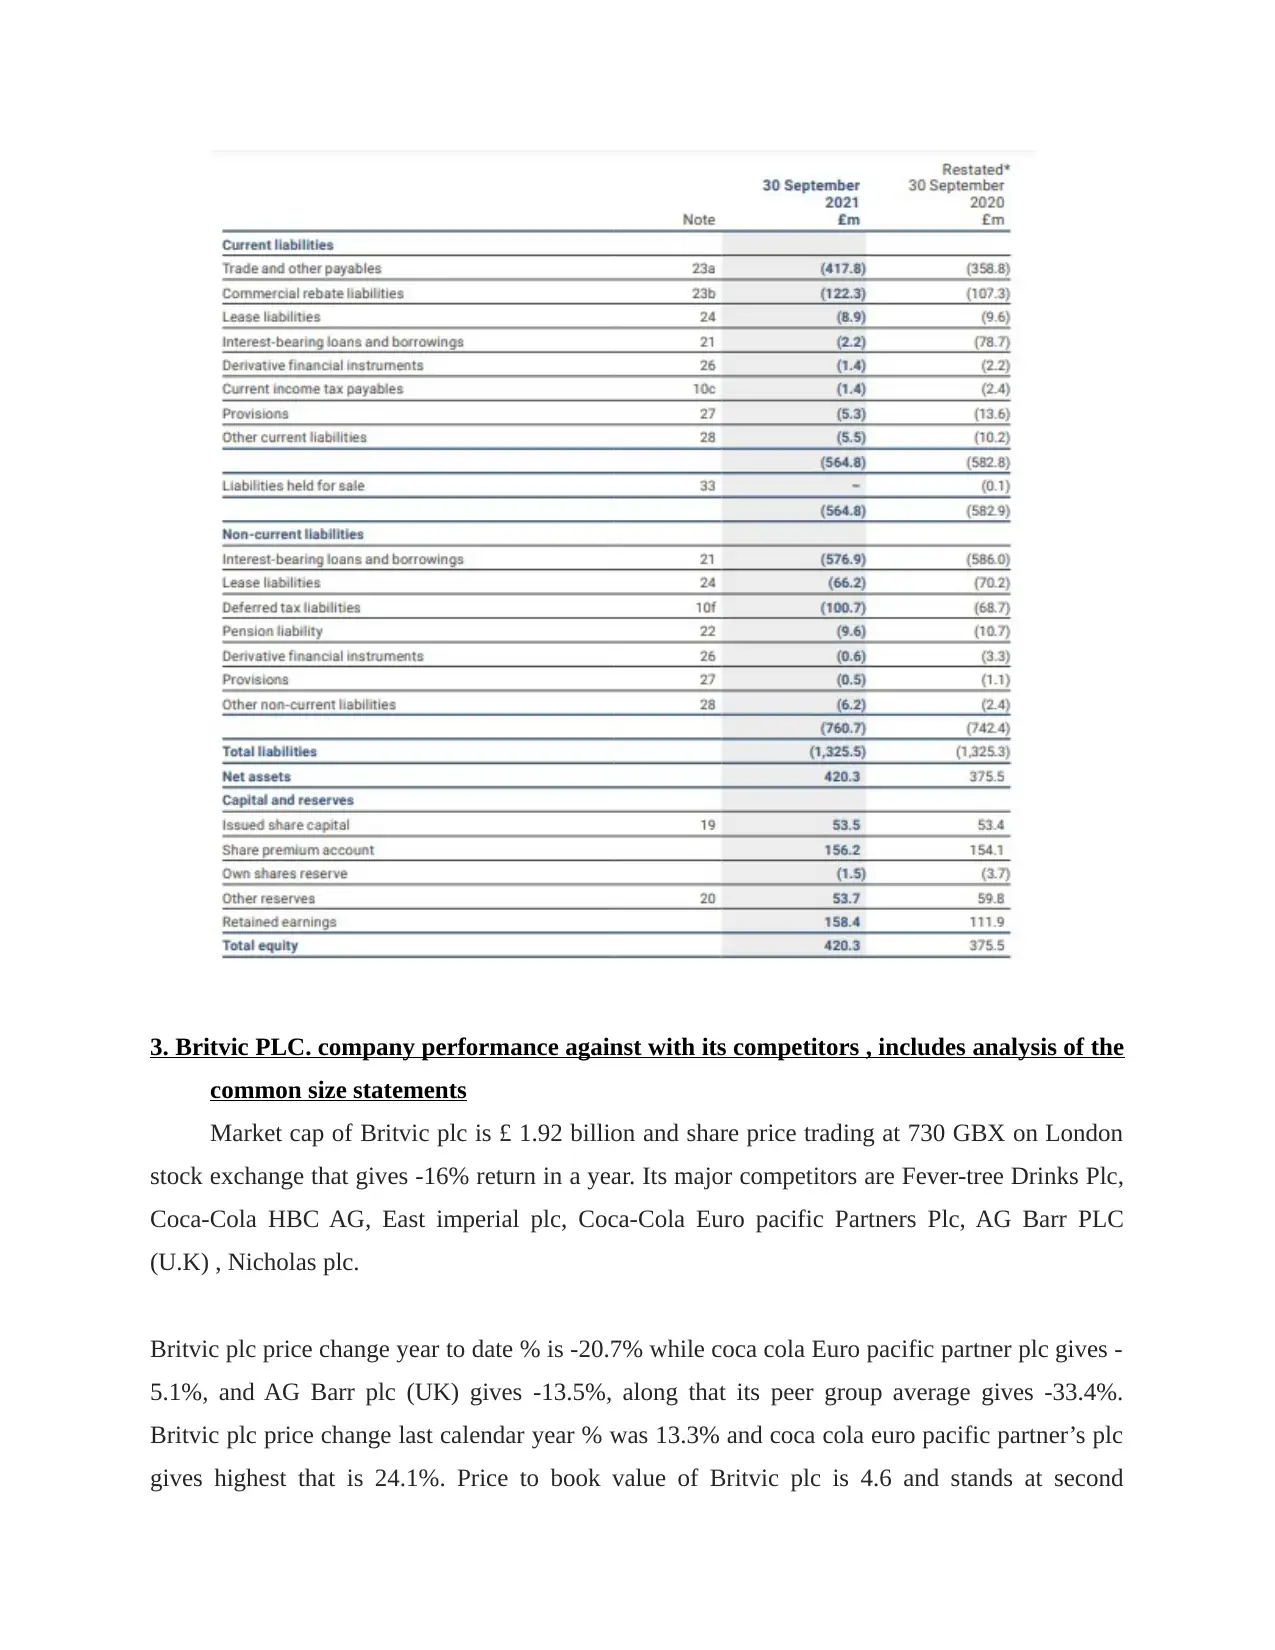
also been increased the company has managed to control its liabilities from increasing. As far as
the cash flow statement is concerned then it is clearly visible that company has generated cash
flows from the operating activities in the year 2021 which is more than the year 2020 but
company has made investment of £65.9M and also it has incurred the finance cost of £94.3M
consequently, at the end of the year, the company has less closing cash balance than the previous
year. The company has noticed a slightly decline in the revenue and cost of sales which results in
increment of £22.8M and profit after tax is also increased resultantly earning per share is also
appreciated.
RATIO ANALYSIS :
The ratio can be described as the computation of the two mathematical variables and the
relationship between them as well. Ratio analysis is a observational technique that is used to
obtain the understanding of the company's liquidity, profitability and efficiency. With the help of
ratio analysis it can be evaluated as to how a company is performing in comparison to other
companies in the industry. Ratios are properly utilized by the users of financial statements for
gaining the knowledge of company's financial positioning. Ratio analysis is not only comparing
the different data given in the financial statement but it also shows the comparison of the data for
the previous years of same firm (i.e. intra firm) and other companies (i.e. inter-firm) in the same
industry as well (Chowdhury, Rahman and Sankaran, 2021). The balance sheet of Britvic plc
shows that the company's assets have been appreciated by 2.65% in 2021 whereas the liabilities
remain at almost same level. In the year 2021, the Britvic plc has noticed the decline of £38.1M
in the cash balance at the end of the year.
Broadly, ratios can be classified under four categories:
Liquidity or Short Term Solvency Ratios:
Liquidity ratio or short term solvency ratio is a measurement of the ability of the company to
settle its short term liabilities. Inability of paying-off short term debts, can affect the credibility
of the company and its credit ratings as well. With respect to liquidity ratios, creditors of the firm
look so keen to know about the state of liquidity they have their financial interest. Short term
statements are analysed.
The total assets of the company has been increased to £1745.8M in the year 2021 the
value of which in the year 2020 was £1700.8M, due to which property, plant and equipment has
also been increased the company has managed to control its liabilities from increasing. As far as
the cash flow statement is concerned then it is clearly visible that company has generated cash
flows from the operating activities in the year 2021 which is more than the year 2020 but
company has made investment of £65.9M and also it has incurred the finance cost of £94.3M
consequently, at the end of the year, the company has less closing cash balance than the previous
year. The company has noticed a slightly decline in the revenue and cost of sales which results in
increment of £22.8M and profit after tax is also increased resultantly earning per share is also
appreciated.
RATIO ANALYSIS :
The ratio can be described as the computation of the two mathematical variables and the
relationship between them as well. Ratio analysis is a observational technique that is used to
obtain the understanding of the company's liquidity, profitability and efficiency. With the help of
ratio analysis it can be evaluated as to how a company is performing in comparison to other
companies in the industry. Ratios are properly utilized by the users of financial statements for
gaining the knowledge of company's financial positioning. Ratio analysis is not only comparing
the different data given in the financial statement but it also shows the comparison of the data for
the previous years of same firm (i.e. intra firm) and other companies (i.e. inter-firm) in the same
industry as well (Chowdhury, Rahman and Sankaran, 2021). The balance sheet of Britvic plc
shows that the company's assets have been appreciated by 2.65% in 2021 whereas the liabilities
remain at almost same level. In the year 2021, the Britvic plc has noticed the decline of £38.1M
in the cash balance at the end of the year.
Broadly, ratios can be classified under four categories:
Liquidity or Short Term Solvency Ratios:
Liquidity ratio or short term solvency ratio is a measurement of the ability of the company to
settle its short term liabilities. Inability of paying-off short term debts, can affect the credibility
of the company and its credit ratings as well. With respect to liquidity ratios, creditors of the firm
look so keen to know about the state of liquidity they have their financial interest. Short term
solvency ratios include current ratio, quick ratio, cash ratio, net working capital etc. The ideal
current ratio is 2:1 and the company's current ratio in the year 2021 is 1.05 and for the year 2020
the ratio is 1.03. Although the ratio is increased in current year still it is less than the ideal one.
The ideal quick ratio is 1:1 but the company's ratios are 0.81 and 0.82 for the year 2021 and 2020
respectively which are almost same but less the ideal ratios (de Geus and et.al., 2018).
Leverage or Long Term Solvency Ratio:
Solvency ratio are considered those financial ratios that are used to measure the long term
stability and capital structure of the firm. Basically these types of ratios depict the capital
structure of the firm which includes the debt employed and equity share capital. This ratio is
computed to compare the debts of the company with its assets and equity to estimate the
company's sustainability of the company in the long run. Leverage ratios can be categorised
under two parts; one is capital structure ratios which include the equity ratio, debt ratio, debt to
equity ratio, debt to total assets ratio etc. and second type is coverage ratios which involves
interest coverage ratio, preference dividend coverage ratio and fixed charges coverage ratio. The
debt equity ratio for the year 2021 is 1.4 and for 2020 it was 1.8 thus the ratio has been decreased
in the current year which shows that company has more debt than the equity in its capital
structure. The debt to total assets ratio is 0.4 and 0.4 for the year 2020 and for the year 2021,
there is no change in the ratio, which clearly shows that company has less debt capital in
comparison to its total assets (Didia, Mayse and Randle, 2018).
Activity or Efficiency Ratio :
Efficiency ratios are used to evaluate as how efficiently a company is utilizing its assets and
liabilities to generate sales and make profits. Usually, these ratios indicate the usage of assets in
with regard to frequency of sales. Thus, these ratios are calculated with reference to sales or cost
of goods sold and the unit of these ratios is rate or times. These ratios include total assets
turnover ratio, fixed assets turnover ratio, capital turnover ratio and working capital turnover
ratio. The company's total assets turnover ratio is 0.81 and 0.82 for the year 2021 and 2020
respectively which shows that company is similarly efficient in utilizing the total assets in the
current year for generating the sales in comparison to previous year. After analysing the fixed
assets turnover ratio it has noticed that the company has used more fixed assets in making sales
(Ginting, 2021).
Profitability Ratio:
⊘ This is a preview!⊘
Do you want full access?
Subscribe today to unlock all pages.
Trusted by 1+ million students worldwide
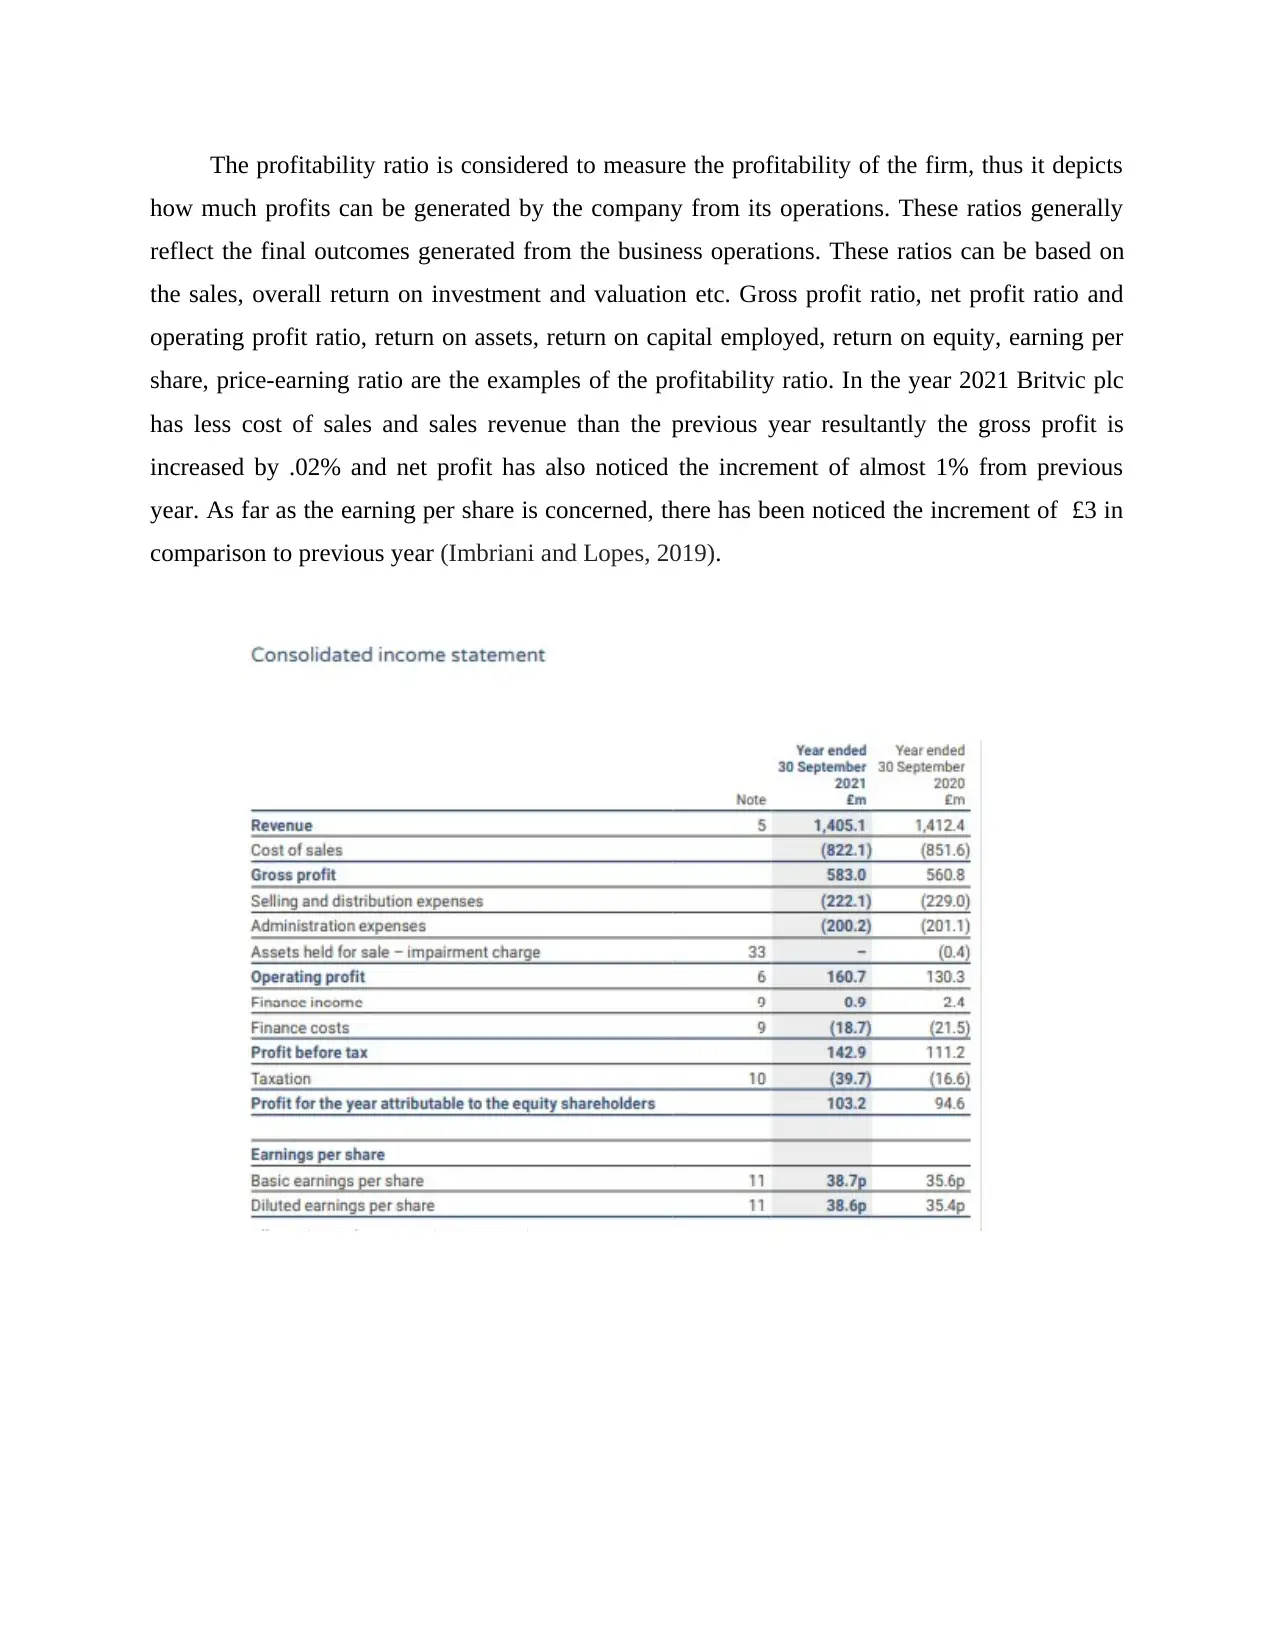
The profitability ratio is considered to measure the profitability of the firm, thus it depicts
how much profits can be generated by the company from its operations. These ratios generally
reflect the final outcomes generated from the business operations. These ratios can be based on
the sales, overall return on investment and valuation etc. Gross profit ratio, net profit ratio and
operating profit ratio, return on assets, return on capital employed, return on equity, earning per
share, price-earning ratio are the examples of the profitability ratio. In the year 2021 Britvic plc
has less cost of sales and sales revenue than the previous year resultantly the gross profit is
increased by .02% and net profit has also noticed the increment of almost 1% from previous
year. As far as the earning per share is concerned, there has been noticed the increment of £3 in
comparison to previous year (Imbriani and Lopes, 2019).
Paraphrase This Document
Need a fresh take? Get an instant paraphrase of this document with our AI Paraphraser
⊘ This is a preview!⊘
Do you want full access?
Subscribe today to unlock all pages.
Trusted by 1+ million students worldwide
Paraphrase This Document
Need a fresh take? Get an instant paraphrase of this document with our AI Paraphraser
3. Britvic PLC. company performance against with its competitors , includes analysis of the
common size statements
Market cap of Britvic plc is £ 1.92 billion and share price trading at 730 GBX on London
stock exchange that gives -16% return in a year. Its major competitors are Fever-tree Drinks Plc,
Coca-Cola HBC AG, East imperial plc, Coca-Cola Euro pacific Partners Plc, AG Barr PLC
(U.K) , Nicholas plc.
Britvic plc price change year to date % is -20.7% while coca cola Euro pacific partner plc gives -
5.1%, and AG Barr plc (UK) gives -13.5%, along that its peer group average gives -33.4%.
Britvic plc price change last calendar year % was 13.3% and coca cola euro pacific partner’s plc
gives highest that is 24.1%. Price to book value of Britvic plc is 4.6 and stands at second
position, while East imperial plc has 34.6 stands at the top. Brice to earning per ratio of Britvic is
18.9 where 99.9 of East Imperial PLC and 84.4 of Nicholas plc. Five-year growth of earning per
share is negative 2.4% where fever tree drinks plc has 25.5 followed by coca cola HBC AG
(12.6) and coca cola euro pacific partner’s plc (7.9). Britvic plc has the lowest 5-year revenue
growth rate % from its competitors is -0.4%.
Comparative statement analysis of Britvic Plc.
Comparing financial statements of two or more than two companies helps in identifying
performance and valuation of a business which helps decision maker to identify good companies,
it also helps to identify how company is performing with its assets to make revenue and how
they manage its operating expenses to perform well also gives proper return to its shareholder by
managing its key performing indicators (KPIs) (Singh and et.al., 2019).
Here are some major particulars through which companies can be compared -
1. Gross profit – It helps investor to know how much company makes after reducing its cost
of goods sold associated with revenue.
2. Operating expenses – It is an expense incurred during its operation like rent cost,
marketing cost etc.
3. Net income – It is an shareholders income of business made after deducting its expenses,
interest and taxes.
4. Earnings per share – it indicates how much money a company makes for its shareholders
(Net profit / Number of common shares outstanding).
5. Cash reserves – The money a company has in its hand to meet short term obligations.
6. Dividend yield and many more like Current ratio , quick ratio , solvency ratio ,
profitability ratio and liquidity ratio (Ziegler and et.al., 2021).
Britvic had revenues flat at 1.4 billion but company grew its net income by 9.09% due to
reduction in its cost of goods sold as a percentage of sales though which net income rises and
looks attractive where its gross margin is 41% and operating margin is 11%. keeping in mind
Britvic net income is increasing from the last two financial period after a fall of net income in
2019. Cash reserves of Britvic fell by 38 million. However, it earned 230 million from its
operations and spend around 100 million on financing activities and 160 million on financing
⊘ This is a preview!⊘
Do you want full access?
Subscribe today to unlock all pages.
Trusted by 1+ million students worldwide
1 out of 15
Related Documents


Your All-in-One AI-Powered Toolkit for Academic Success.
+13062052269
info@desklib.com
Available 24*7 on WhatsApp / Email
![[object Object]](/_next/static/media/star-bottom.7253800d.svg)
Unlock your academic potential
Copyright © 2020–2026 A2Z Services. All Rights Reserved. Developed and managed by ZUCOL.