BSB123 Data Analysis Research Report: GPA and Influencing Factors
VerifiedAdded on 2023/06/03
|12
|1770
|141
Report
AI Summary
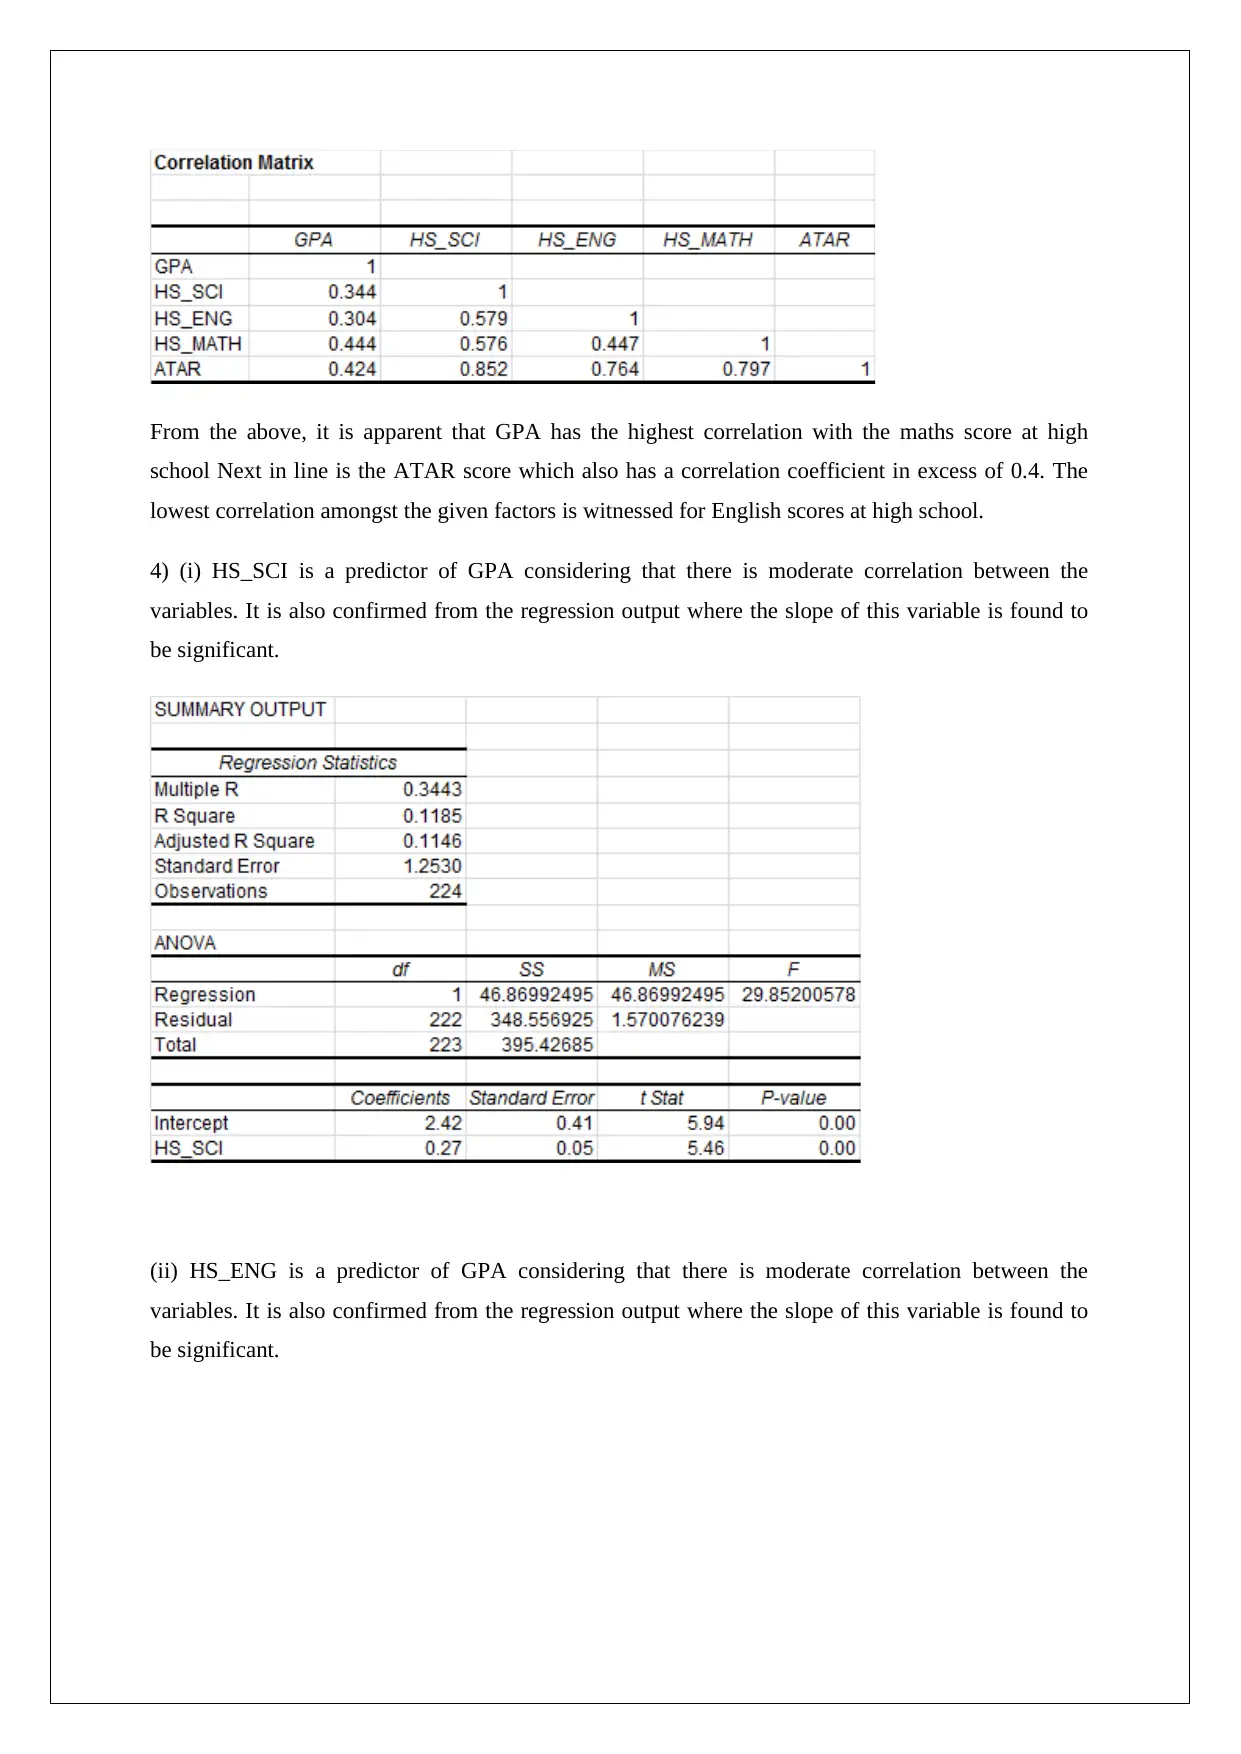
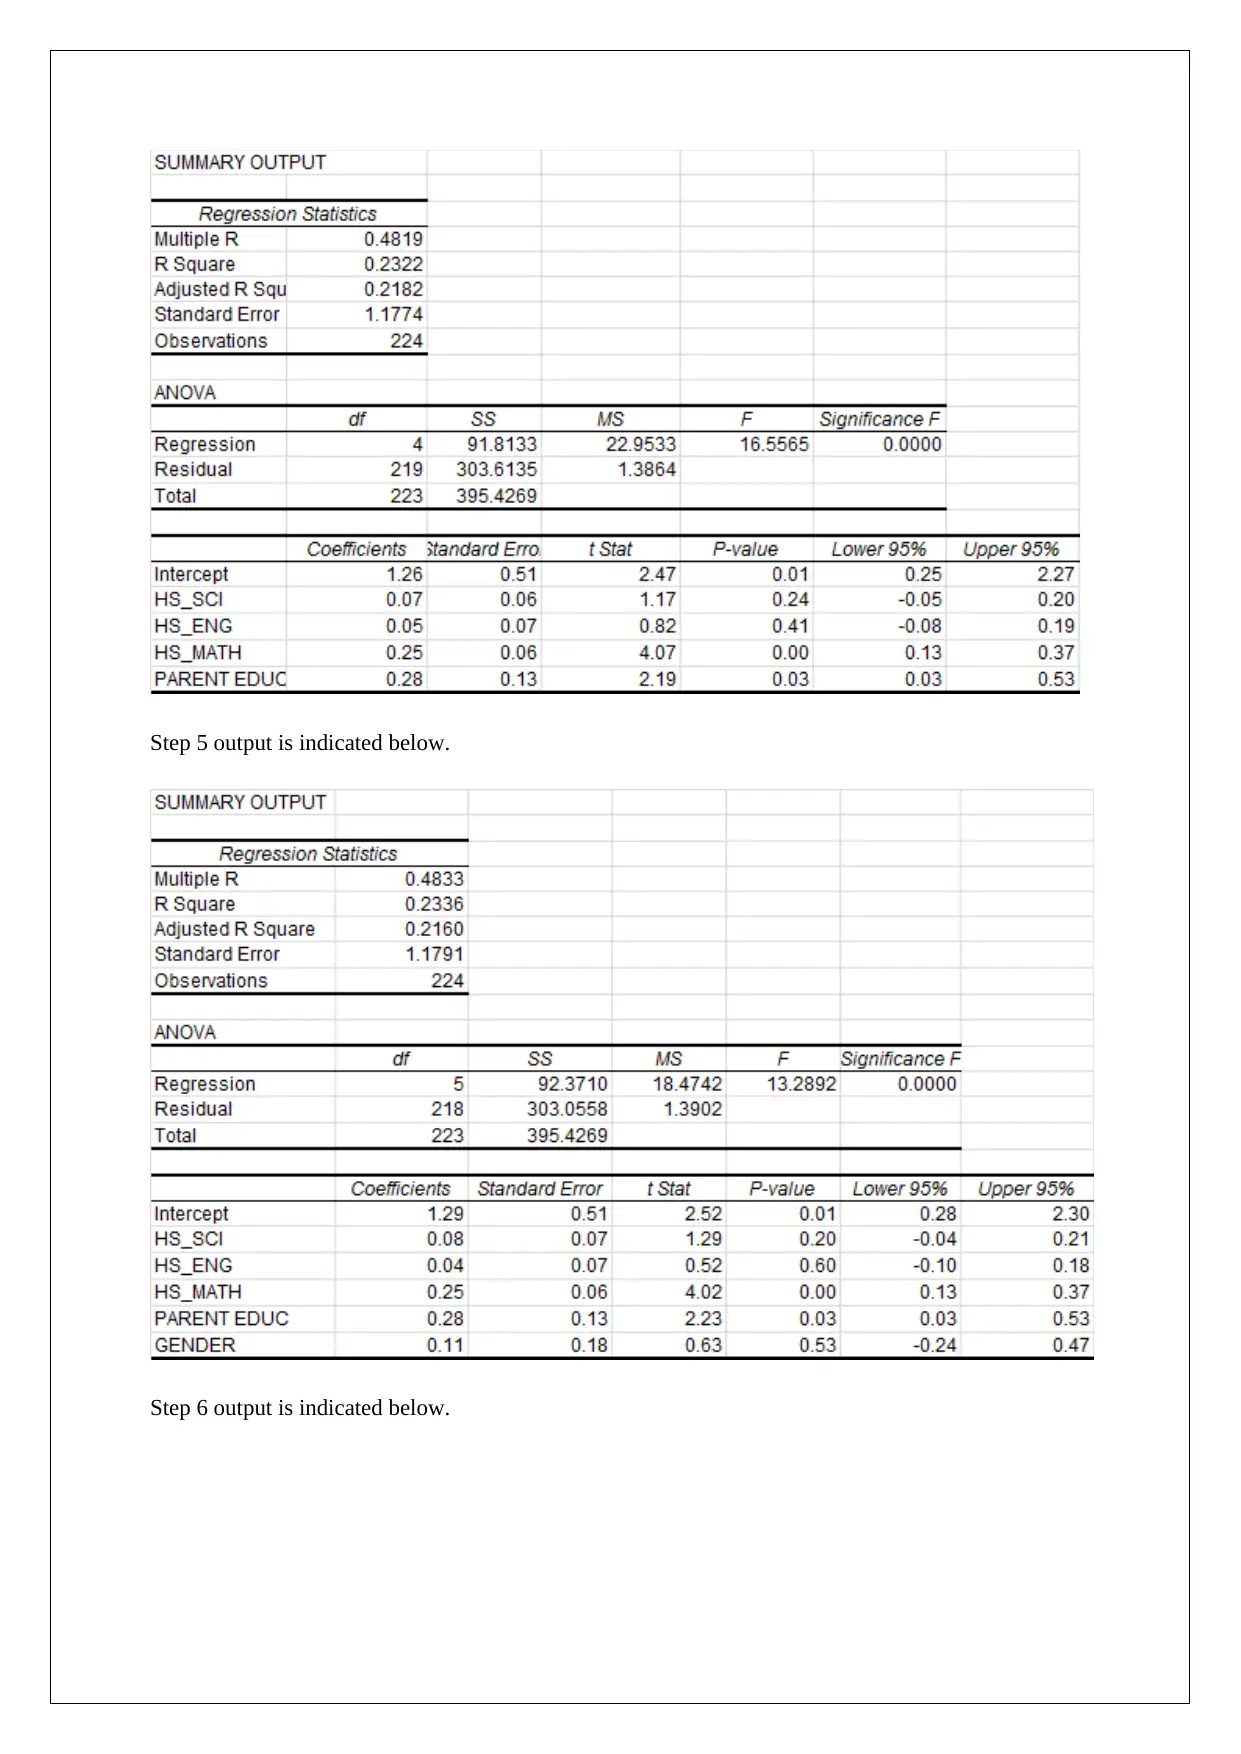
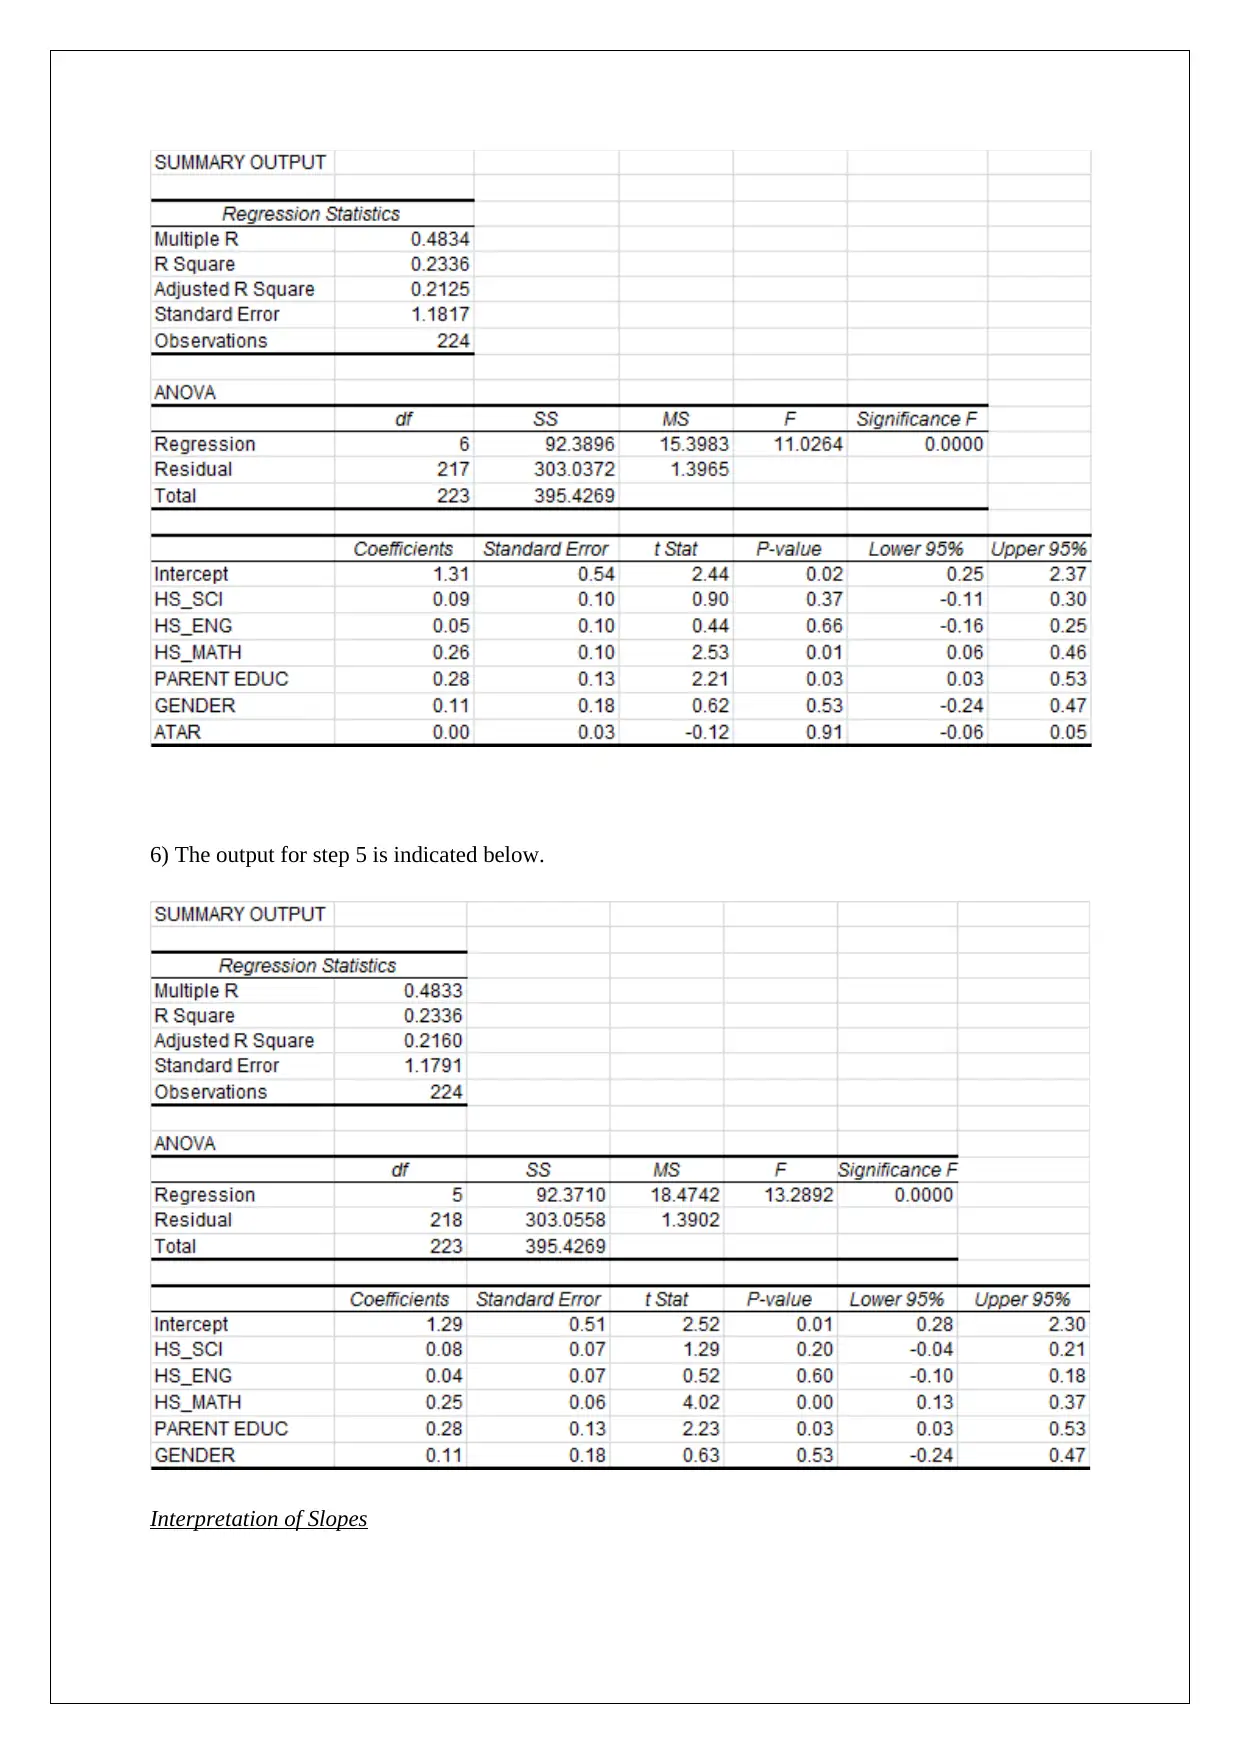
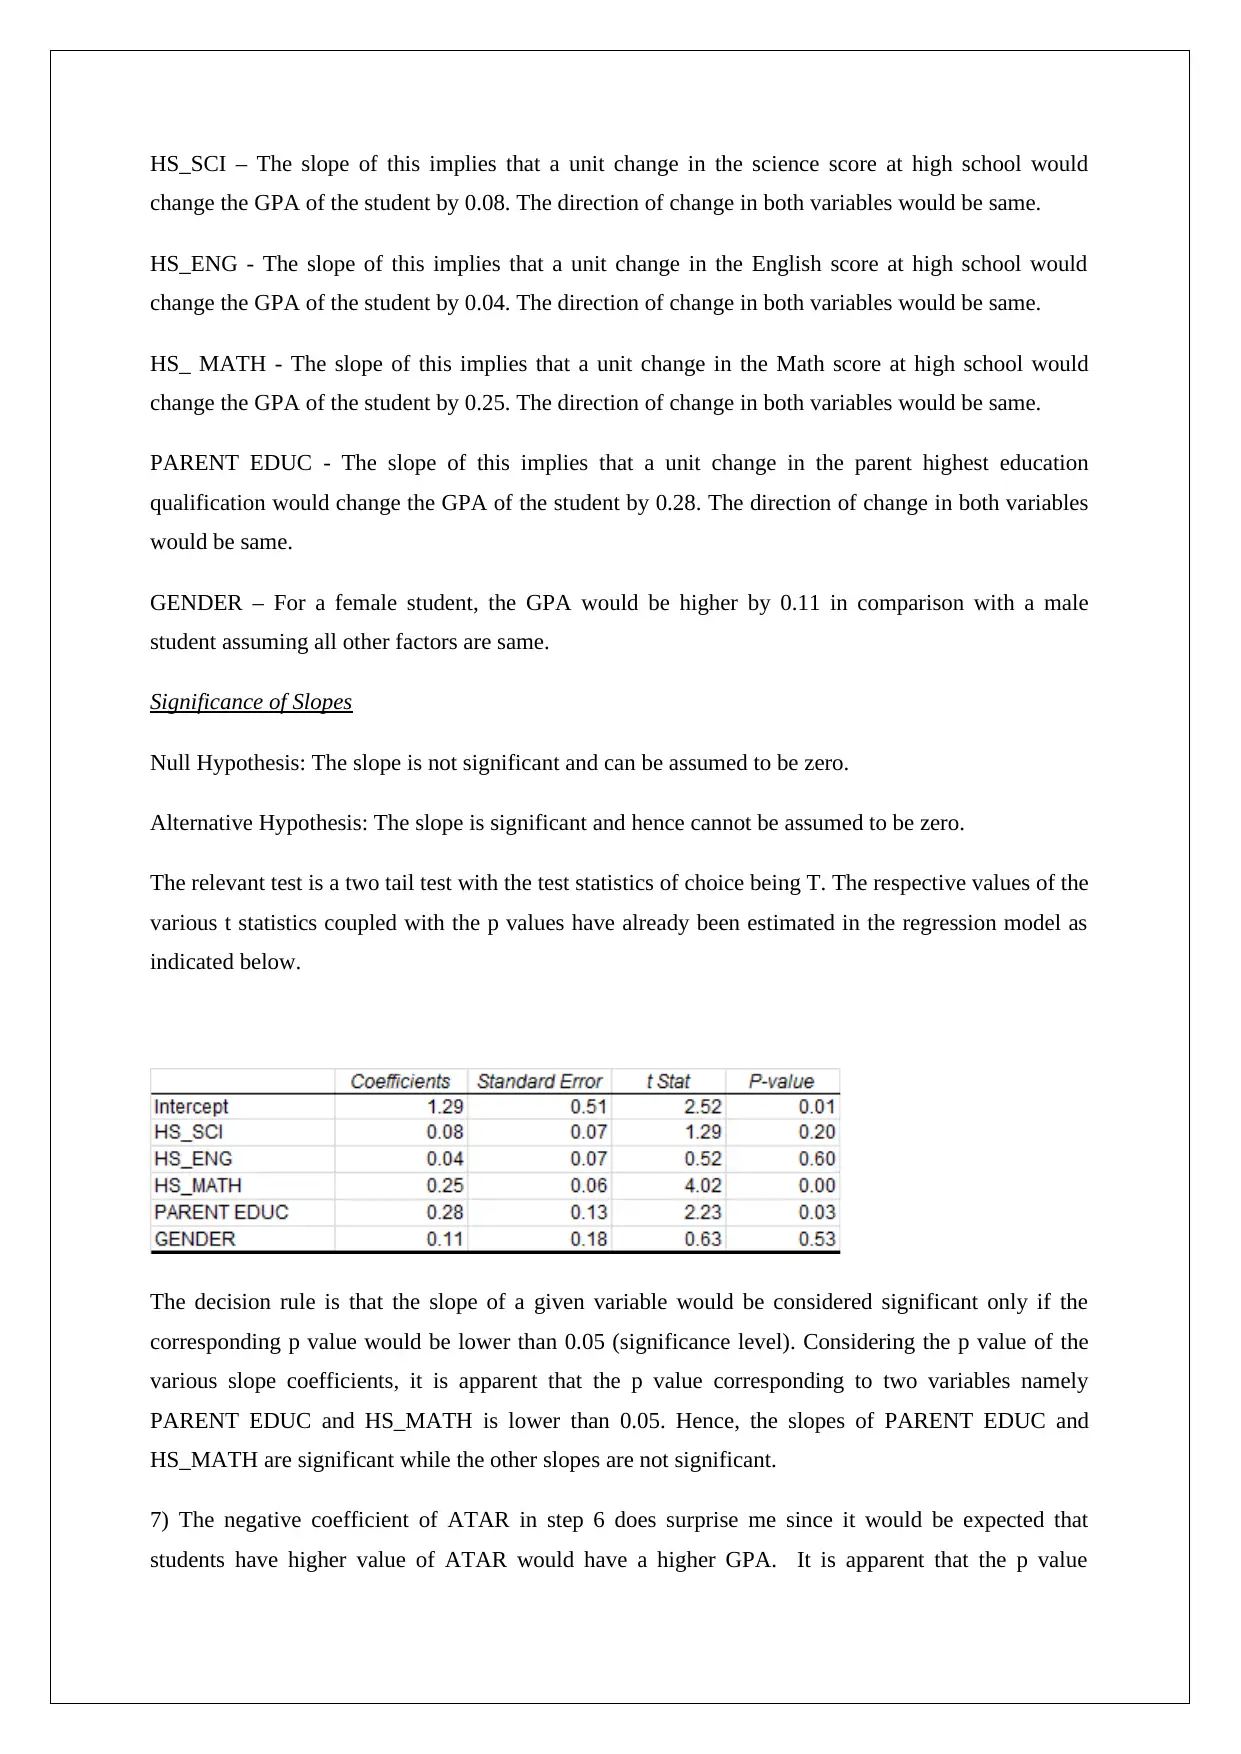
This data analysis research report investigates factors influencing student academic performance, measured by GPA, within a university's science department. The analysis utilizes t-tests and regression analysis to assess the impact of variables such as high school scores (science, English, and math), ATAR scores, parental education level, and gender on GPA. The findings suggest that parental education and high school math scores are significant predictors of GPA. The report also discusses the limitations of the models used and recommends additional variables, such as IQ level and study habits, for future research to improve the prediction of GPA. The analysis concludes that socioeconomic status has a limited impact and that a minimum level of parental education is essential for better academic outcomes. Desklib provides access to similar reports and study resources for students.

DATA ANALYSIS
RESEARCH REPORT
STUDENT ID:
[Pick the date]
RESEARCH REPORT
STUDENT ID:
[Pick the date]
Paraphrase This Document
Need a fresh take? Get an instant paraphrase of this document with our AI Paraphraser

Task 1 (Boxplot and t tests)
1(a) The relevant boxplot is shown below.
The relevant five number summary is indicated below.
It is apparent from the shape of both the boxplots that the GPA distribution for neither of the genders
is symmetric and hence there is skew involved. This is also confirmed from the fact that the presence
of outliers on both ends for both genders since there are certain students who tend to perform very
well and very miserably. Owing to the skewed nature of the data, the median in both cases is the
appropriate measure of central tendency with IQR (Inter-quartile range) being the suitable measure for
variation.
(b) The requisite hypotheses are as highlighted below.
Null Hypothesis: Average GPA of males does not significantly deviate from average GPA of females
Alternative Hypothesis: Average GPA of males does significantly deviate from average GPA of
females

Based on the alternative hypothesis, it is apparent that thee given test would be a two tail test. Also,
the relevant test statistics would be T since the population standard deviation is not known for either
of the two genders. Further, the two samples are independent, hence 2 sample independent t test has
been deployed whose excel output is highlighted as follows.
Two tail p value is 0.1972 which is greater than the level of significance (0.05). Hence, the available
evidence is not sufficient to reject the null hypothesis and accept the alternative hypothesis. Therefore,
no significant difference exists in the average GPA of the two genders.
2(a) The requisite hypotheses are as highlighted below.
Null Hypothesis: μPG=μUG which implies that no significant difference exists between the average
GPA of students having post graduate parents and under graduate parents.
Alternate Hypothesis: μPG>μUG which implies that average GPA of students having post graduate
parents is higher than the corresponding average GPA for students with under graduate parents.
Based on the alternative hypothesis, it is apparent that thee given test would be a one tail test. Also,
the relevant test statistics would be T since the population standard deviation is not known for either
of the two groups of students. Further, the two samples are independent, hence 2 sample independent
t test has been deployed whose excel output is highlighted as follows.
the relevant test statistics would be T since the population standard deviation is not known for either
of the two genders. Further, the two samples are independent, hence 2 sample independent t test has
been deployed whose excel output is highlighted as follows.
Two tail p value is 0.1972 which is greater than the level of significance (0.05). Hence, the available
evidence is not sufficient to reject the null hypothesis and accept the alternative hypothesis. Therefore,
no significant difference exists in the average GPA of the two genders.
2(a) The requisite hypotheses are as highlighted below.
Null Hypothesis: μPG=μUG which implies that no significant difference exists between the average
GPA of students having post graduate parents and under graduate parents.
Alternate Hypothesis: μPG>μUG which implies that average GPA of students having post graduate
parents is higher than the corresponding average GPA for students with under graduate parents.
Based on the alternative hypothesis, it is apparent that thee given test would be a one tail test. Also,
the relevant test statistics would be T since the population standard deviation is not known for either
of the two groups of students. Further, the two samples are independent, hence 2 sample independent
t test has been deployed whose excel output is highlighted as follows.
⊘ This is a preview!⊘
Do you want full access?
Subscribe today to unlock all pages.

Trusted by 1+ million students worldwide

One tail p value is 0.1972 which is greater than the level of significance (0.05). Hence, the available
evidence is not sufficient to reject the null hypothesis and accept the alternative hypothesis. Therefore,
no significant difference exists in the average GPA of students with post graduate parents and under
graduate parents.
(b) The requisite hypotheses are as highlighted below.
Null Hypothesis: μUG=μS which implies that no significant difference exists between the average GPA
of students having under graduate parents and secondary & below qualification parents
Alternate Hypothesis: μUG>μS which implies that average GPA of students having under graduate
parents is higher than the corresponding average GPA for students with secondary & below
qualification parents.
Based on the alternative hypothesis, it is apparent that thee given test would be a one tail test. Also,
the relevant test statistics would be T since the population standard deviation is not known for either
of the two groups of students. Further, the two samples are independent, hence 2 sample independent
t test has been deployed whose excel output is highlighted as follows.
One tail p value is 0.000 which is lower than the level of significance (0.05). Hence, the available
evidence is sufficient to reject the null hypothesis and accept the alternative hypothesis. Therefore, the
average GPA of students with under graduate parents tends to exceed those students who have parents
with secondary or less qualification.
Task 2: Regression Analysis
3) The requisite correlation matrix is indicated below.
Paraphrase This Document
Need a fresh take? Get an instant paraphrase of this document with our AI Paraphraser

From the above, it is apparent that GPA has the highest correlation with the maths score at high
school Next in line is the ATAR score which also has a correlation coefficient in excess of 0.4. The
lowest correlation amongst the given factors is witnessed for English scores at high school.
4) (i) HS_SCI is a predictor of GPA considering that there is moderate correlation between the
variables. It is also confirmed from the regression output where the slope of this variable is found to
be significant.
(ii) HS_ENG is a predictor of GPA considering that there is moderate correlation between the
variables. It is also confirmed from the regression output where the slope of this variable is found to
be significant.

(iii) HS_MATH is a predictor of GPA considering that there is moderate correlation between the
variables. It is also confirmed from the regression output where the slope of this variable is found to
be significant.
(iv) ATAR is a predictor of GPA considering that there is moderate correlation between the variables.
It is also confirmed from the regression output where the slope of this variable is found to be
significant.
⊘ This is a preview!⊘
Do you want full access?
Subscribe today to unlock all pages.

Trusted by 1+ million students worldwide

5) Step 1 output is indicated below.
Step 2 output is indicated below.
Paraphrase This Document
Need a fresh take? Get an instant paraphrase of this document with our AI Paraphraser

Step 3 output is indicated below.
Step 4 output is indicated below.

Step 5 output is indicated below.
Step 6 output is indicated below.
⊘ This is a preview!⊘
Do you want full access?
Subscribe today to unlock all pages.

Trusted by 1+ million students worldwide

6) The output for step 5 is indicated below.
Interpretation of Slopes
Paraphrase This Document
Need a fresh take? Get an instant paraphrase of this document with our AI Paraphraser

HS_SCI – The slope of this implies that a unit change in the science score at high school would
change the GPA of the student by 0.08. The direction of change in both variables would be same.
HS_ENG - The slope of this implies that a unit change in the English score at high school would
change the GPA of the student by 0.04. The direction of change in both variables would be same.
HS_ MATH - The slope of this implies that a unit change in the Math score at high school would
change the GPA of the student by 0.25. The direction of change in both variables would be same.
PARENT EDUC - The slope of this implies that a unit change in the parent highest education
qualification would change the GPA of the student by 0.28. The direction of change in both variables
would be same.
GENDER – For a female student, the GPA would be higher by 0.11 in comparison with a male
student assuming all other factors are same.
Significance of Slopes
Null Hypothesis: The slope is not significant and can be assumed to be zero.
Alternative Hypothesis: The slope is significant and hence cannot be assumed to be zero.
The relevant test is a two tail test with the test statistics of choice being T. The respective values of the
various t statistics coupled with the p values have already been estimated in the regression model as
indicated below.
The decision rule is that the slope of a given variable would be considered significant only if the
corresponding p value would be lower than 0.05 (significance level). Considering the p value of the
various slope coefficients, it is apparent that the p value corresponding to two variables namely
PARENT EDUC and HS_MATH is lower than 0.05. Hence, the slopes of PARENT EDUC and
HS_MATH are significant while the other slopes are not significant.
7) The negative coefficient of ATAR in step 6 does surprise me since it would be expected that
students have higher value of ATAR would have a higher GPA. It is apparent that the p value

corresponding to the slope of ATAR is 0.91 which is indicative of the fact that the slope of ATAR
variable is not significant and can be assumed to be zero. Thus, it is apparent that the inclusion of
ATAR does not improve the model fit and infact worsens the same which is apparent from the
adjusted R square value.
Task 3: Summary Report
Based on the given sample data and suitable inferential test, it can be inferred that SES has a limited
impact on the academic performance of students. It is essential that a minimum level of under
graduation must be achieved by the parents as higher qualification does not improve performance but
lower qualification does diminish academic performance of students. Also, it can be concluded that
the academic performance of science students is not dependent on the underlying gender.
With regards to regression analysis, it is apparent that as one moves from Step to Step 3,
progressively there is a decline in the slope coefficient attached to variable HS_SCI. With regards to
slope significance, it is apparent that from Step to Step 3, the slope of HS_SCI moves from being
significant to insignificance. If ATAR is considered as a standalone variable, then it is significant as
explained in Task 2. However, when the other variables are already present, then ATAR does not
improve the fit and is an insignificant variable.
Amongst the existing models, Step 4 would be the preferred choice since the predictive capability of
this is the highest as indicated from the adjusted R2 value. However, if a new model may be
constructed, then it would be best to have only two independent variables namely HS_MATH and
PARENT_EDUC. Considering the Step 4 as the final model, the fit remains poor only since the
independent variables collectively offer explanation to 23.22% of the total variations observed in
GPA.
There is requirement to introduce more independent variables having a significant relationship with
GPA while removing the insignificant variables. These new independent variables may include the IQ
level of students, attendance in class, time spent on social media, amount of hours studied. These
individual related variables would be able to enhance the predictability of GPA and hence need to be
introduced.
⊘ This is a preview!⊘
Do you want full access?
Subscribe today to unlock all pages.

Trusted by 1+ million students worldwide
1 out of 12
Related Documents

Your All-in-One AI-Powered Toolkit for Academic Success.
+13062052269
info@desklib.com
Available 24*7 on WhatsApp / Email
Unlock your academic potential
Copyright © 2020–2025 A2Z Services. All Rights Reserved. Developed and managed by ZUCOL.