BSBFIM601: Lecture Notes on Finance and Financial Management
VerifiedAdded on 2021/05/19
|11
|4444
|52
Homework Assignment
AI Summary
This document contains lecture notes for the BSBFIM601 unit on managing finances. It covers essential concepts like financial statements, including the balance sheet, profit and loss statement, and cash flow statement. The notes delve into the accounting equation (Assets = Liabilities + Owners Equity), the components of a balance sheet, and the distinction between current and non-current assets and liabilities. It explains key terms such as accounts receivable, stock, depreciation, and accounts payable, and provides an example balance sheet. The document emphasizes the benefits of analyzing the balance sheet for financial planning and identifying areas of weakness. It also offers tips for reading and analyzing a balance sheet, focusing on asset and liability management. The document is intended to aid in understanding financial management principles.
BSBFIM601 Lecture notes 1 | P a g e
Revised: January 2016
BSBFIM601 – Manage finances lecture notes
Plan financial management approaches
Budgets are an integral part of the management of a business used both for planning and
for diagnostics. The foundation and budgets is financial statements.
Financial statements are nothing more than what you would expect from any statement. A
Statement is a comment made by someone, generally, to a public audience or to a specific
group of people. In everyday life there are different types of statements. One type is
interview statements. Other statements may be those made by officials regarding a trade
agreement or a new piece of legislation etc. Either way a statement is intended to let people
know about a particular situation.
In the case of financial statements, these are a summary of the most important financial
data about the company. Just imagine if all individuals needed to have financial statements
about themselves and an individual was asked to make a statement about their finances
before s/he invited a group of friends to a restaurant. What would be the most important
piece of financial data relevant to that situation? The answer is how much money the
person has to spend on their guests. Likewise, the most important financial statements for a
company are:
• Balance sheet
• Profit and loss statement
• Cash flow statement
Questions to ask yourself about budgets and financial plans:
1. How much money does the company have in the bank?
2. How much money does the company owe to others?
3. Does the company own anything else of value?
4. Is the company making a profit?
5. What are the costs the company is incurring and how much sales are those costs
generating?
Basically, these are the major questions that financial statements answer, so if you trust that
our trip will be a short and simple one, let us start understanding these statements.
The most basic components of financial analysis are assets and liabilities. Quite simply
assets are things you own and liabilities are things you owe. Take a minute to review a
fictional person’s assets and liabilities. Peter is a 26 year old male living in Sydney who
works as a computer programmer. At this very moment, Peter has a bag with him which
contains the following items:
• A wallet worth $20 with a $50 note inside it
Paraphrase This Document
Need a fresh take? Get an instant paraphrase of this document with our AI Paraphraser
BSBFIM601 Lecture notes 2 | P a g e
Revised: January 2016
• Credit card 1 which Peter has spent $300 on
• A handheld computer which Peter has purchased outright worth $700
• A parking fine for $60 which Peter has not paid yet
• A gift voucher from his girlfriend for his birthday worth $50
Finally, the bag which he paid for using credit card 2. He has already paid $100 off that
amount and there is still $150 remaining on the credit card
If we were to analyse Peter’s assets (the things he owns outright), these would be:
1. The wallet worth $20
2. The $50 note
3. The handheld computer worth $700
4. The gift voucher worth $50
5. Part of the bag worth $100 (the part he has already paid for)
As for Peter’s liabilities (the things he owes to others), these are:
1. The $300 on credit card 1 which he is yet to pay
2. The parking fine for $60 which he is yet to pay
3. The remainder of the bag worth $150 which he has not paid yet using credit card 2
Now let us introduce another term - Owners Equity. Owner’s equity is how much does the
owner of these things (Peter) have that is his after he pays off all his debts. Owner’s equity is
calculated as follows:
Owners Equity = Assets – Liabilities
Or in this case:
What Peter owns after paying his debts = The value of things that he owns outright – The
value of debt he must pay off
So:
Owners Equity in Peter’s case =
($20 + $50 + $700 + $50 + $100) – ($300 + $60 + $150) = $410
This means that Peter’s net worth at this present moment under the present set of
circumstances (he only has his bag with him) is $420.
The Accounting Equation
The accounting equation is to accounting what Newton’s laws are to physics. It is a
fundamental formula that all financial professionals agree on. This formula is:
BSBFIM601 Lecture notes 3 | P a g e
Revised: January 2016
Assets = Liabilities + Owners Equity
This is the basis on which important financial documents like the balance sheet work. What
the equation means is precisely what we explained for Peter which is he is only worth what
he has minus what he owes. This basic fundamental will help us understand how companies
change forms of assets from cash to other forms in the hope of making money and how
liabilities impact the value of a business, so let us start with the first of our financial
statements, the balance sheet.
Implement financial management approaches
The Balance Sheet
The most important word above is “balance”. The balance sheet is simply putting the
accounting equation (assets = liabilities + owners equity) into a table. That is really all it is.
So instead of simply stating the equation, we develop a table with two columns; one for
assets and the other for liabilities and owner’s equity and both columns should balance.
Current and Non Current Assets and Liabilities
Not all assets and liabilities are the same. If we look at Peter’s case, for example, the
handheld computer is worth more than the gift voucher. It is also easier to sell and can be
used, generally, for quite a few years before its useful life ends. Imagine if Peter owned a
car. The car would be even more valuable than the handheld computer and would have an
even longer useful life. The same applies to Peter’s liabilities. The $60 fine is generally
payable straight away, whereas a mortgage on his unit takes 25 years to pay. That is why in
the financial world, people have devised ways to distinguish between different assets and
liabilities otherwise we would not know what the business owes and owns. For example if
company A had $250,000 worth of pencils and company B had $250,000 worth of gold
watches, which would be a better buy? Company B would be a better buy if we were
looking to buy a business because gold watches are easier to sell and have a more constant
and lasting value than pencils.
So, Current Assets are those assets that are generally used up within 12 months like cash or
the goods we sell (unless they are capital goods). Non Current Assets, on the other hand, are
assets that are used up in more than 12 months like buildings or machinery.
A car is non current assets whereas a printer cartridge is a current asset.
The same principle applies to Current Liabilities which are those debts due in less than 12
months and Non Current Liabilities which are due in more than 12 months. The minimum
payable amount on a monthly credit card statement is a current liability whereas long term
debt (like the full amount of a mortgage) is a non current liability.
⊘ This is a preview!⊘
Do you want full access?
Subscribe today to unlock all pages.
Trusted by 1+ million students worldwide
BSBFIM601 Lecture notes 4 | P a g e
Revised: January 2016
Total assets are simply all the current and non current assets combined, whereas total
liabilities are current and non current liabilities combined. With this in mind, the balance
sheet now looks like this:
Now let us fill in the gaps and see what a balance sheet looks like once we have put in
details of assets and liabilities just like we did for Peter.
Assets Liabilities + Owners Equity
Current Assets Current Liabilities
Cash $23,500 Accounts payable $7,800
Accounts receivable $11,000
Stock $3,750
Non Current Assets Non Current Liabilities
Building $189,000 Mortgage $95,000
Machinery $67,000
Total Assets Total Liabilities
Owners Equity
Monitor and control finances
Let us define some basic components before we go on to analyse the balance sheet, starting
with some definitions:
Accounts receivable: Money owed to the company for the goods or services it has provided.
This money has not been paid yet, but is due to be paid and is considered an asset of the
business (just like Peter had the $50 gift voucher).
Stock or Inventory: The value of the finished merchandise that the company has produced
and stocked or warehoused
Depreciation: A way of spreading the cost of a non-current asset like a building or machinery
over a number of years (i.e. over its useful life)
Accounts Payable: Money owed by the company to external parties like suppliers or the tax
office
Paraphrase This Document
Need a fresh take? Get an instant paraphrase of this document with our AI Paraphraser
BSBFIM601 Lecture notes 5 | P a g e
Revised: January 2016
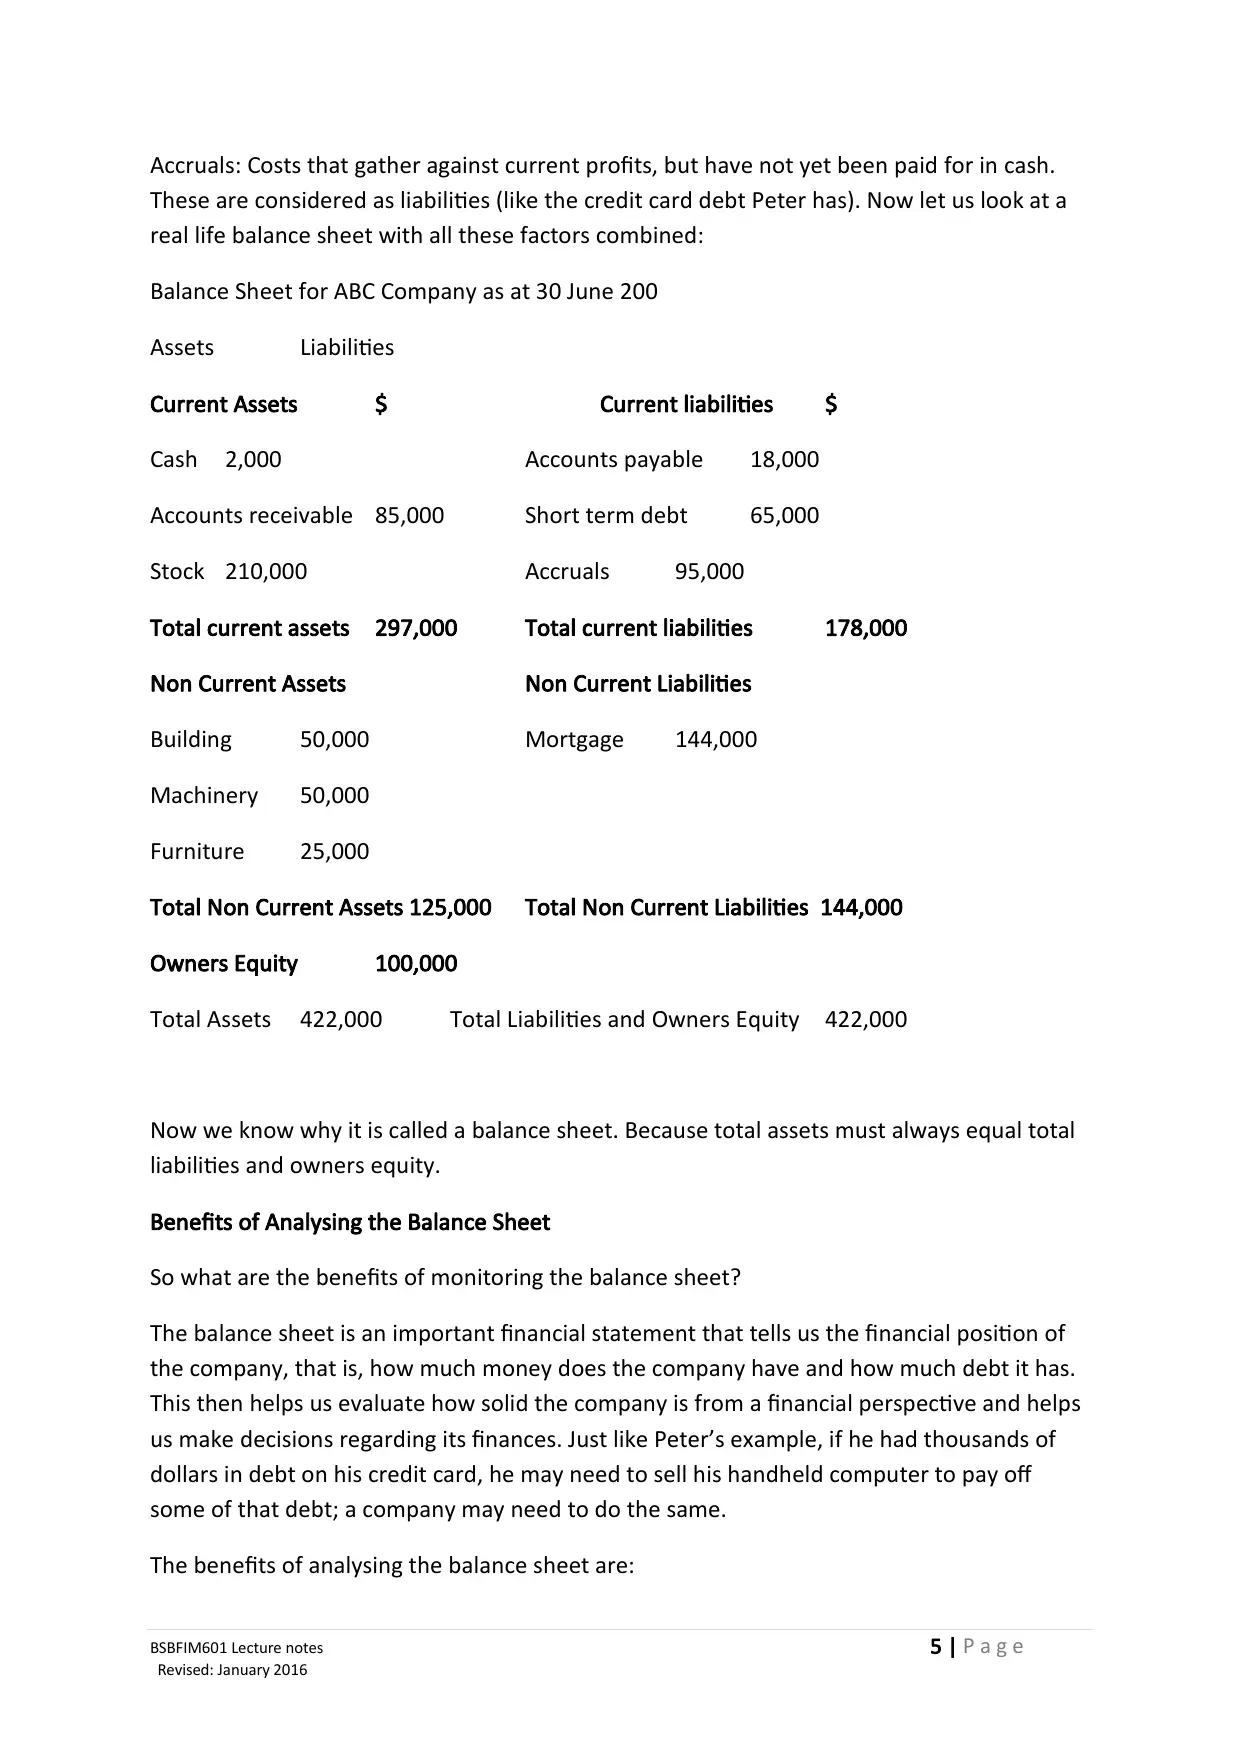
Accruals: Costs that gather against current profits, but have not yet been paid for in cash.
These are considered as liabilities (like the credit card debt Peter has). Now let us look at a
real life balance sheet with all these factors combined:
Balance Sheet for ABC Company as at 30 June 200
Assets Liabilities
Current Assets $ Current liabilities $
Cash 2,000 Accounts payable 18,000
Accounts receivable 85,000 Short term debt 65,000
Stock 210,000 Accruals 95,000
Total current assets 297,000 Total current liabilities 178,000
Non Current Assets Non Current Liabilities
Building 50,000 Mortgage 144,000
Machinery 50,000
Furniture 25,000
Total Non Current Assets 125,000 Total Non Current Liabilities 144,000
Owners Equity 100,000
Total Assets 422,000 Total Liabilities and Owners Equity 422,000
Now we know why it is called a balance sheet. Because total assets must always equal total
liabilities and owners equity.
Benefits of Analysing the Balance Sheet
So what are the benefits of monitoring the balance sheet?
The balance sheet is an important financial statement that tells us the financial position of
the company, that is, how much money does the company have and how much debt it has.
This then helps us evaluate how solid the company is from a financial perspective and helps
us make decisions regarding its finances. Just like Peter’s example, if he had thousands of
dollars in debt on his credit card, he may need to sell his handheld computer to pay off
some of that debt; a company may need to do the same.
The benefits of analysing the balance sheet are:
Revised: January 2016
Accruals: Costs that gather against current profits, but have not yet been paid for in cash.
These are considered as liabilities (like the credit card debt Peter has). Now let us look at a
real life balance sheet with all these factors combined:
Balance Sheet for ABC Company as at 30 June 200
Assets Liabilities
Current Assets $ Current liabilities $
Cash 2,000 Accounts payable 18,000
Accounts receivable 85,000 Short term debt 65,000
Stock 210,000 Accruals 95,000
Total current assets 297,000 Total current liabilities 178,000
Non Current Assets Non Current Liabilities
Building 50,000 Mortgage 144,000
Machinery 50,000
Furniture 25,000
Total Non Current Assets 125,000 Total Non Current Liabilities 144,000
Owners Equity 100,000
Total Assets 422,000 Total Liabilities and Owners Equity 422,000
Now we know why it is called a balance sheet. Because total assets must always equal total
liabilities and owners equity.
Benefits of Analysing the Balance Sheet
So what are the benefits of monitoring the balance sheet?
The balance sheet is an important financial statement that tells us the financial position of
the company, that is, how much money does the company have and how much debt it has.
This then helps us evaluate how solid the company is from a financial perspective and helps
us make decisions regarding its finances. Just like Peter’s example, if he had thousands of
dollars in debt on his credit card, he may need to sell his handheld computer to pay off
some of that debt; a company may need to do the same.
The benefits of analysing the balance sheet are:
BSBFIM601 Lecture notes 6 | P a g e
Revised: January 2016
1. It provides a clear view of the company’s assets and liabilities
2. Allows for a quick evaluation of the financial position of the company
3. Aids in planning
4. Identifies areas of weakness like high percentages of accounts receivable that have
not been paid, over-valuing non current assets etc. (over-valuing non current assets
happens if Peter says that his handheld computer is worth, say $3000 rather than its
true value which is far less)
Analysing the Balance Sheet
There are always tricks for any trade and in the finance world, the following are some tips
on how to read and analyse a balance sheet with limited hassle. Some of the basic things to
look out for when looking at a balance sheet are:
Assets should be as high as possible and in a form that is of value to the company. For
example, if accounts receivable is the highest asset a company owns, then this is not as
good as stock or buildings. Accounts receivable are the promise of money which is different
from money itself. Of course in most small businesses, the best asset to have is cash in the
bank as this is easily transferred into other forms of assets like machinery or stock.
Remember, if you have cash it is very easy to buy goods as everyone will want to sell you
what they have, but it is far more difficult converting other assets into cash (have you tried
selling old furniture lately?).
Liabilities should be as low as possible so as to ensure the company can pay off its debts
when required. Also, liabilities have a habit of accumulating and growing over time and of
appearing less than they really are. So, a focus on reducing liabilities, especially short term
debt is important. Think of your credit card. The interest rate on a credit card could be
anywhere between 14 to 19%. Credit cards are considered a form of short term debt which
attracts a high interest rate. Now think of a mortgage. This is certainly long term debt and
the interest rate on this is likely to be much lower than that for short term debt (for
example 6%). That is why it is a good idea to reduce your short term debt (or liabilities) and
this is something to look out for in a balance sheet
If you are in the process of buying a business, owner’s equity is also an important area to
look at. The higher the owner’s equity, the more the owner has in value. The ultimate goal
for any business whether it is a small private company or a large publicly listed company is
to increase owner’s equity. This is sometimes referred to as shareholder value in the
business press and simply means increasing the value of each share and its earnings and
what it owns.
⊘ This is a preview!⊘
Do you want full access?
Subscribe today to unlock all pages.
Trusted by 1+ million students worldwide
BSBFIM601 Lecture notes 7 | P a g e
Revised: January 2016
Review and evaluate financial management processes
Profit and Loss Statement
The balance sheet is a good tool when it comes to telling us about the financial position of a
business, but it does not tell how profitable the business is. By way of illustration, a
company could have high-valued assets, low liabilities but lower than average profits. This
means that if we improve the profits the balance sheet will look even better.
Low or unsatisfactory profits are a symptom of bad management, market conditions or
other factors. But regardless of the reasons behind low profits, they end up impacting the
balance sheet at some stage and eventually bring down assets and increase liabilities. If we
look at poor old Peter again, then an example would look something like this:
Peter used to make $45,000 a year and saves around $4,000 a year. His assets and liabilities
are the same as they were in the example above, but he now decides to enter the world of
cuisine. It has always been his dream to become a chef and he decided to leave his current
job, learn to become a chef and work part time as a trainee chef. This means that his income
has now dropped to $30,000 a year and he can only save $1500 a year. Even though his
assets and liabilities are the same at present, with time his liabilities will increase if he
maintains the same lifestyle as that he currently has. Because his income is less and his costs
are the same, his liabilities will gradually increase and bring down the value of his assets. In
pure profitability terms, Peter has become less profitable.
For this reason financial analysts devised a statement to show us how profitable a company
is. The statement is called the Profit and Loss Statement (or P&L for short). The P&L tells us
how much money the company is making, how much it is spending and how much is left
over. It is one level down from the balance sheet as the balance sheet tells us the story after
the event (after the P&L has been produced and rolled up with all the other financial
statements we will study later).
As professional business people, it is important for us to be able to read and understand a
P&L. So, what is a P&L made up of?
The P&L is based on a simple formula and this is:
Income = Revenue – Expenses
Income is another word for profit and represents the value of money remaining after we
have paid off all expenses required to produce that income. For example if we invest $5,000
in a coffee machine and $500 in coffee beans and as a result sell $7,000 worth of coffee, our
income or profit before tax is:
$7,000 – ($5,000 + $500) = $1,500
Paraphrase This Document
Need a fresh take? Get an instant paraphrase of this document with our AI Paraphraser
BSBFIM601 Lecture notes 8 | P a g e
Revised: January 2016
Revenue is the value of sales we achieve. In the coffee example above, revenue is $7,000
and represents what we have sold in coffees.
Expenses are the costs we incur during the course of conducting business. Again, in the case
of the coffee we have spent $5,000 on a coffee machine and $500 on coffee beans which
means our expenses were $5,500. We will see later on that there are other expenses like tax
expenses, the cost of borrowing money and the cost of depreciation of the coffee machine.
With this in mind, we now know that the basic components of a P&L are:
1. Sales (that generate revenue)
2. Costs (that are an expense)
But before we go to a P&L sample, we need to appreciate that there are different types of
costs.
Types of Costs
There are primarily 2 types of costs:
1. Cost of Goods Sold (or COGS)
2. Operating expenses
Cost of Goods Sold (COGS) are the costs associated with the manufacturing of a product if
we actually manufacture it. Otherwise, it is the cost, to us, of buying that good so that we
can on-sell it. If we sell a service, then it is the cost of that service to us before we on-sell it.
If we were to buy 5 TV’s to sell at our shop and each TV cost us $700 from the supplier, then
our COGS for each TV is $700. It is important to keep in mind that COGS are just the cost of
the goods, not our time, the rent we pay for the shop, the salaries of staff or anything else-
just the cost of the goods.
Operating expenses, on the other hand, are other costs associated with selling products and
services. Some of these include things like:
1. Salaries
2. Freight
3. Marketing and advertising
4. Electricity and gas bills
5. Rent
6. Insurance
7. Tax
8. Interest
9. Depreciation
10. Council rates
11. Other P&L-related Definitions
BSBFIM601 Lecture notes 9 | P a g e
Revised: January 2016
Some other definitions to keep in mind are:
Other Sources of Income: Some companies make investments in shares, bonds or other
forms of financial instruments or may have a rent income from one of their buildings etc.
This is considered as other sources of income and is mentioned in the P&L because it
represents part of the business’ financial decisions.
Total Expenses: Is the sum of all expenses (COGS + operating expenses) and is used for
simplicity as it shows the reader of the financial statement what the total costs were for the
company in any given time frame.
Gross Profit: Is the profit made before taking operating expenses into account. That is if we
buy a TV for $700 and sell it for $900, our gross profit is $200. This has not taken into
account the operating expenses incurred to sell the TV like rent, salaries and other costs.
The reason why we use gross profit is that it gives us an idea of the contribution of different
types of goods to our profits. For example if we sold fridges too and a fridge cost us $900,
but we sold it for $1500, then fridges would be a more important product for our business
because we make more money from selling a fridge than we do selling a TV. Gross profit
also helps us monitor our supplier’s prices and ensure we understand what we are paying.
This in turn helps us negotiate the best possible supply prices to our business so that we can
maximise gross profit.
Net Profit before Tax: Represents the difference between all of our costs (COGS + operating
expenses) and the value of sales we make. So, if the $700 TV incurs operating expenses of
$100 and is sold for $900, the net profit before tax for 1 TV unit would be:
Net profit before tax = sales – (COGS + operating expenses) = $900 – ($700 + $100) = $100
net profit before tax per TV sold
Net Profit after Tax: Represents the final profit we make after we have paid all expenses
including taxes. This is the ultimate profit and represents the money that goes into the
business bank account after all our expenses have been paid (if you remember owners
equity, then this number would also go into the owners equity column of the balance sheet
unless it is used to buy additional items for the business or is placed in the business
operating account in the bank in which case it becomes an asset)
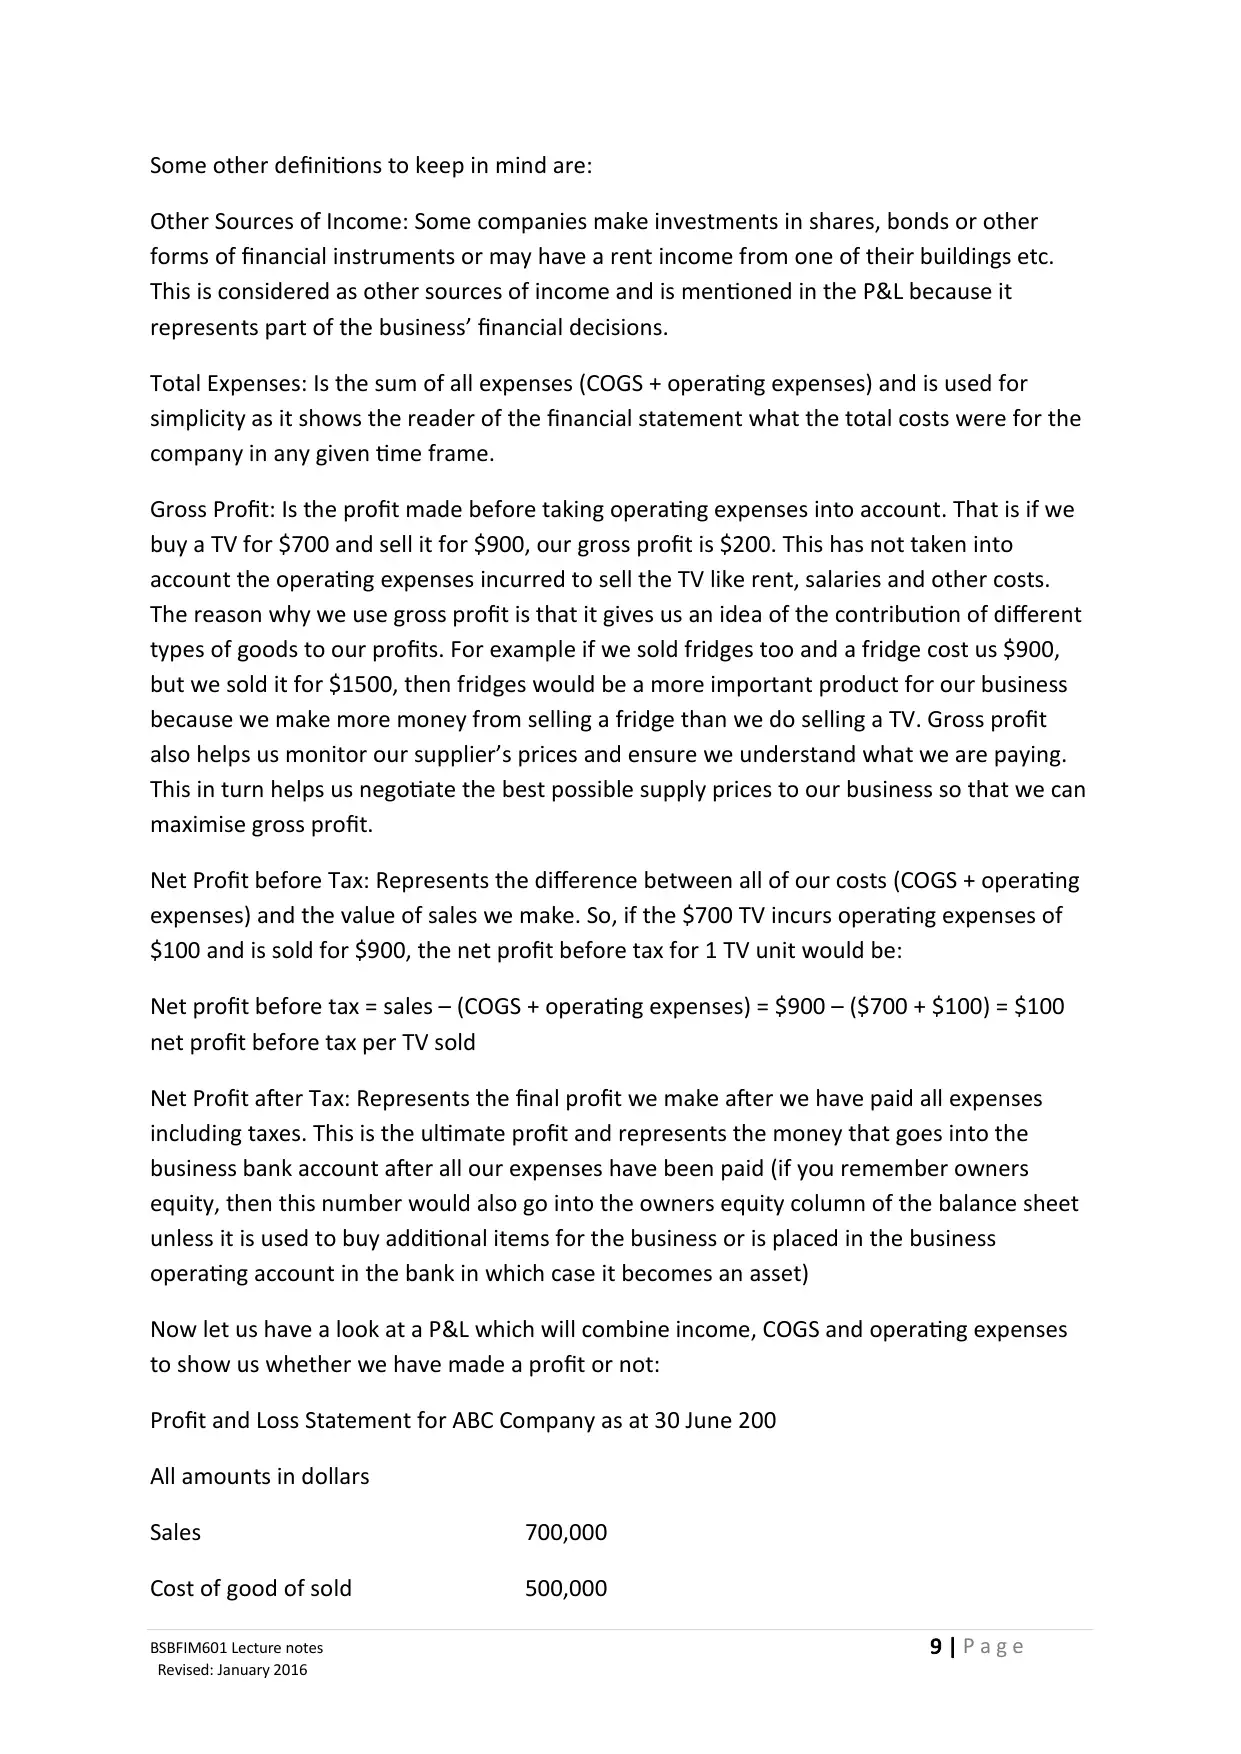
Now let us have a look at a P&L which will combine income, COGS and operating expenses
to show us whether we have made a profit or not:
Profit and Loss Statement for ABC Company as at 30 June 200
All amounts in dollars
Sales 700,000
Cost of good of sold 500,000
Revised: January 2016
Some other definitions to keep in mind are:
Other Sources of Income: Some companies make investments in shares, bonds or other
forms of financial instruments or may have a rent income from one of their buildings etc.
This is considered as other sources of income and is mentioned in the P&L because it
represents part of the business’ financial decisions.
Total Expenses: Is the sum of all expenses (COGS + operating expenses) and is used for
simplicity as it shows the reader of the financial statement what the total costs were for the
company in any given time frame.
Gross Profit: Is the profit made before taking operating expenses into account. That is if we
buy a TV for $700 and sell it for $900, our gross profit is $200. This has not taken into
account the operating expenses incurred to sell the TV like rent, salaries and other costs.
The reason why we use gross profit is that it gives us an idea of the contribution of different
types of goods to our profits. For example if we sold fridges too and a fridge cost us $900,
but we sold it for $1500, then fridges would be a more important product for our business
because we make more money from selling a fridge than we do selling a TV. Gross profit
also helps us monitor our supplier’s prices and ensure we understand what we are paying.
This in turn helps us negotiate the best possible supply prices to our business so that we can
maximise gross profit.
Net Profit before Tax: Represents the difference between all of our costs (COGS + operating
expenses) and the value of sales we make. So, if the $700 TV incurs operating expenses of
$100 and is sold for $900, the net profit before tax for 1 TV unit would be:
Net profit before tax = sales – (COGS + operating expenses) = $900 – ($700 + $100) = $100
net profit before tax per TV sold
Net Profit after Tax: Represents the final profit we make after we have paid all expenses
including taxes. This is the ultimate profit and represents the money that goes into the
business bank account after all our expenses have been paid (if you remember owners
equity, then this number would also go into the owners equity column of the balance sheet
unless it is used to buy additional items for the business or is placed in the business
operating account in the bank in which case it becomes an asset)
Now let us have a look at a P&L which will combine income, COGS and operating expenses
to show us whether we have made a profit or not:
Profit and Loss Statement for ABC Company as at 30 June 200
All amounts in dollars
Sales 700,000
Cost of good of sold 500,000
⊘ This is a preview!⊘
Do you want full access?
Subscribe today to unlock all pages.
Trusted by 1+ million students worldwide
BSBFIM601 Lecture notes 10 | P a g e
Revised: January 2016
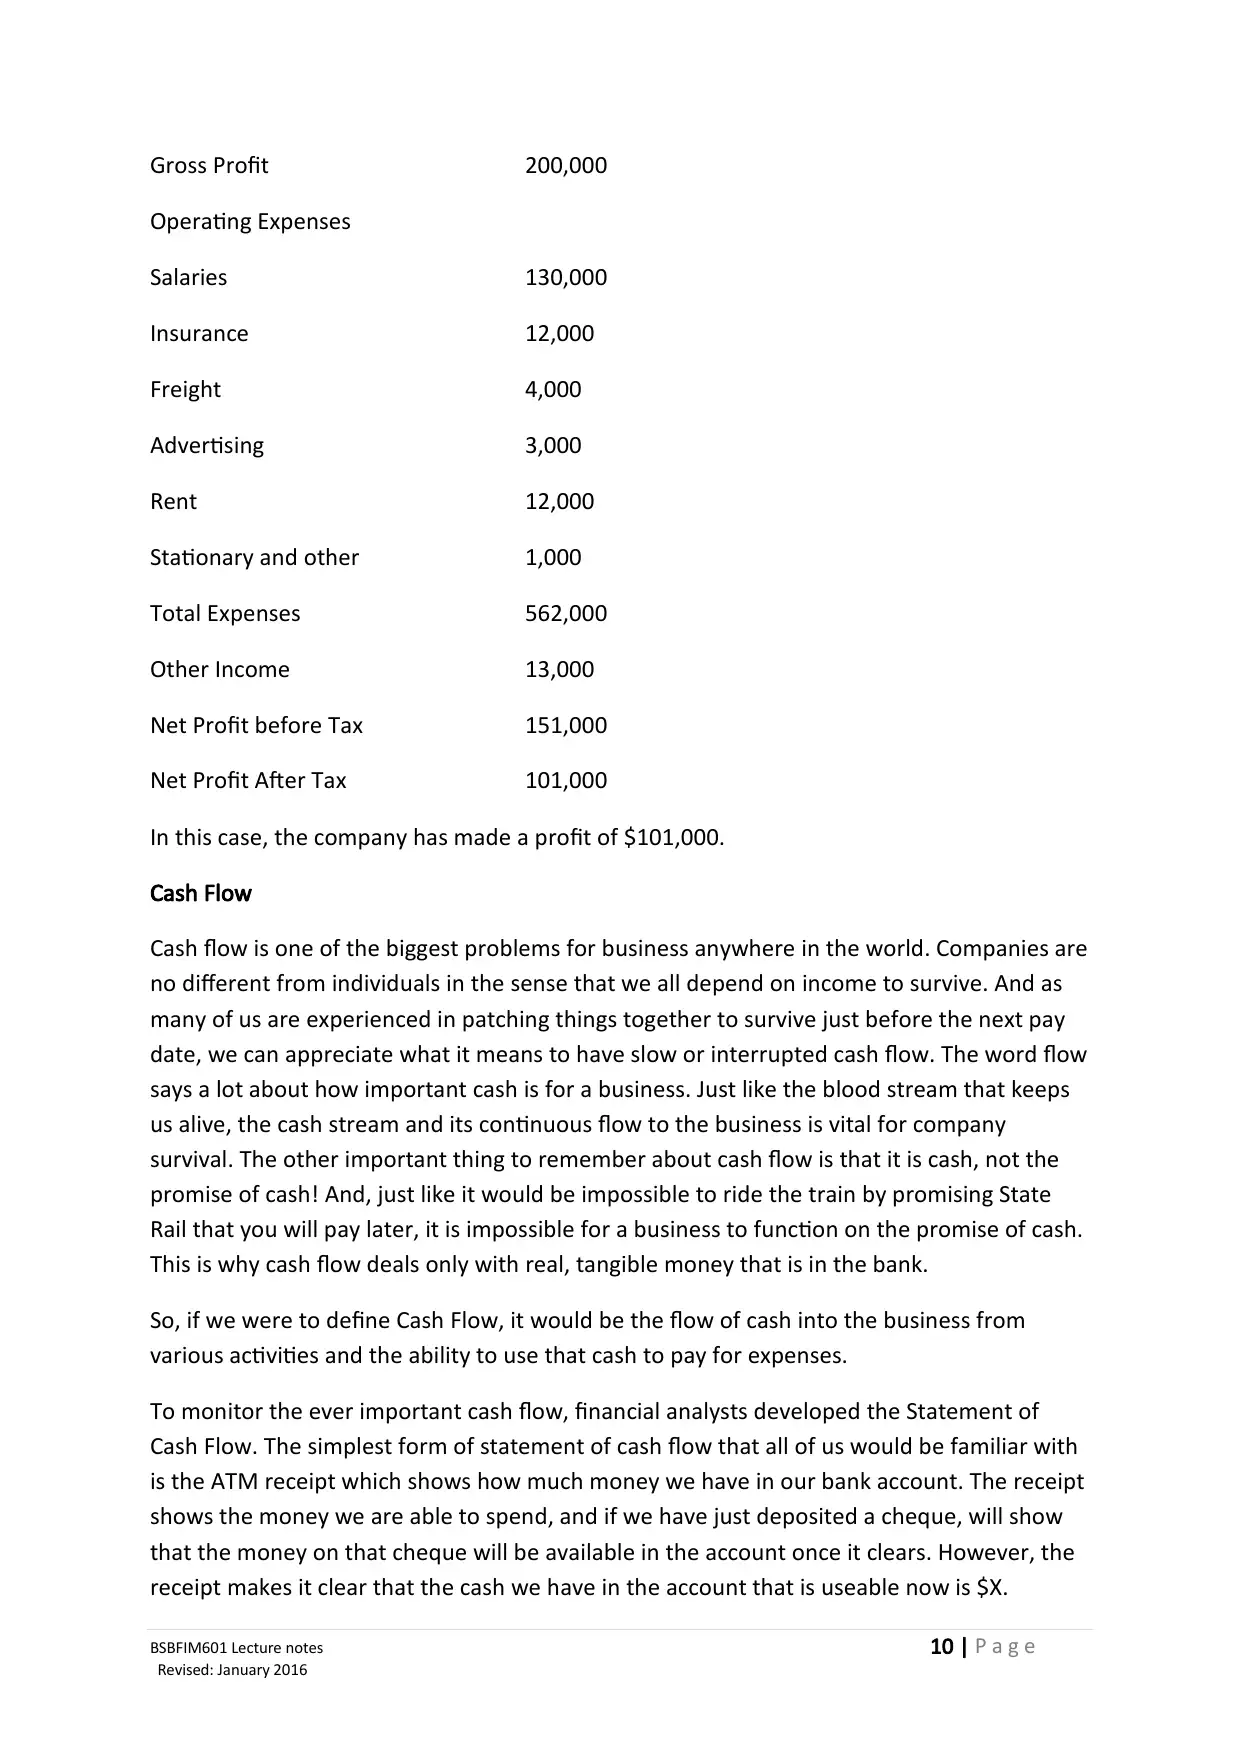
Gross Profit 200,000
Operating Expenses
Salaries 130,000
Insurance 12,000
Freight 4,000
Advertising 3,000
Rent 12,000
Stationary and other 1,000
Total Expenses 562,000
Other Income 13,000
Net Profit before Tax 151,000
Net Profit After Tax 101,000
In this case, the company has made a profit of $101,000.
Cash Flow
Cash flow is one of the biggest problems for business anywhere in the world. Companies are
no different from individuals in the sense that we all depend on income to survive. And as
many of us are experienced in patching things together to survive just before the next pay
date, we can appreciate what it means to have slow or interrupted cash flow. The word flow
says a lot about how important cash is for a business. Just like the blood stream that keeps
us alive, the cash stream and its continuous flow to the business is vital for company
survival. The other important thing to remember about cash flow is that it is cash, not the
promise of cash! And, just like it would be impossible to ride the train by promising State
Rail that you will pay later, it is impossible for a business to function on the promise of cash.
This is why cash flow deals only with real, tangible money that is in the bank.
So, if we were to define Cash Flow, it would be the flow of cash into the business from
various activities and the ability to use that cash to pay for expenses.
To monitor the ever important cash flow, financial analysts developed the Statement of
Cash Flow. The simplest form of statement of cash flow that all of us would be familiar with
is the ATM receipt which shows how much money we have in our bank account. The receipt
shows the money we are able to spend, and if we have just deposited a cheque, will show
that the money on that cheque will be available in the account once it clears. However, the
receipt makes it clear that the cash we have in the account that is useable now is $X.
Revised: January 2016
Gross Profit 200,000
Operating Expenses
Salaries 130,000
Insurance 12,000
Freight 4,000
Advertising 3,000
Rent 12,000
Stationary and other 1,000
Total Expenses 562,000
Other Income 13,000
Net Profit before Tax 151,000
Net Profit After Tax 101,000
In this case, the company has made a profit of $101,000.
Cash Flow
Cash flow is one of the biggest problems for business anywhere in the world. Companies are
no different from individuals in the sense that we all depend on income to survive. And as
many of us are experienced in patching things together to survive just before the next pay
date, we can appreciate what it means to have slow or interrupted cash flow. The word flow
says a lot about how important cash is for a business. Just like the blood stream that keeps
us alive, the cash stream and its continuous flow to the business is vital for company
survival. The other important thing to remember about cash flow is that it is cash, not the
promise of cash! And, just like it would be impossible to ride the train by promising State
Rail that you will pay later, it is impossible for a business to function on the promise of cash.
This is why cash flow deals only with real, tangible money that is in the bank.
So, if we were to define Cash Flow, it would be the flow of cash into the business from
various activities and the ability to use that cash to pay for expenses.
To monitor the ever important cash flow, financial analysts developed the Statement of
Cash Flow. The simplest form of statement of cash flow that all of us would be familiar with
is the ATM receipt which shows how much money we have in our bank account. The receipt
shows the money we are able to spend, and if we have just deposited a cheque, will show
that the money on that cheque will be available in the account once it clears. However, the
receipt makes it clear that the cash we have in the account that is useable now is $X.
Paraphrase This Document
Need a fresh take? Get an instant paraphrase of this document with our AI Paraphraser
BSBFIM601 Lecture notes 11 | P a g e
Revised: January 2016
The statement of cash flow for a business shows what actual cash amounts have come into
the business and what cash amounts have left the business and what remains. Again, to
confirm, we are only dealing with actual cash that is physically in the account and can be
used, not the promise of cash, not credit and not an invoice that is due for payment today-
just cash!
1 out of 11
Related Documents


Your All-in-One AI-Powered Toolkit for Academic Success.
+13062052269
info@desklib.com
Available 24*7 on WhatsApp / Email
![[object Object]](/_next/static/media/star-bottom.7253800d.svg)
Unlock your academic potential
Copyright © 2020–2026 A2Z Services. All Rights Reserved. Developed and managed by ZUCOL.