Financial Analysis and Performance Evaluation: BT Group PLC Report
VerifiedAdded on 2023/01/17
|16
|3136
|53
Report
AI Summary
This report presents a financial analysis of BT Group PLC, a major telecommunications company, evaluating its performance over the period of 2016 to 2018. The analysis begins with an overview of the company's background and external environment, including its key activities and strategic goals. The core of the report involves a detailed examination of BT Group PLC's financial statements, focusing on profitability, liquidity, efficiency, solvency, and investment ratios. The report compares the financial performance of BT Group PLC with industry competitors using common size statements, highlighting key trends and variations. The analysis provides interpretations of the financial ratios and offers insights into the company's strengths and weaknesses, discussing the impact of market conditions and internal factors on its financial health. The report concludes with recommendations for improving BT Group PLC's financial performance and adapting to the evolving telecommunications landscape.

Accounting and Finance
Paraphrase This Document
Need a fresh take? Get an instant paraphrase of this document with our AI Paraphraser
Table of Contents
INTRODUCTION...........................................................................................................................3
1. Background and external analysis of an organization over previous 3 years .........................3
2. Performance evaluation ..........................................................................................................4
3. Comparative analysis of common size statement ...................................................................4
CONCLUSION..............................................................................................................................10
REFERENCES................................................................................................................................1
INTRODUCTION
Accounting refers to system of recording the financial transactions of the business in
addition with storing, retrieving, summarizing, sorting and communicating the results to the
users that help in their decision making. On the other hand, finance referred as the study of
managing money and a practice of acquiring the funds needed. The present report is based on BT
group plc, a largest British multinational company operating its business within
telecommunication industry. Furthermore, the study involves background of the company and
analysing the financials of firm in comparison with its competitor for highlighting the analysis
regarding the performance and position of the firm in the overall industry. Moreover, appropriate
recommendations are been made in relation to appropriate measures that the company should
take for improving and enhancing its performance.
1. Background and external analysis of an organization over previous 3 years
BT is seen as one of the leading communication service firm that serves needs of the
customers in UK across 180 countries worldwide. The main activities of the company includes
provision of the fixed line services, mobile, TV products, broadband and the networked IT
services. It is the company that serves a global multinational enterprise with their security,
networking and the cloud computing (Overview of BT Group plc, 2018). The main purpose of
the company is to make use of the communications for making the world more and more better.
Its strategy is in leading with the converged services and the connectivity, capitalising on the
new business opportunities and in delivering an industry leading towards operational efficiency.
Over the 3 years, In terms of opportunities, market development of the company leads to
the dilution of the competitive edge and helps the BT group in increasing competitiveness
against its rivalry. Along with the new trends in consumer behaviour come up with the new
market for BT group plc and facilitates a great opportunity for the company in building new
streams of revenue and in diversifying into categories of new products. Core competencies of an
entity could be a success factor similar to the other fields of product. New technology provided
an opportunity to the BT group plc to the practices of pricing strategy in new market. It assist the
company in maintaining loyal customers with the great service and attracted new customers by
the value propositions. Growth in the economy and increased customer spending after the
recession years and slower growth rate within an industry is counted as an opportunity for the BT
group plc in capturing large customers and widening the market share. Government green drive
⊘ This is a preview!⊘
Do you want full access?
Subscribe today to unlock all pages.
Trusted by 1+ million students worldwide
also had opened up for an opportunity in procurement of the BT group plc products by state and
the federal contractors.
In addition to these opportunities, BT group faces many problems in respect of new and
innovative technologies had been developed by competitors in the medium to the long term
future. As the company is operating its business in several countries, it is been exposed to the
currency fluctuations specifically giving a volatile political climate in the large number of the
markets around the globe (Grimm and Blazovich, 2016). The company is exposed towards
different liability claims that are present in changing policies within the markets. Imitation of
counterfeit and products with low quality is the major problem faced by BT group in the
emerging and the low profitable markets.
2. Performance evaluation
Evaluation of Financial statements of BT Group plc for the past three years that are 2016,2017
and 2018.
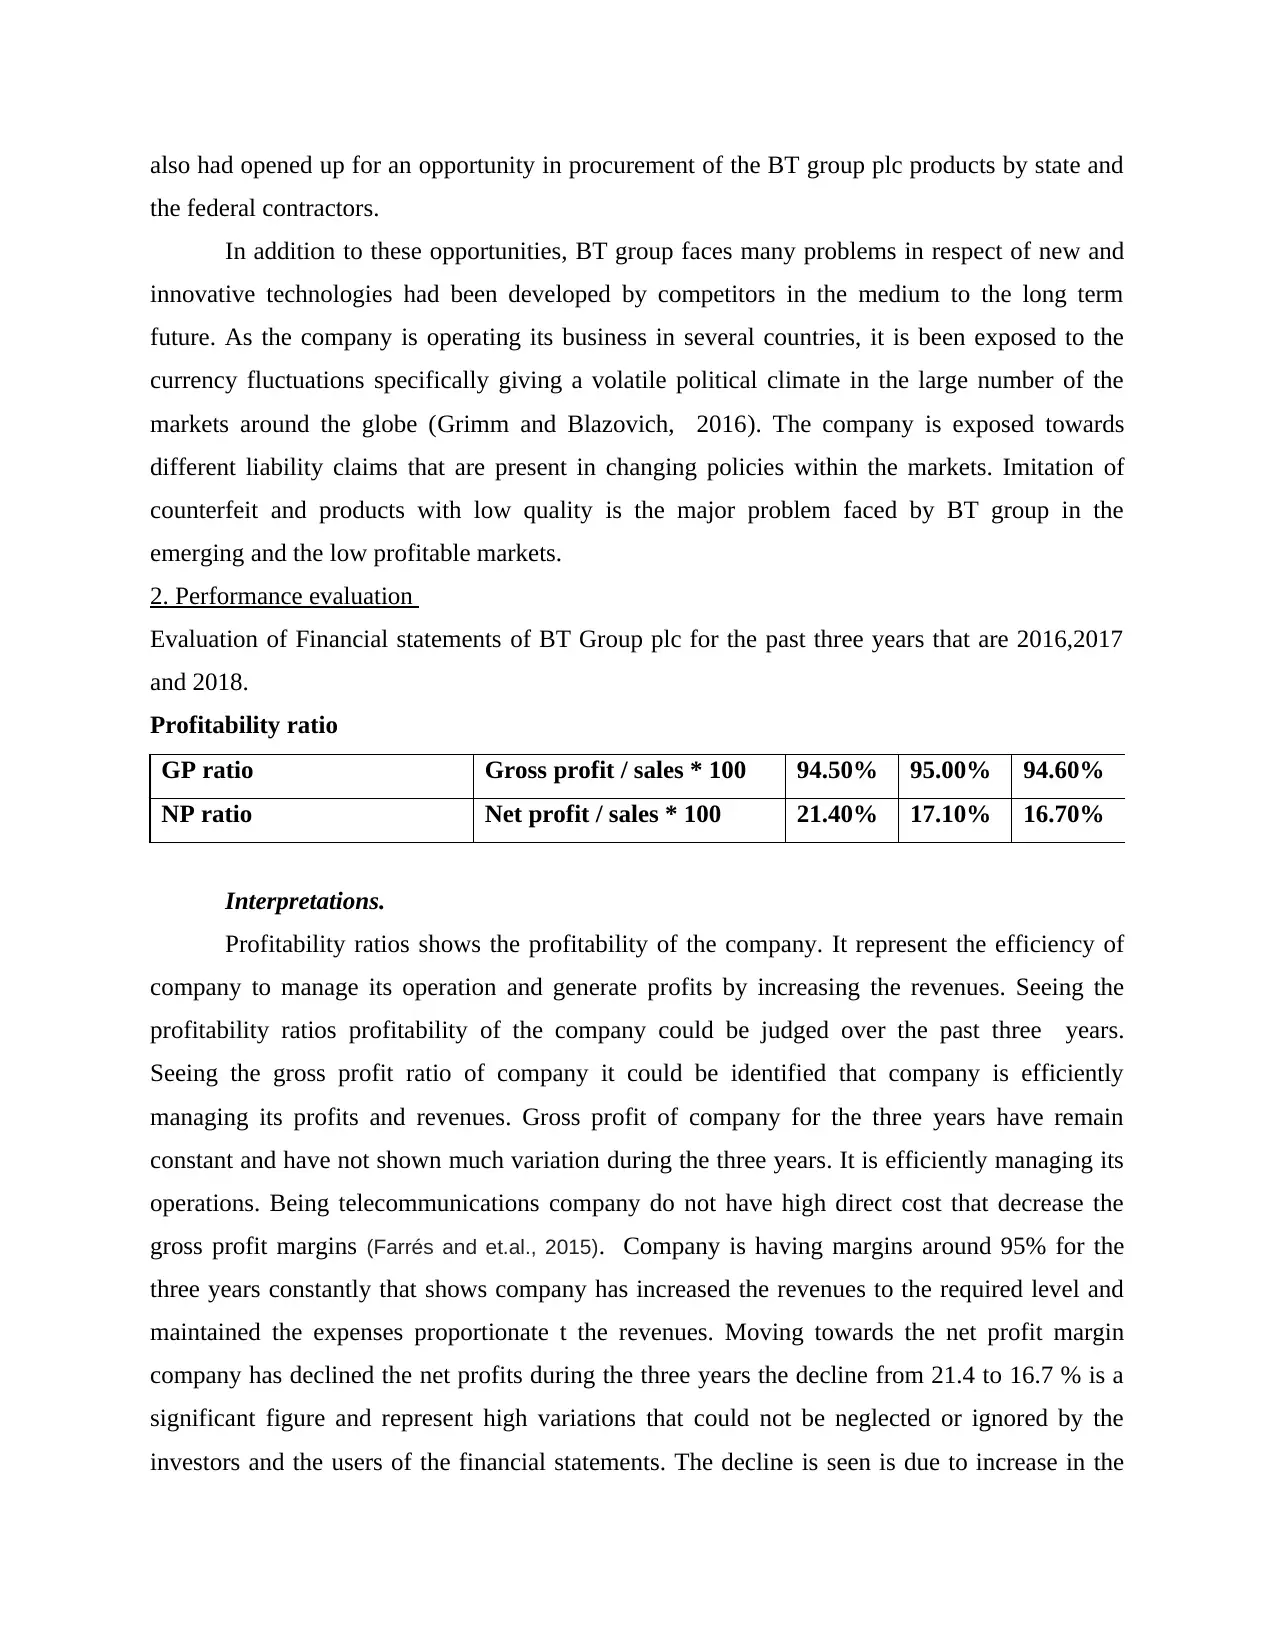
Profitability ratio
GP ratio Gross profit / sales * 100 94.50% 95.00% 94.60%
NP ratio Net profit / sales * 100 21.40% 17.10% 16.70%
Interpretations.
Profitability ratios shows the profitability of the company. It represent the efficiency of
company to manage its operation and generate profits by increasing the revenues. Seeing the
profitability ratios profitability of the company could be judged over the past three years.
Seeing the gross profit ratio of company it could be identified that company is efficiently
managing its profits and revenues. Gross profit of company for the three years have remain
constant and have not shown much variation during the three years. It is efficiently managing its
operations. Being telecommunications company do not have high direct cost that decrease the
gross profit margins (Farrés and et.al., 2015). Company is having margins around 95% for the
three years constantly that shows company has increased the revenues to the required level and
maintained the expenses proportionate t the revenues. Moving towards the net profit margin
company has declined the net profits during the three years the decline from 21.4 to 16.7 % is a
significant figure and represent high variations that could not be neglected or ignored by the
investors and the users of the financial statements. The decline is seen is due to increase in the
the federal contractors.
In addition to these opportunities, BT group faces many problems in respect of new and
innovative technologies had been developed by competitors in the medium to the long term
future. As the company is operating its business in several countries, it is been exposed to the
currency fluctuations specifically giving a volatile political climate in the large number of the
markets around the globe (Grimm and Blazovich, 2016). The company is exposed towards
different liability claims that are present in changing policies within the markets. Imitation of
counterfeit and products with low quality is the major problem faced by BT group in the
emerging and the low profitable markets.
2. Performance evaluation
Evaluation of Financial statements of BT Group plc for the past three years that are 2016,2017
and 2018.
Profitability ratio
GP ratio Gross profit / sales * 100 94.50% 95.00% 94.60%
NP ratio Net profit / sales * 100 21.40% 17.10% 16.70%
Interpretations.
Profitability ratios shows the profitability of the company. It represent the efficiency of
company to manage its operation and generate profits by increasing the revenues. Seeing the
profitability ratios profitability of the company could be judged over the past three years.
Seeing the gross profit ratio of company it could be identified that company is efficiently
managing its profits and revenues. Gross profit of company for the three years have remain
constant and have not shown much variation during the three years. It is efficiently managing its
operations. Being telecommunications company do not have high direct cost that decrease the
gross profit margins (Farrés and et.al., 2015). Company is having margins around 95% for the
three years constantly that shows company has increased the revenues to the required level and
maintained the expenses proportionate t the revenues. Moving towards the net profit margin
company has declined the net profits during the three years the decline from 21.4 to 16.7 % is a
significant figure and represent high variations that could not be neglected or ignored by the
investors and the users of the financial statements. The decline is seen is due to increase in the
Paraphrase This Document
Need a fresh take? Get an instant paraphrase of this document with our AI Paraphraser
government licensing fees that increased the operational cost of company. The profit has shown
a continuous decline as company has not increased the revenues as against the expenses. Also the
company has suffered during the recent past because of high competition in the market and
lowered prices by competitor forced company to cut its prices that dropped the profits of
company.
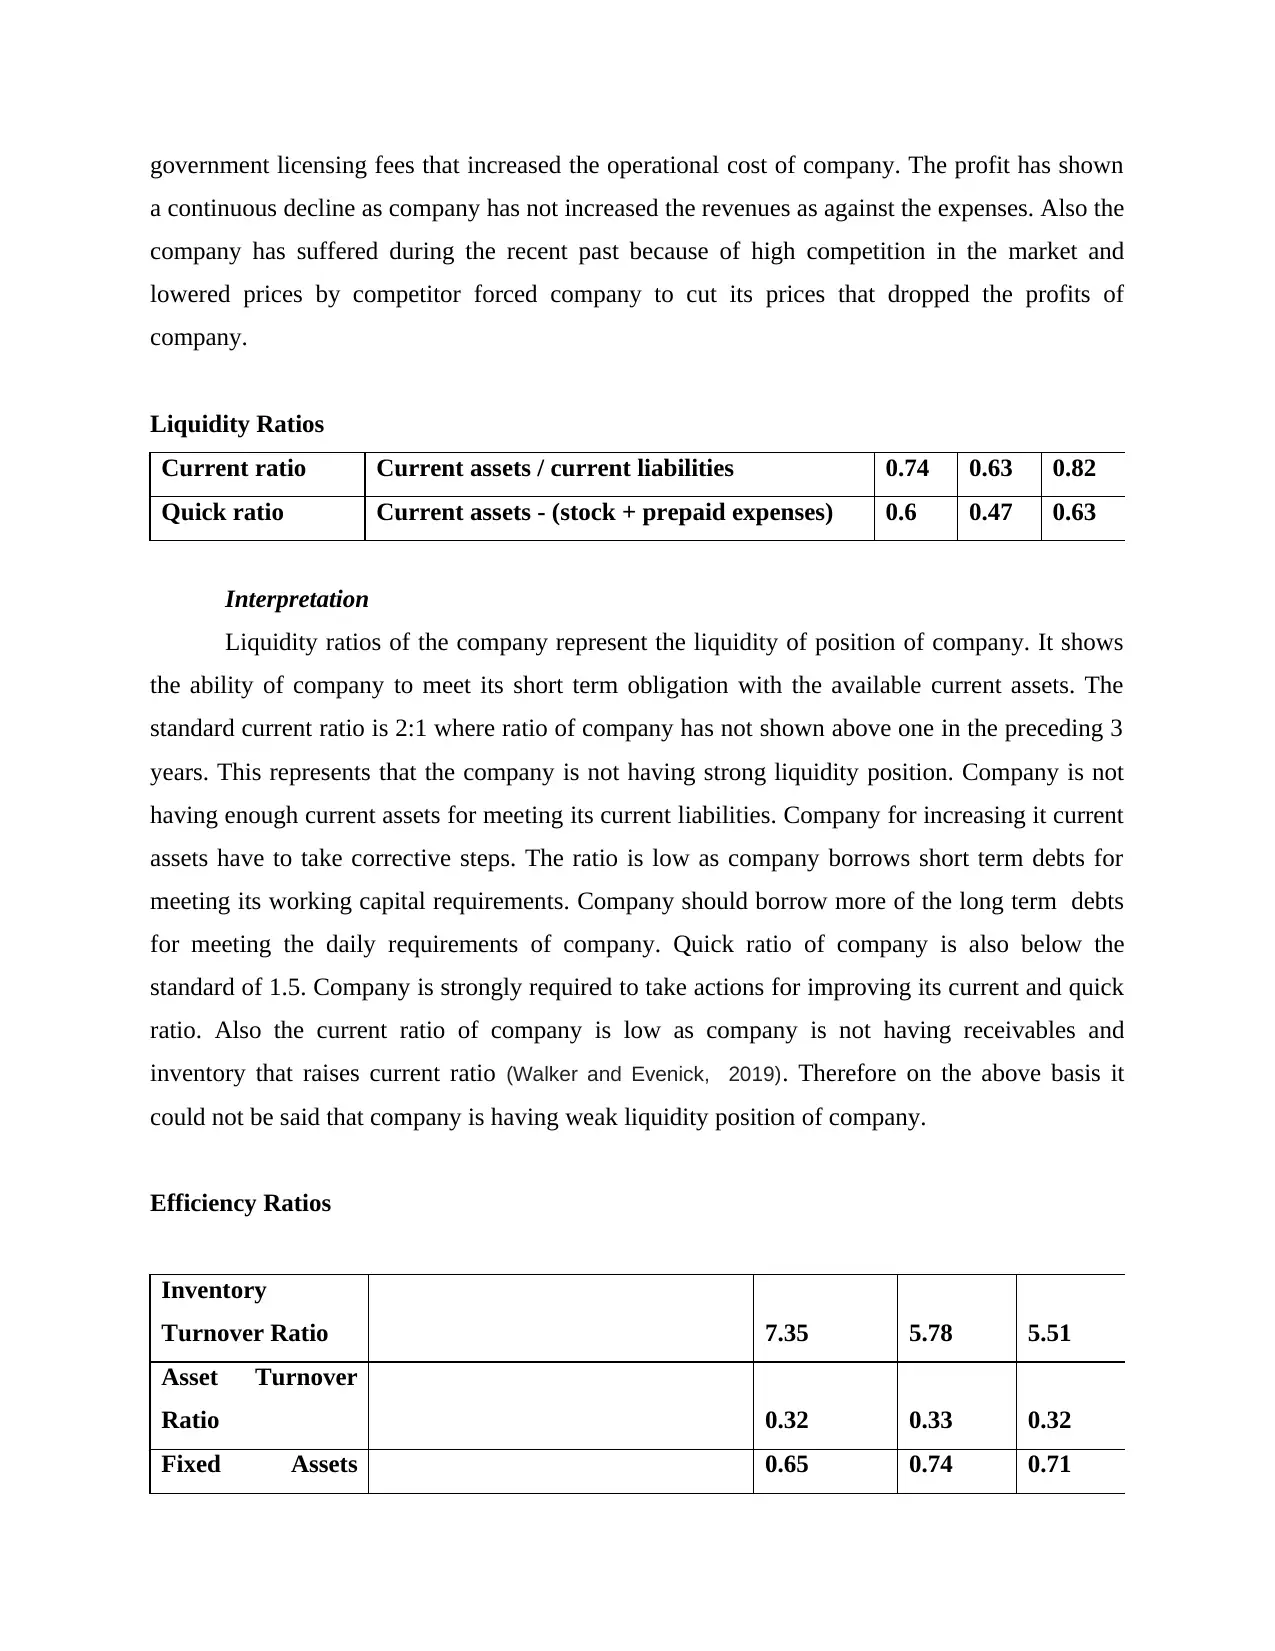
Liquidity Ratios
Current ratio Current assets / current liabilities 0.74 0.63 0.82
Quick ratio Current assets - (stock + prepaid expenses) 0.6 0.47 0.63
Interpretation
Liquidity ratios of the company represent the liquidity of position of company. It shows
the ability of company to meet its short term obligation with the available current assets. The
standard current ratio is 2:1 where ratio of company has not shown above one in the preceding 3
years. This represents that the company is not having strong liquidity position. Company is not
having enough current assets for meeting its current liabilities. Company for increasing it current
assets have to take corrective steps. The ratio is low as company borrows short term debts for
meeting its working capital requirements. Company should borrow more of the long term debts
for meeting the daily requirements of company. Quick ratio of company is also below the
standard of 1.5. Company is strongly required to take actions for improving its current and quick
ratio. Also the current ratio of company is low as company is not having receivables and
inventory that raises current ratio (Walker and Evenick, 2019). Therefore on the above basis it
could not be said that company is having weak liquidity position of company.
Efficiency Ratios
Inventory
Turnover Ratio 7.35 5.78 5.51
Asset Turnover
Ratio 0.32 0.33 0.32
Fixed Assets 0.65 0.74 0.71
a continuous decline as company has not increased the revenues as against the expenses. Also the
company has suffered during the recent past because of high competition in the market and
lowered prices by competitor forced company to cut its prices that dropped the profits of
company.
Liquidity Ratios
Current ratio Current assets / current liabilities 0.74 0.63 0.82
Quick ratio Current assets - (stock + prepaid expenses) 0.6 0.47 0.63
Interpretation
Liquidity ratios of the company represent the liquidity of position of company. It shows
the ability of company to meet its short term obligation with the available current assets. The
standard current ratio is 2:1 where ratio of company has not shown above one in the preceding 3
years. This represents that the company is not having strong liquidity position. Company is not
having enough current assets for meeting its current liabilities. Company for increasing it current
assets have to take corrective steps. The ratio is low as company borrows short term debts for
meeting its working capital requirements. Company should borrow more of the long term debts
for meeting the daily requirements of company. Quick ratio of company is also below the
standard of 1.5. Company is strongly required to take actions for improving its current and quick
ratio. Also the current ratio of company is low as company is not having receivables and
inventory that raises current ratio (Walker and Evenick, 2019). Therefore on the above basis it
could not be said that company is having weak liquidity position of company.
Efficiency Ratios
Inventory
Turnover Ratio 7.35 5.78 5.51
Asset Turnover
Ratio 0.32 0.33 0.32
Fixed Assets 0.65 0.74 0.71
Turnover Ratio
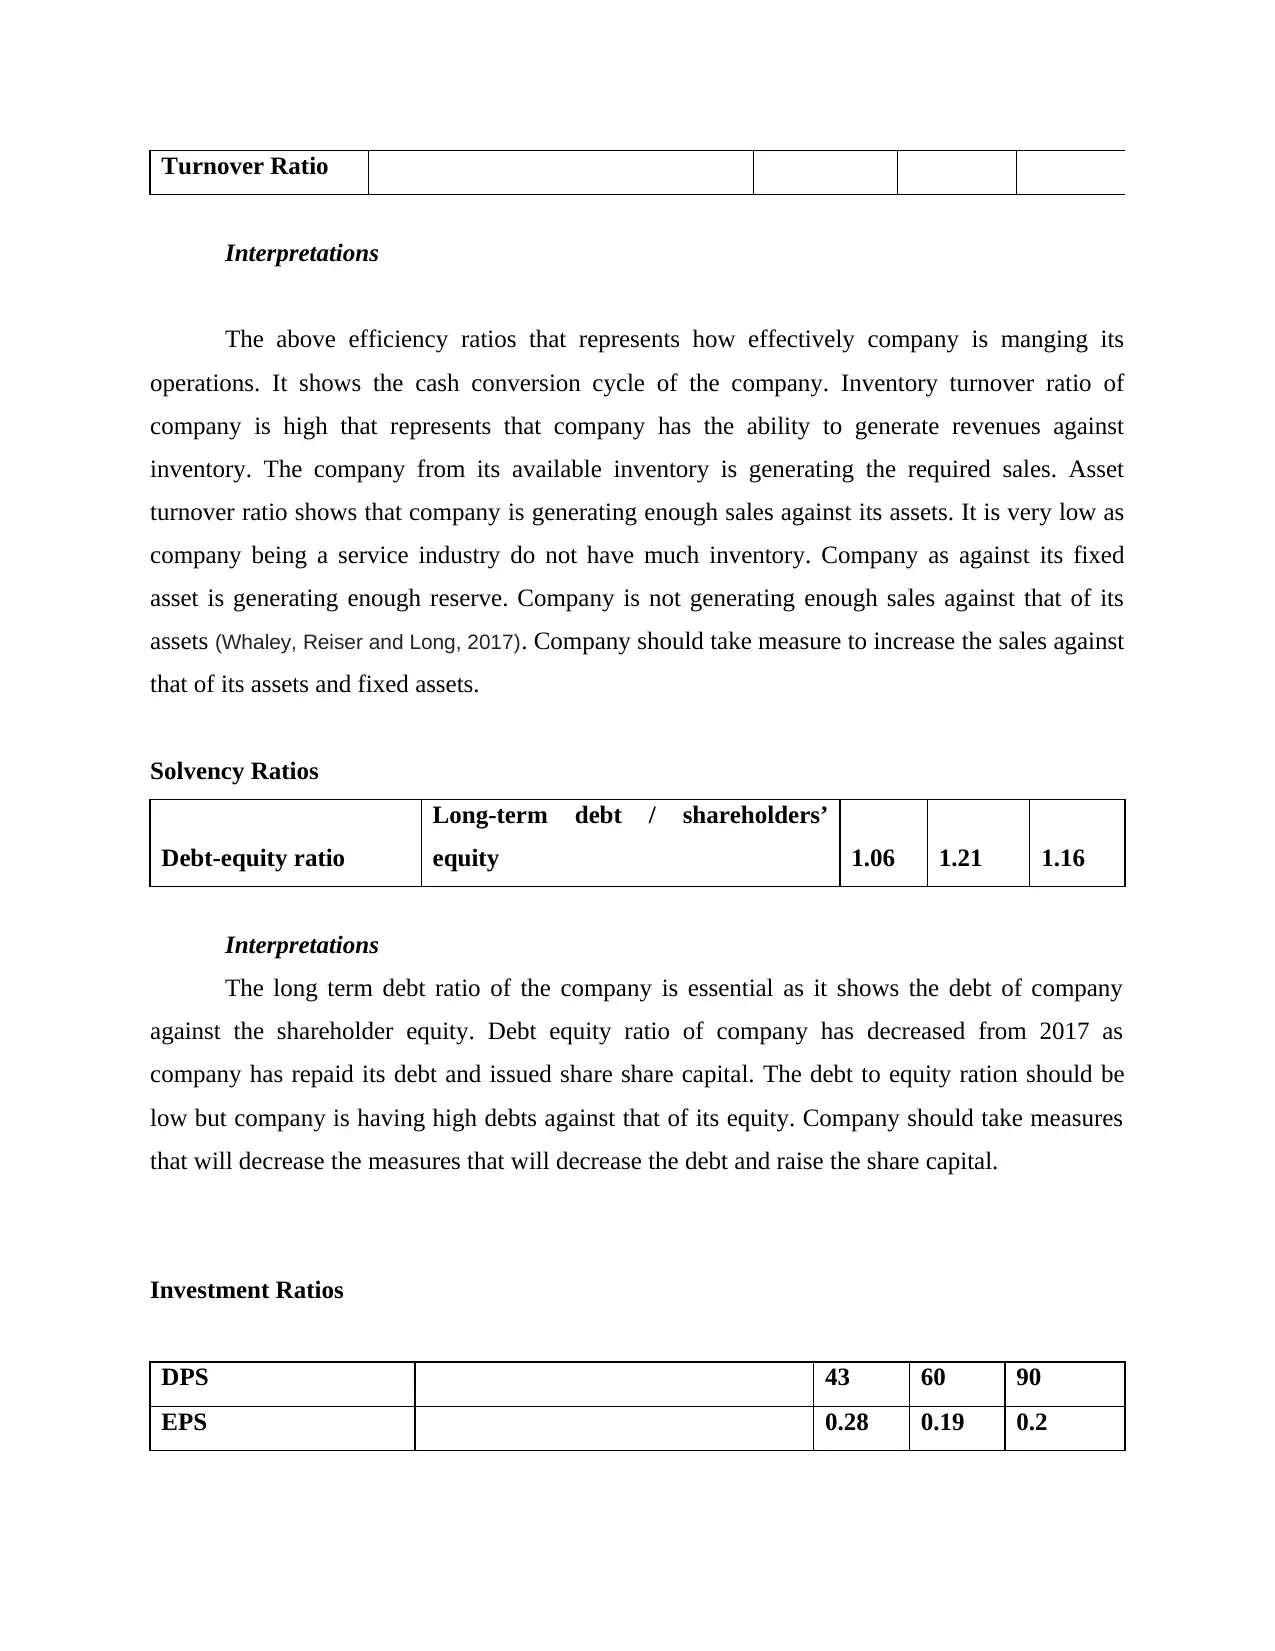
Interpretations
The above efficiency ratios that represents how effectively company is manging its
operations. It shows the cash conversion cycle of the company. Inventory turnover ratio of
company is high that represents that company has the ability to generate revenues against
inventory. The company from its available inventory is generating the required sales. Asset
turnover ratio shows that company is generating enough sales against its assets. It is very low as
company being a service industry do not have much inventory. Company as against its fixed
asset is generating enough reserve. Company is not generating enough sales against that of its
assets (Whaley, Reiser and Long, 2017). Company should take measure to increase the sales against
that of its assets and fixed assets.
Solvency Ratios
Debt-equity ratio
Long-term debt / shareholders’
equity 1.06 1.21 1.16
Interpretations
The long term debt ratio of the company is essential as it shows the debt of company
against the shareholder equity. Debt equity ratio of company has decreased from 2017 as
company has repaid its debt and issued share share capital. The debt to equity ration should be
low but company is having high debts against that of its equity. Company should take measures
that will decrease the measures that will decrease the debt and raise the share capital.
Investment Ratios
DPS 43 60 90
EPS 0.28 0.19 0.2
Interpretations
The above efficiency ratios that represents how effectively company is manging its
operations. It shows the cash conversion cycle of the company. Inventory turnover ratio of
company is high that represents that company has the ability to generate revenues against
inventory. The company from its available inventory is generating the required sales. Asset
turnover ratio shows that company is generating enough sales against its assets. It is very low as
company being a service industry do not have much inventory. Company as against its fixed
asset is generating enough reserve. Company is not generating enough sales against that of its
assets (Whaley, Reiser and Long, 2017). Company should take measure to increase the sales against
that of its assets and fixed assets.
Solvency Ratios
Debt-equity ratio
Long-term debt / shareholders’
equity 1.06 1.21 1.16
Interpretations
The long term debt ratio of the company is essential as it shows the debt of company
against the shareholder equity. Debt equity ratio of company has decreased from 2017 as
company has repaid its debt and issued share share capital. The debt to equity ration should be
low but company is having high debts against that of its equity. Company should take measures
that will decrease the measures that will decrease the debt and raise the share capital.
Investment Ratios
DPS 43 60 90
EPS 0.28 0.19 0.2
⊘ This is a preview!⊘
Do you want full access?
Subscribe today to unlock all pages.
Trusted by 1+ million students worldwide
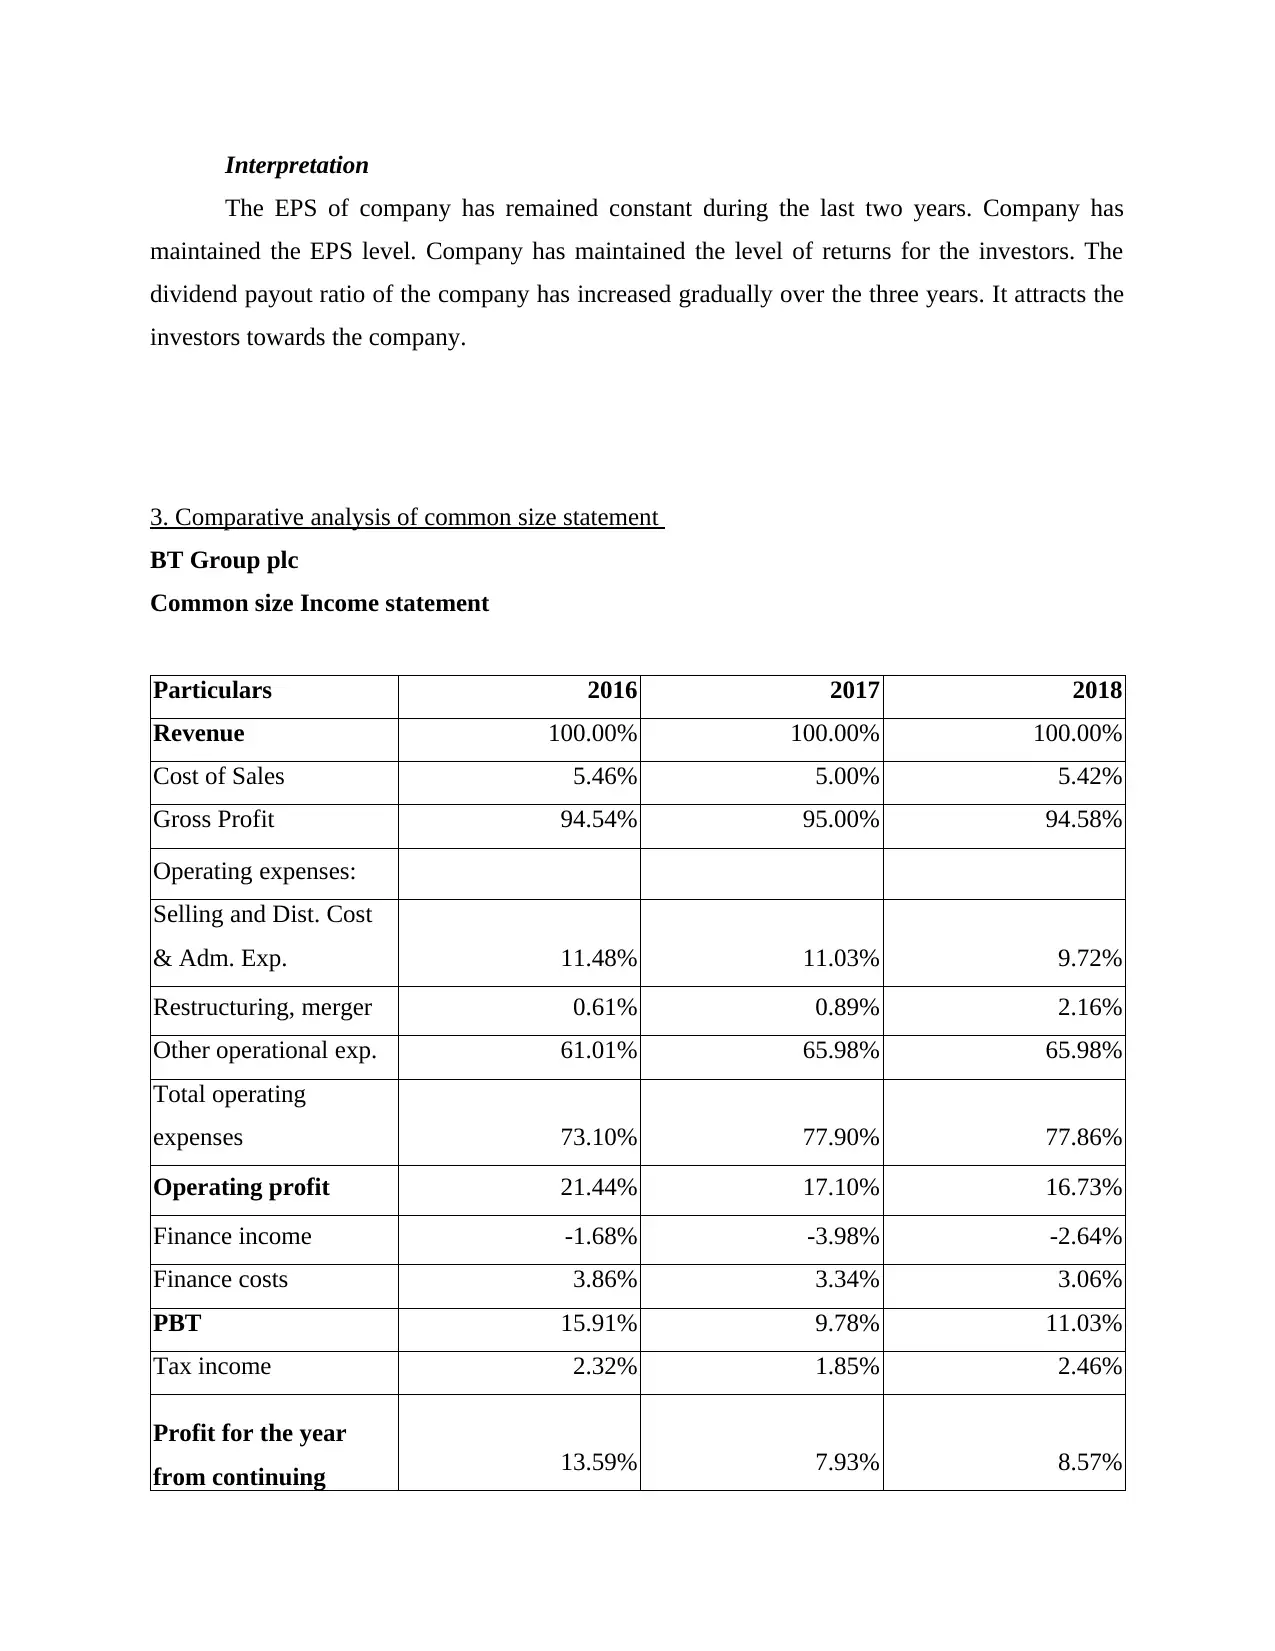
Interpretation
The EPS of company has remained constant during the last two years. Company has
maintained the EPS level. Company has maintained the level of returns for the investors. The
dividend payout ratio of the company has increased gradually over the three years. It attracts the
investors towards the company.
3. Comparative analysis of common size statement
BT Group plc
Common size Income statement
Particulars 2016 2017 2018
Revenue 100.00% 100.00% 100.00%
Cost of Sales 5.46% 5.00% 5.42%
Gross Profit 94.54% 95.00% 94.58%
Operating expenses:
Selling and Dist. Cost
& Adm. Exp. 11.48% 11.03% 9.72%
Restructuring, merger 0.61% 0.89% 2.16%
Other operational exp. 61.01% 65.98% 65.98%
Total operating
expenses 73.10% 77.90% 77.86%
Operating profit 21.44% 17.10% 16.73%
Finance income -1.68% -3.98% -2.64%
Finance costs 3.86% 3.34% 3.06%
PBT 15.91% 9.78% 11.03%
Tax income 2.32% 1.85% 2.46%
Profit for the year
from continuing 13.59% 7.93% 8.57%
Paraphrase This Document
Need a fresh take? Get an instant paraphrase of this document with our AI Paraphraser
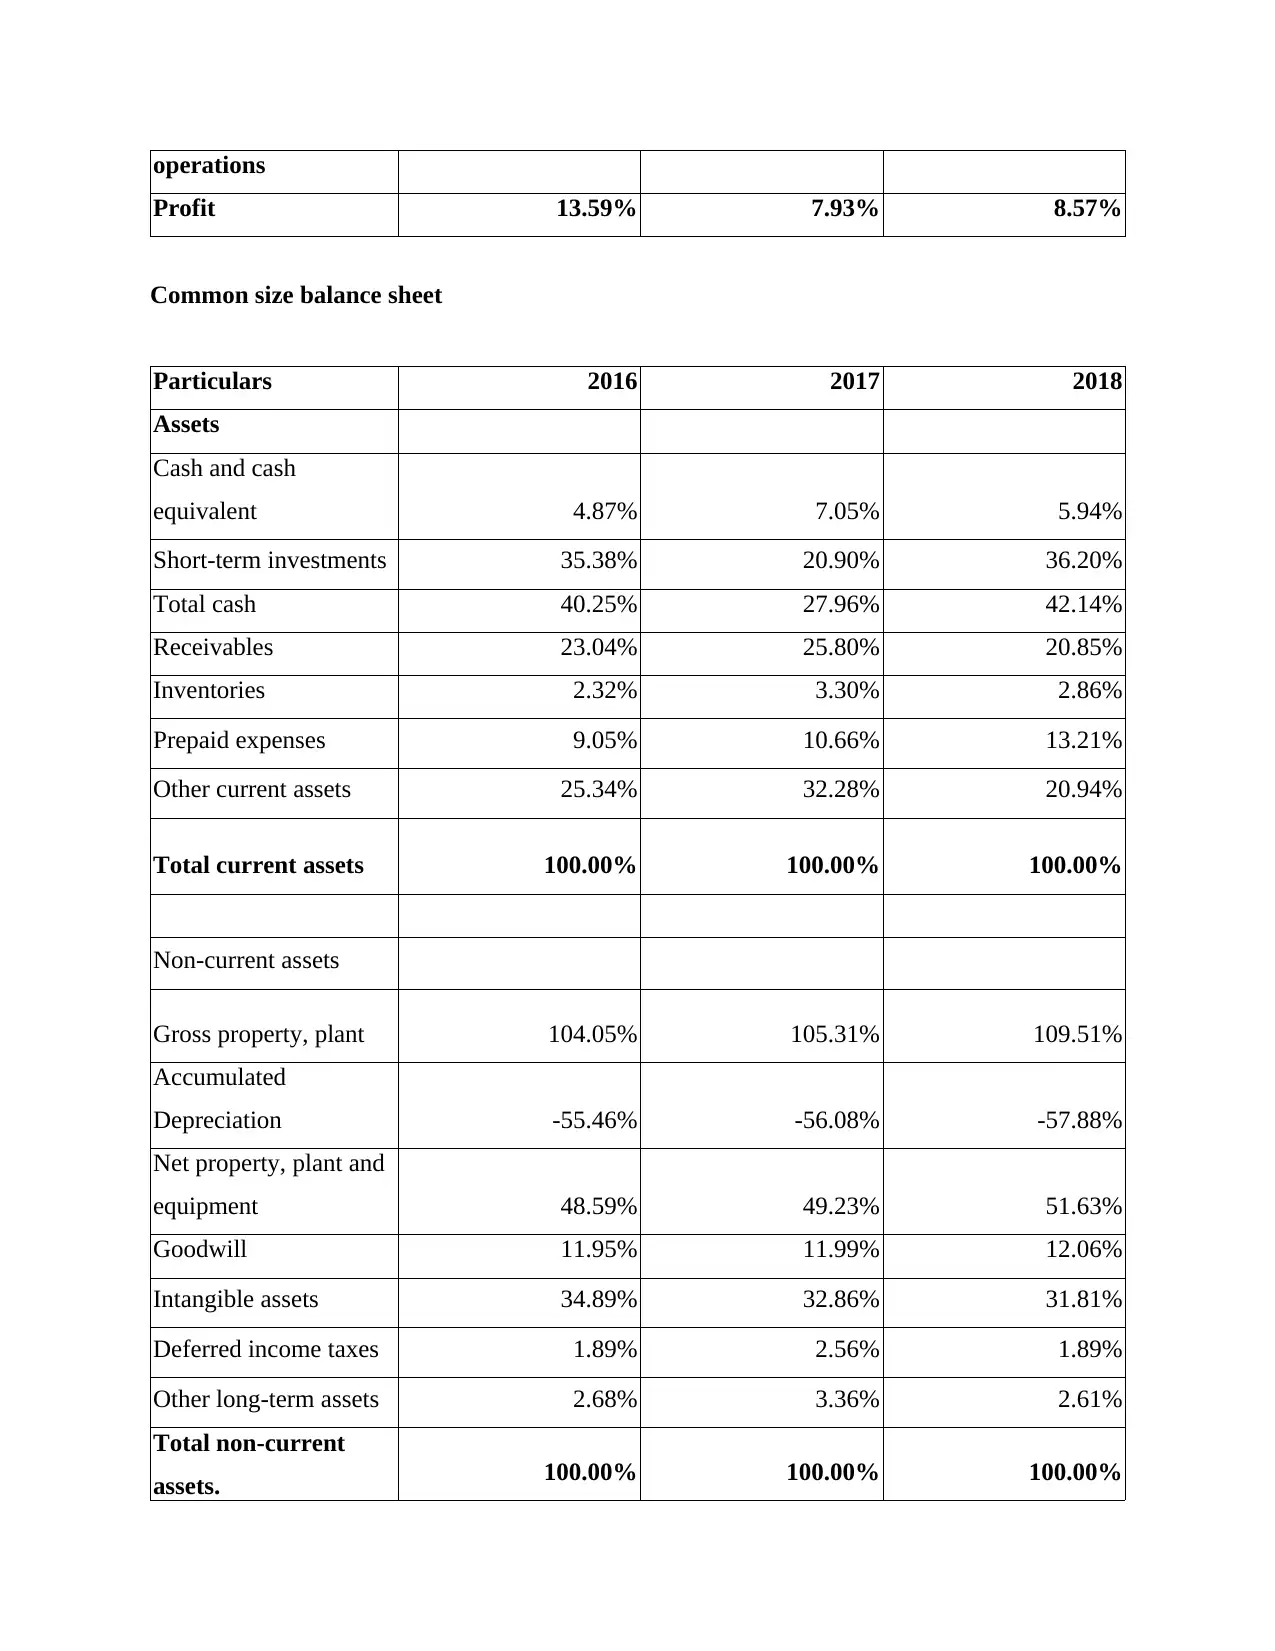
operations
Profit 13.59% 7.93% 8.57%
Common size balance sheet
Particulars 2016 2017 2018
Assets
Cash and cash
equivalent 4.87% 7.05% 5.94%
Short-term investments 35.38% 20.90% 36.20%
Total cash 40.25% 27.96% 42.14%
Receivables 23.04% 25.80% 20.85%
Inventories 2.32% 3.30% 2.86%
Prepaid expenses 9.05% 10.66% 13.21%
Other current assets 25.34% 32.28% 20.94%
Total current assets 100.00% 100.00% 100.00%
Non-current assets
Gross property, plant 104.05% 105.31% 109.51%
Accumulated
Depreciation -55.46% -56.08% -57.88%
Net property, plant and
equipment 48.59% 49.23% 51.63%
Goodwill 11.95% 11.99% 12.06%
Intangible assets 34.89% 32.86% 31.81%
Deferred income taxes 1.89% 2.56% 1.89%
Other long-term assets 2.68% 3.36% 2.61%
Total non-current
assets. 100.00% 100.00% 100.00%
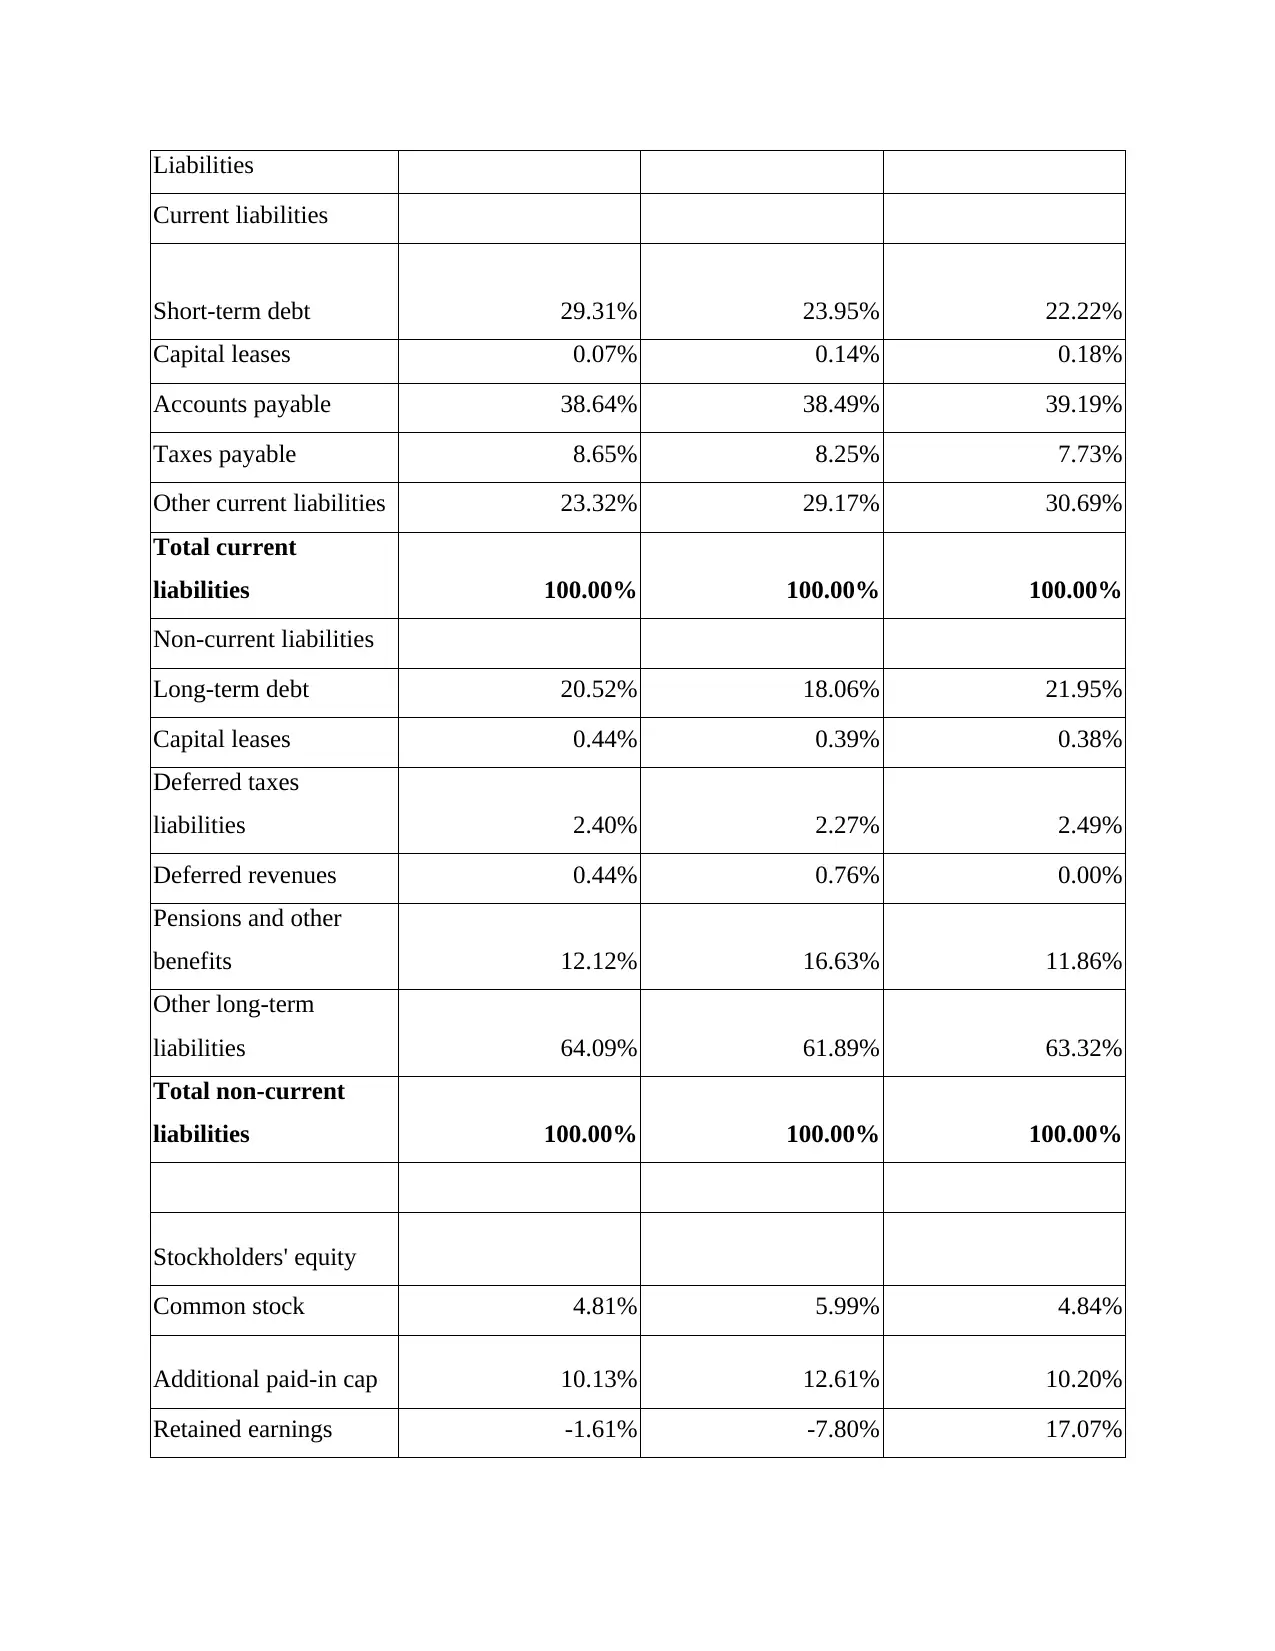
Liabilities
Current liabilities
Short-term debt 29.31% 23.95% 22.22%
Capital leases 0.07% 0.14% 0.18%
Accounts payable 38.64% 38.49% 39.19%
Taxes payable 8.65% 8.25% 7.73%
Other current liabilities 23.32% 29.17% 30.69%
Total current
liabilities 100.00% 100.00% 100.00%
Non-current liabilities
Long-term debt 20.52% 18.06% 21.95%
Capital leases 0.44% 0.39% 0.38%
Deferred taxes
liabilities 2.40% 2.27% 2.49%
Deferred revenues 0.44% 0.76% 0.00%
Pensions and other
benefits 12.12% 16.63% 11.86%
Other long-term
liabilities 64.09% 61.89% 63.32%
Total non-current
liabilities 100.00% 100.00% 100.00%
Stockholders' equity
Common stock 4.81% 5.99% 4.84%
Additional paid-in cap 10.13% 12.61% 10.20%
Retained earnings -1.61% -7.80% 17.07%
⊘ This is a preview!⊘
Do you want full access?
Subscribe today to unlock all pages.
Trusted by 1+ million students worldwide
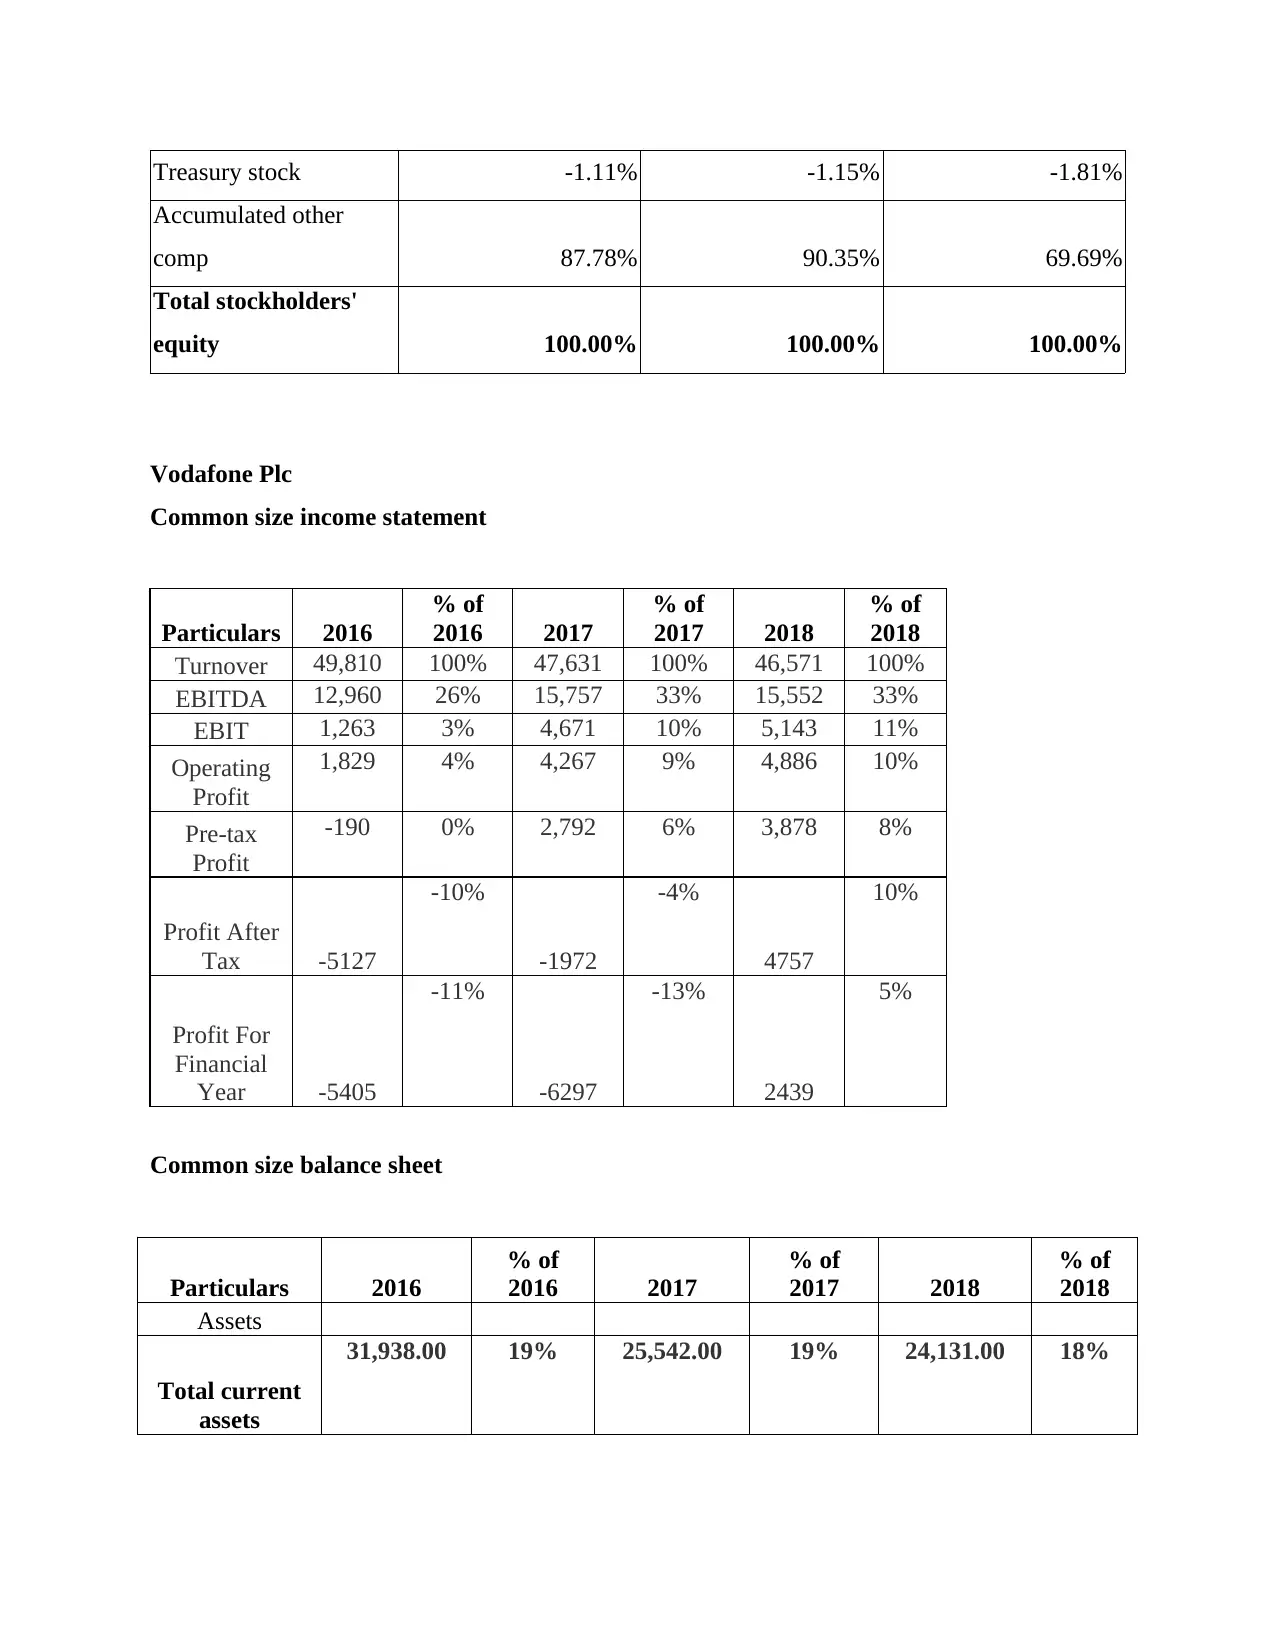
Treasury stock -1.11% -1.15% -1.81%
Accumulated other
comp 87.78% 90.35% 69.69%
Total stockholders'
equity 100.00% 100.00% 100.00%
Vodafone Plc
Common size income statement
Particulars 2016
% of
2016 2017
% of
2017 2018
% of
2018
Turnover 49,810 100% 47,631 100% 46,571 100%
EBITDA 12,960 26% 15,757 33% 15,552 33%
EBIT 1,263 3% 4,671 10% 5,143 11%
Operating
Profit
1,829 4% 4,267 9% 4,886 10%
Pre-tax
Profit
-190 0% 2,792 6% 3,878 8%
Profit After
Tax -5127
-10%
-1972
-4%
4757
10%
Profit For
Financial
Year -5405
-11%
-6297
-13%
2439
5%
Common size balance sheet
Particulars 2016
% of
2016 2017
% of
2017 2018
% of
2018
Assets
Total current
assets
31,938.00 19% 25,542.00 19% 24,131.00 18%
Paraphrase This Document
Need a fresh take? Get an instant paraphrase of this document with our AI Paraphraser
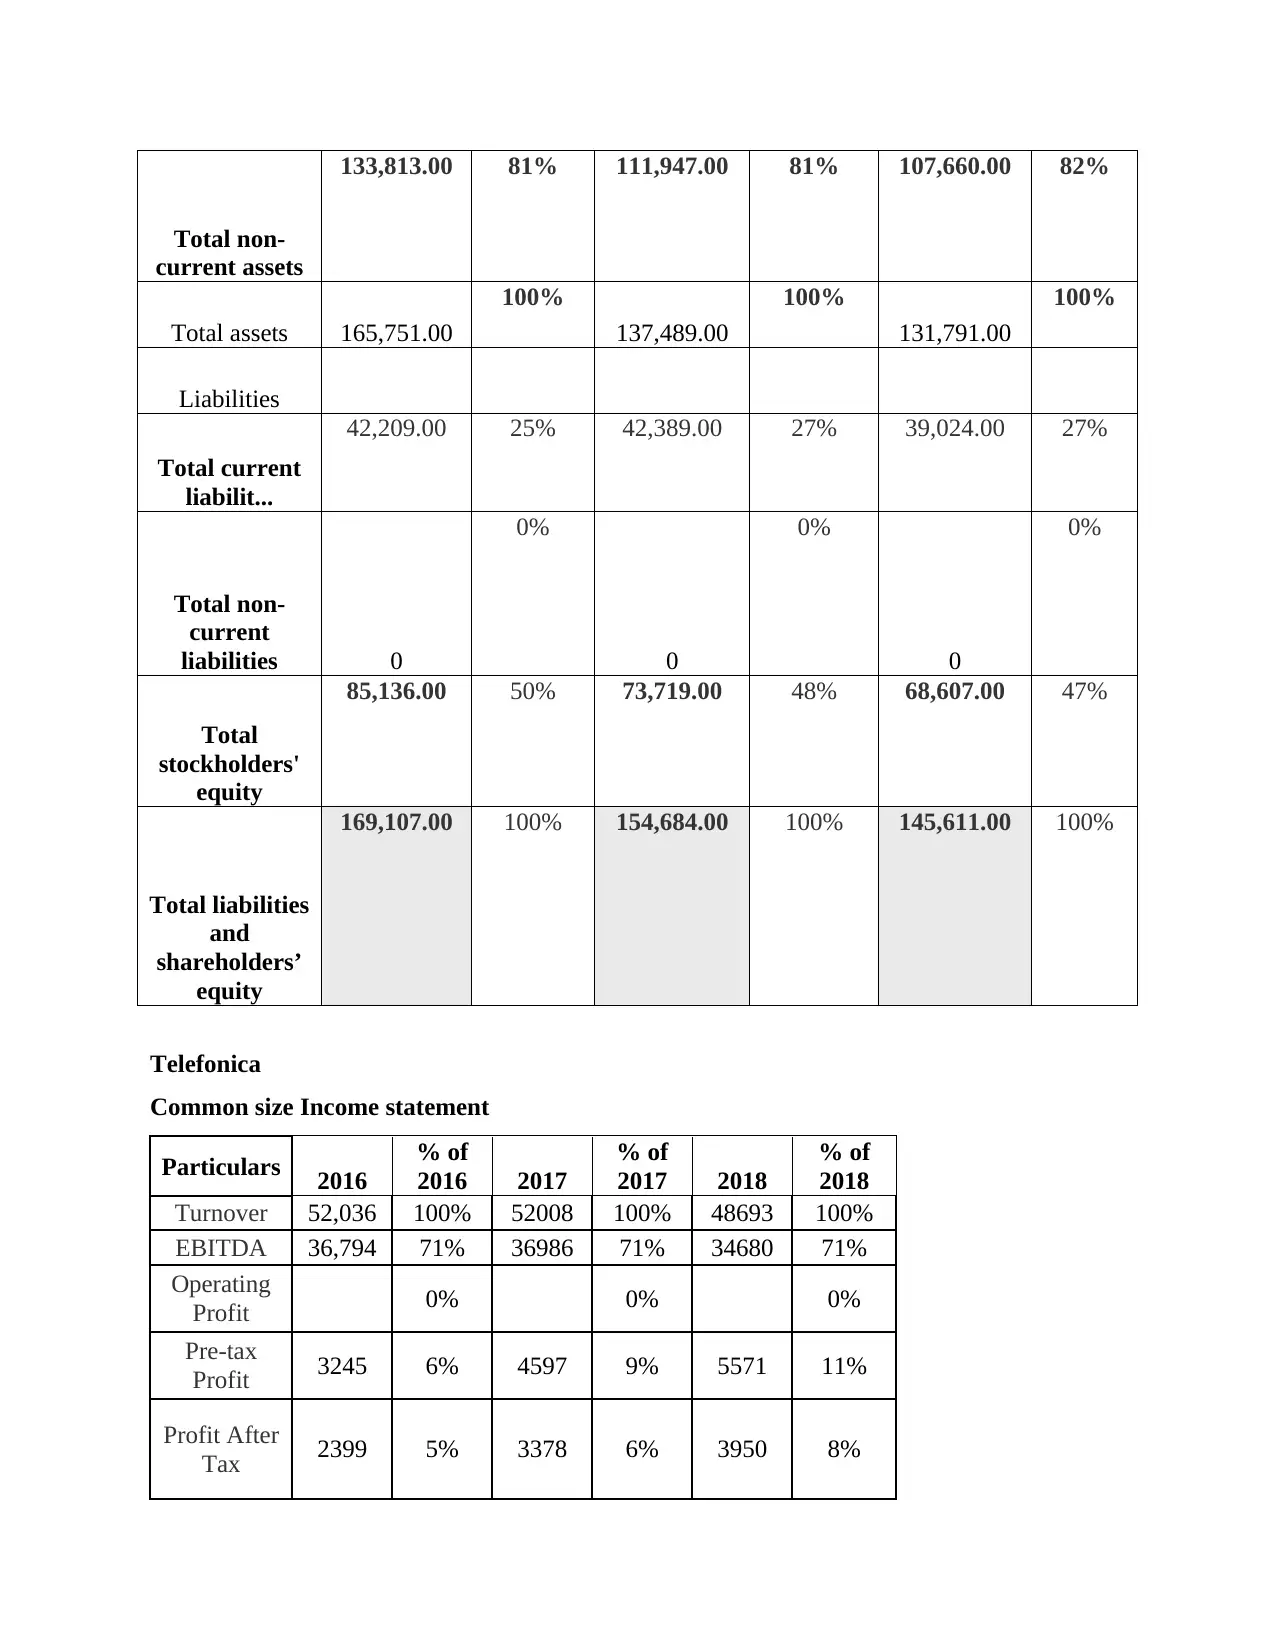
Total non-
current assets
133,813.00 81% 111,947.00 81% 107,660.00 82%
Total assets 165,751.00
100%
137,489.00
100%
131,791.00
100%
Liabilities
Total current
liabilit...
42,209.00 25% 42,389.00 27% 39,024.00 27%
Total non-
current
liabilities 0
0%
0
0%
0
0%
Total
stockholders'
equity
85,136.00 50% 73,719.00 48% 68,607.00 47%
Total liabilities
and
shareholders’
equity
169,107.00 100% 154,684.00 100% 145,611.00 100%
Telefonica
Common size Income statement
Particulars 2016
% of
2016 2017
% of
2017 2018
% of
2018
Turnover 52,036 100% 52008 100% 48693 100%
EBITDA 36,794 71% 36986 71% 34680 71%
Operating
Profit 0% 0% 0%
Pre-tax
Profit 3245 6% 4597 9% 5571 11%
Profit After
Tax 2399 5% 3378 6% 3950 8%
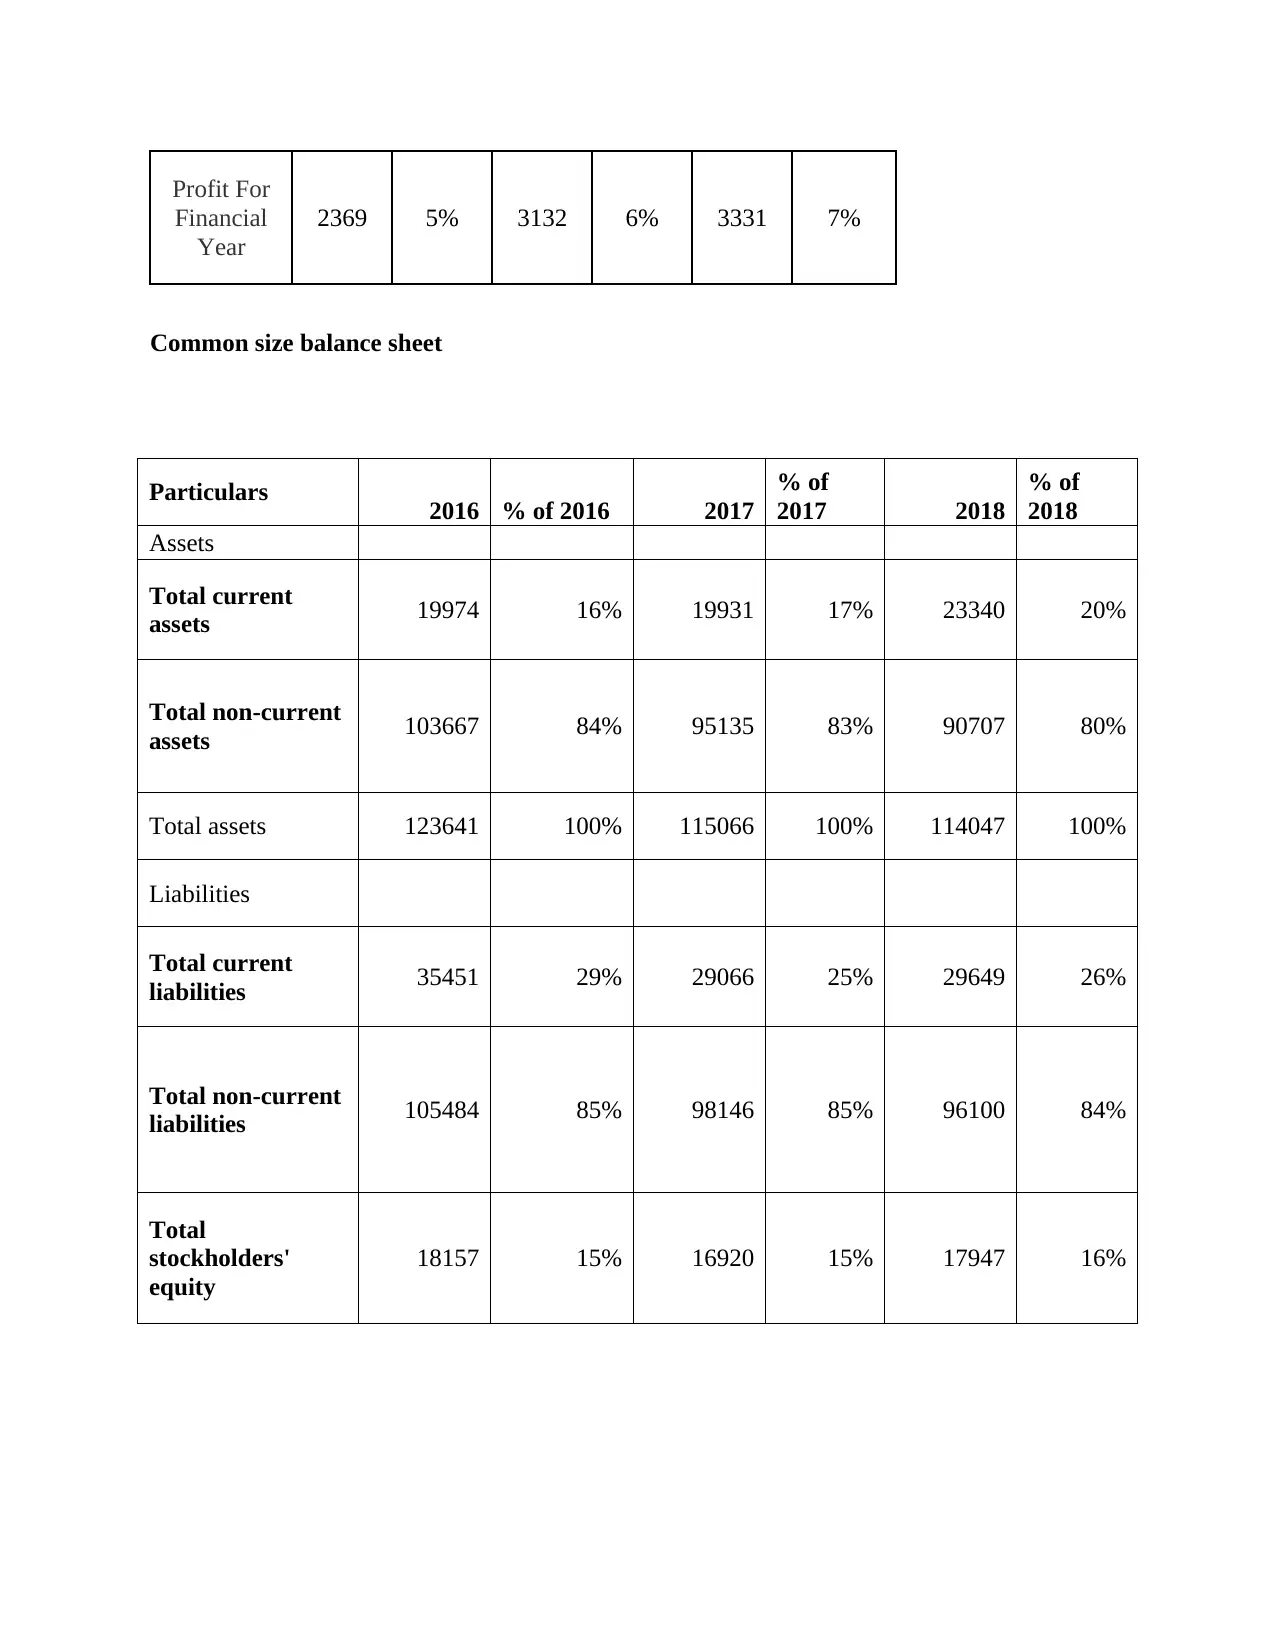
Profit For
Financial
Year
2369 5% 3132 6% 3331 7%
Common size balance sheet
Particulars 2016 % of 2016 2017
% of
2017 2018
% of
2018
Assets
Total current
assets 19974 16% 19931 17% 23340 20%
Total non-current
assets 103667 84% 95135 83% 90707 80%
Total assets 123641 100% 115066 100% 114047 100%
Liabilities
Total current
liabilities 35451 29% 29066 25% 29649 26%
Total non-current
liabilities 105484 85% 98146 85% 96100 84%
Total
stockholders'
equity
18157 15% 16920 15% 17947 16%
⊘ This is a preview!⊘
Do you want full access?
Subscribe today to unlock all pages.
Trusted by 1+ million students worldwide
1 out of 16
Related Documents


Your All-in-One AI-Powered Toolkit for Academic Success.
+13062052269
info@desklib.com
Available 24*7 on WhatsApp / Email
![[object Object]](/_next/static/media/star-bottom.7253800d.svg)
Unlock your academic potential
Copyright © 2020–2026 A2Z Services. All Rights Reserved. Developed and managed by ZUCOL.