Comparative Financial Statement Analysis: BT Group and Vodafone (2017)

Verified

Added on  2020/07/23

|11
|1563
|104
Report
AI Summary
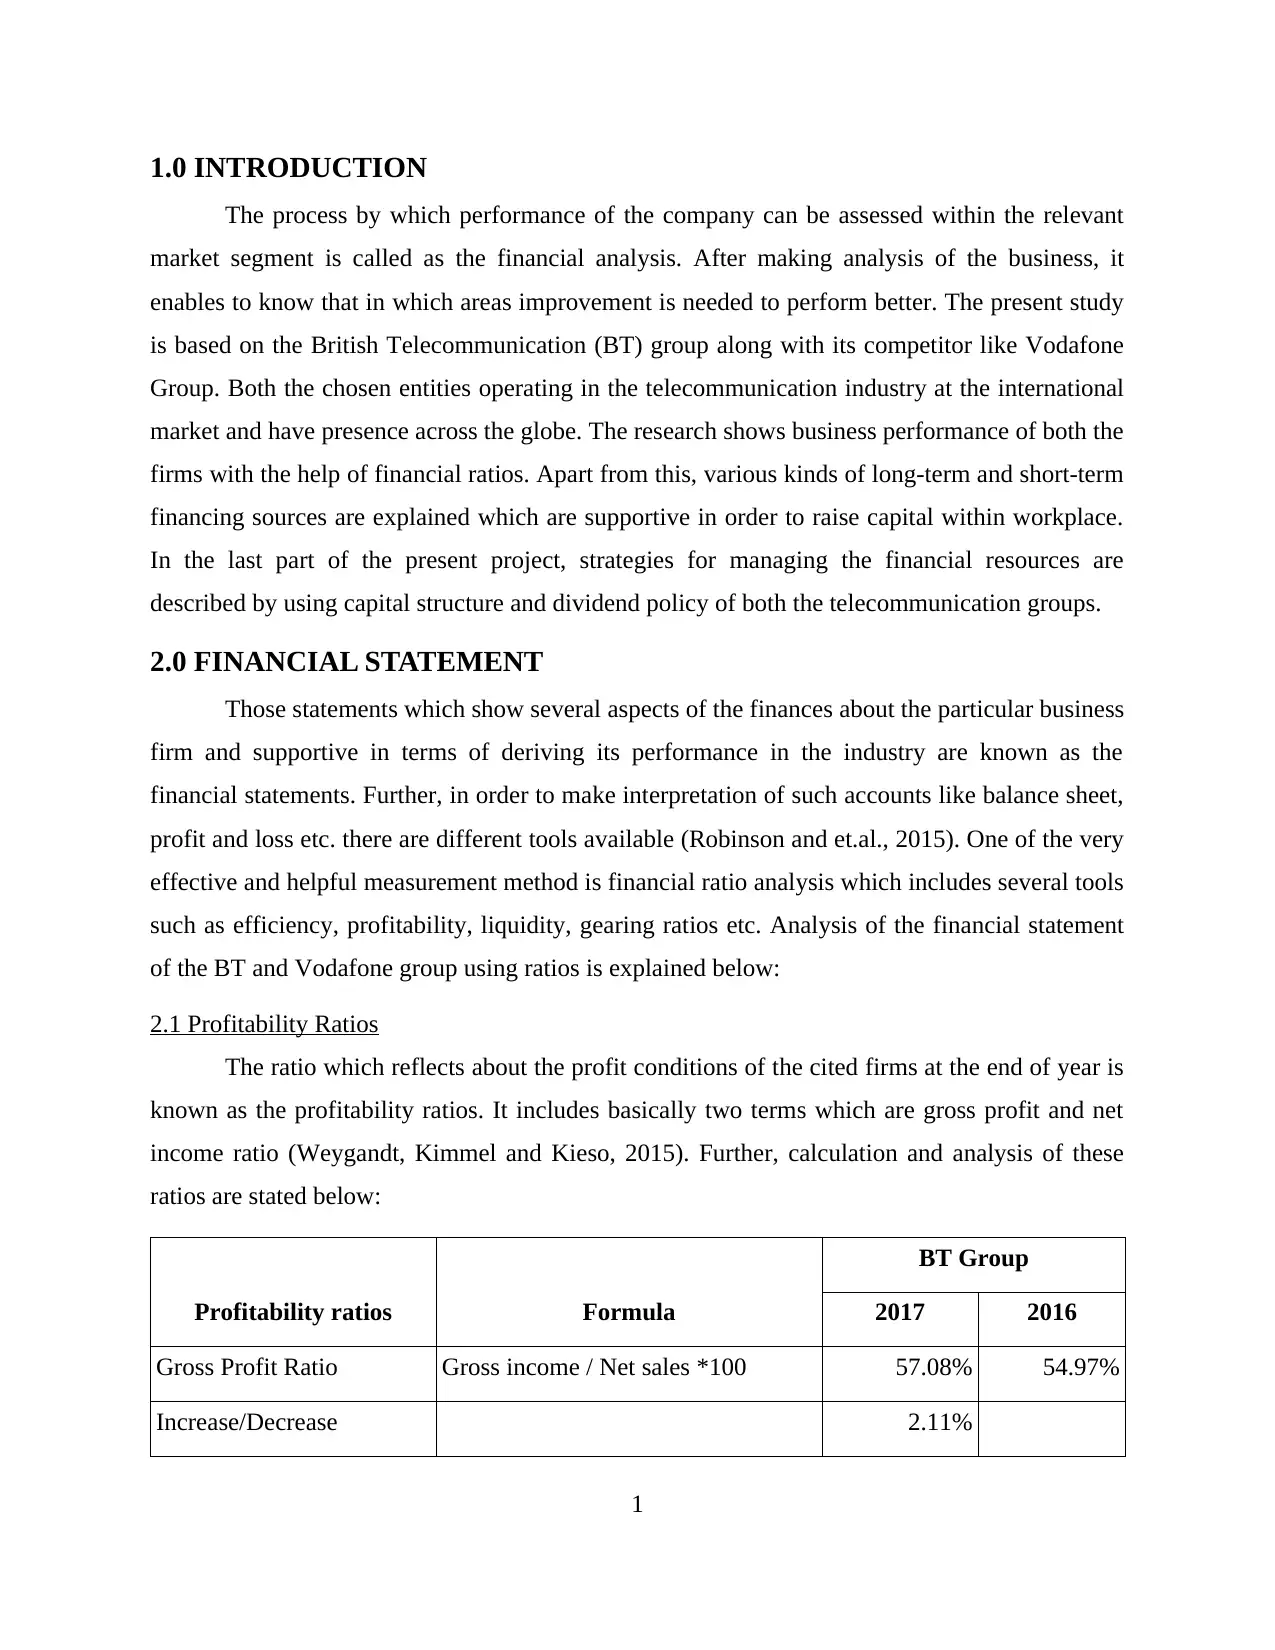
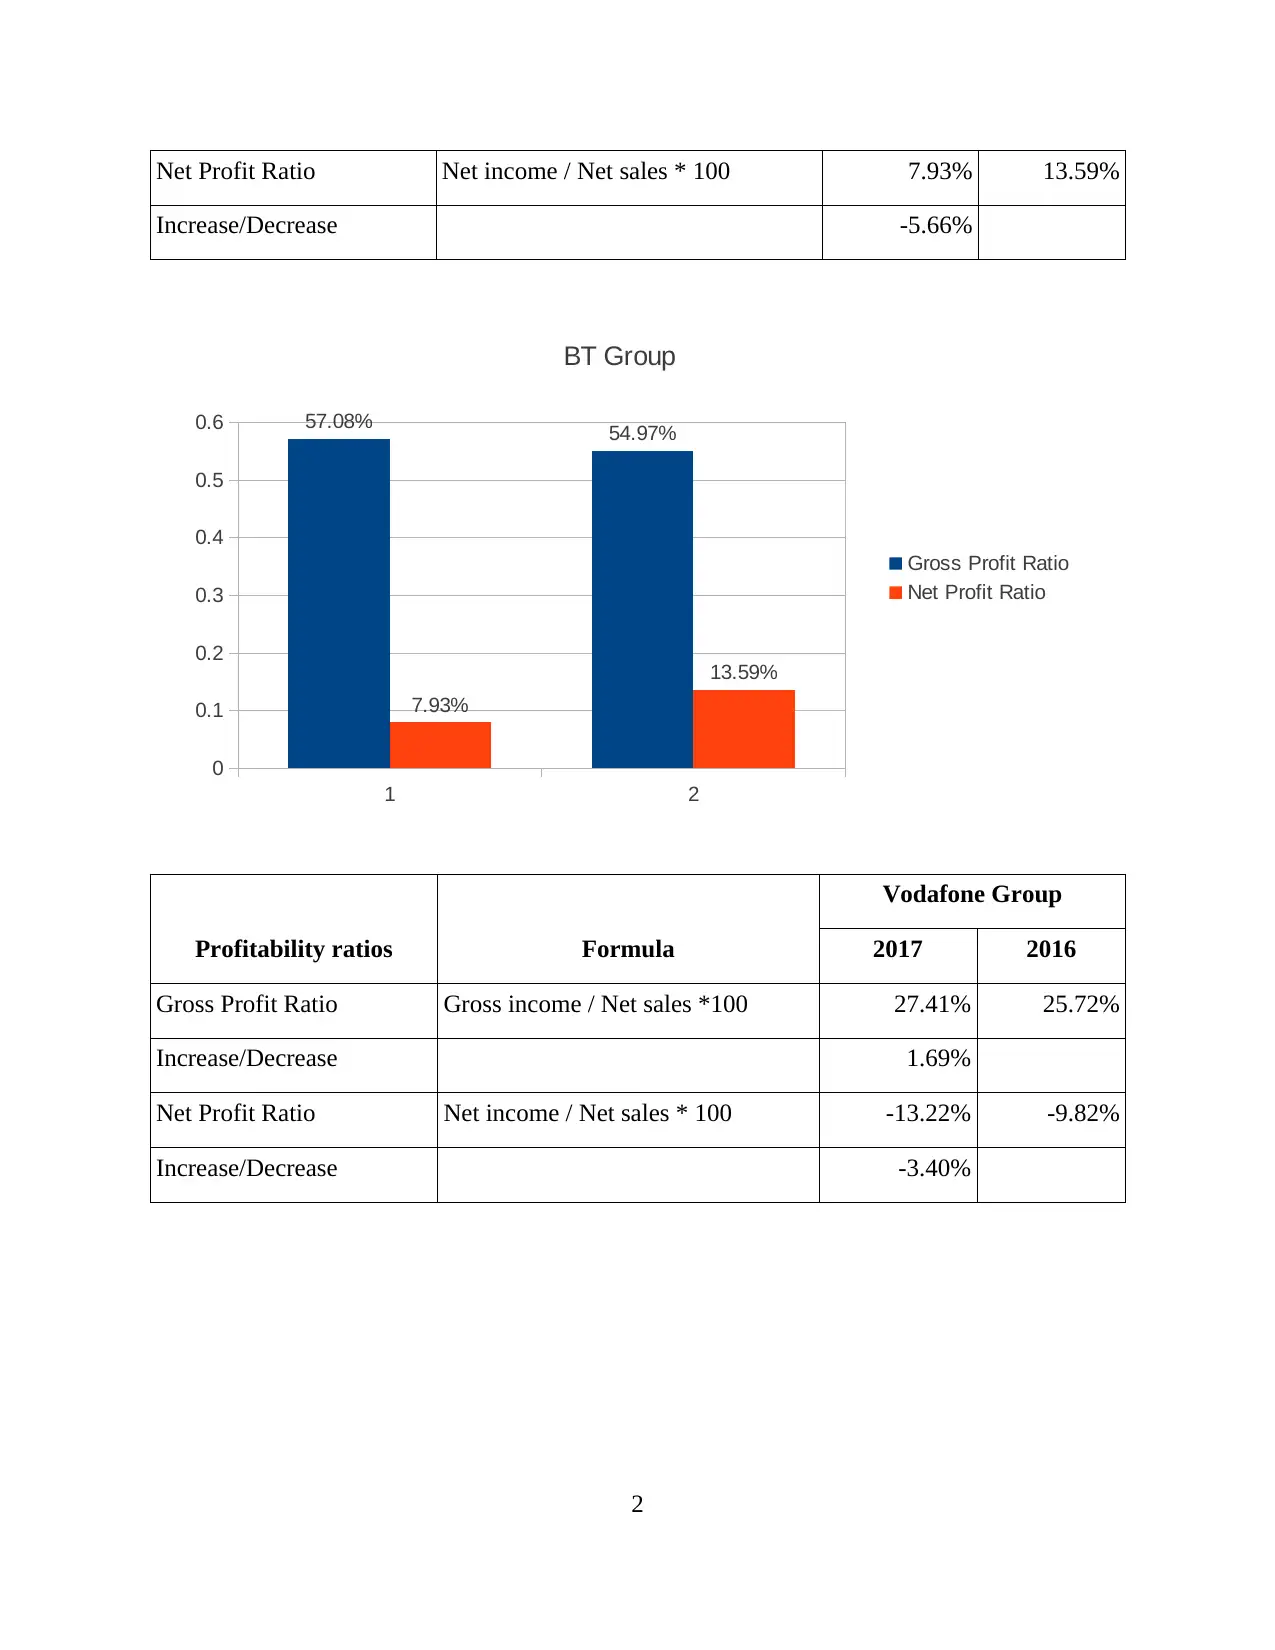
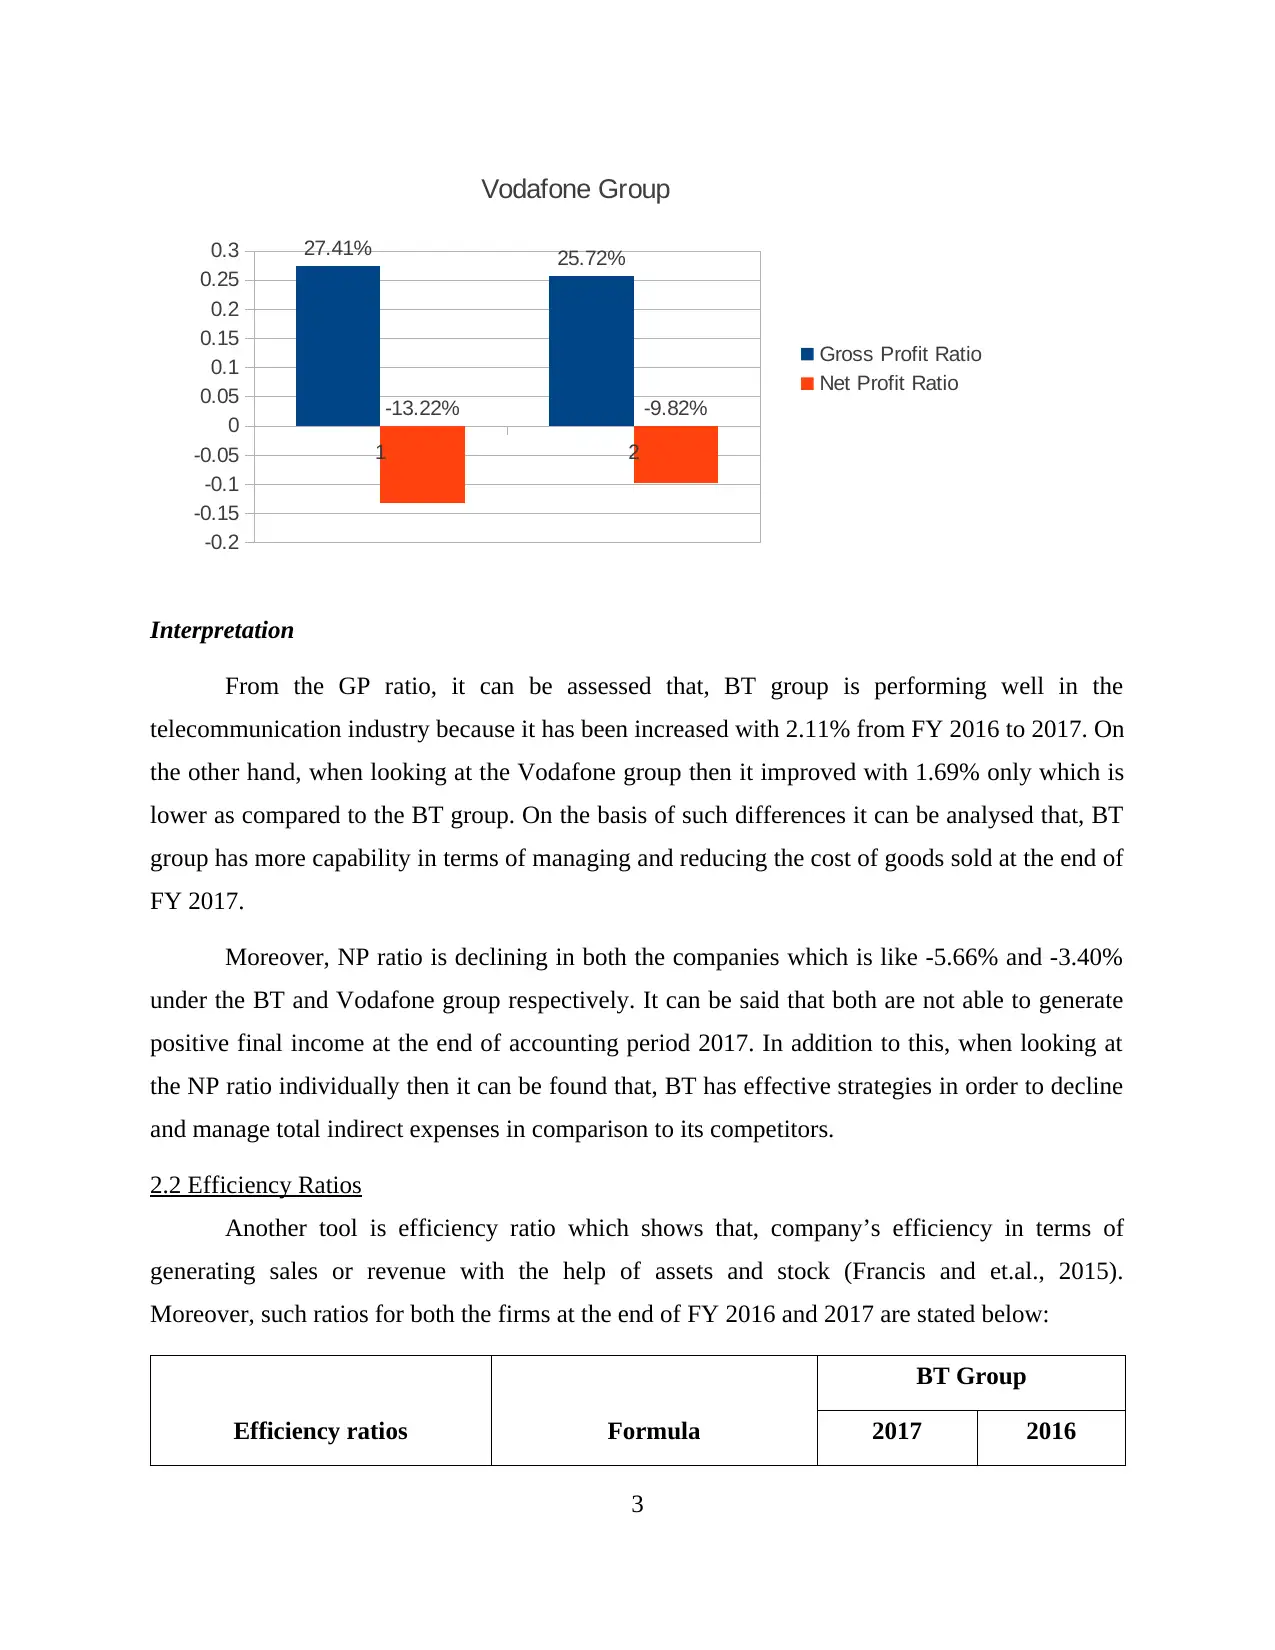
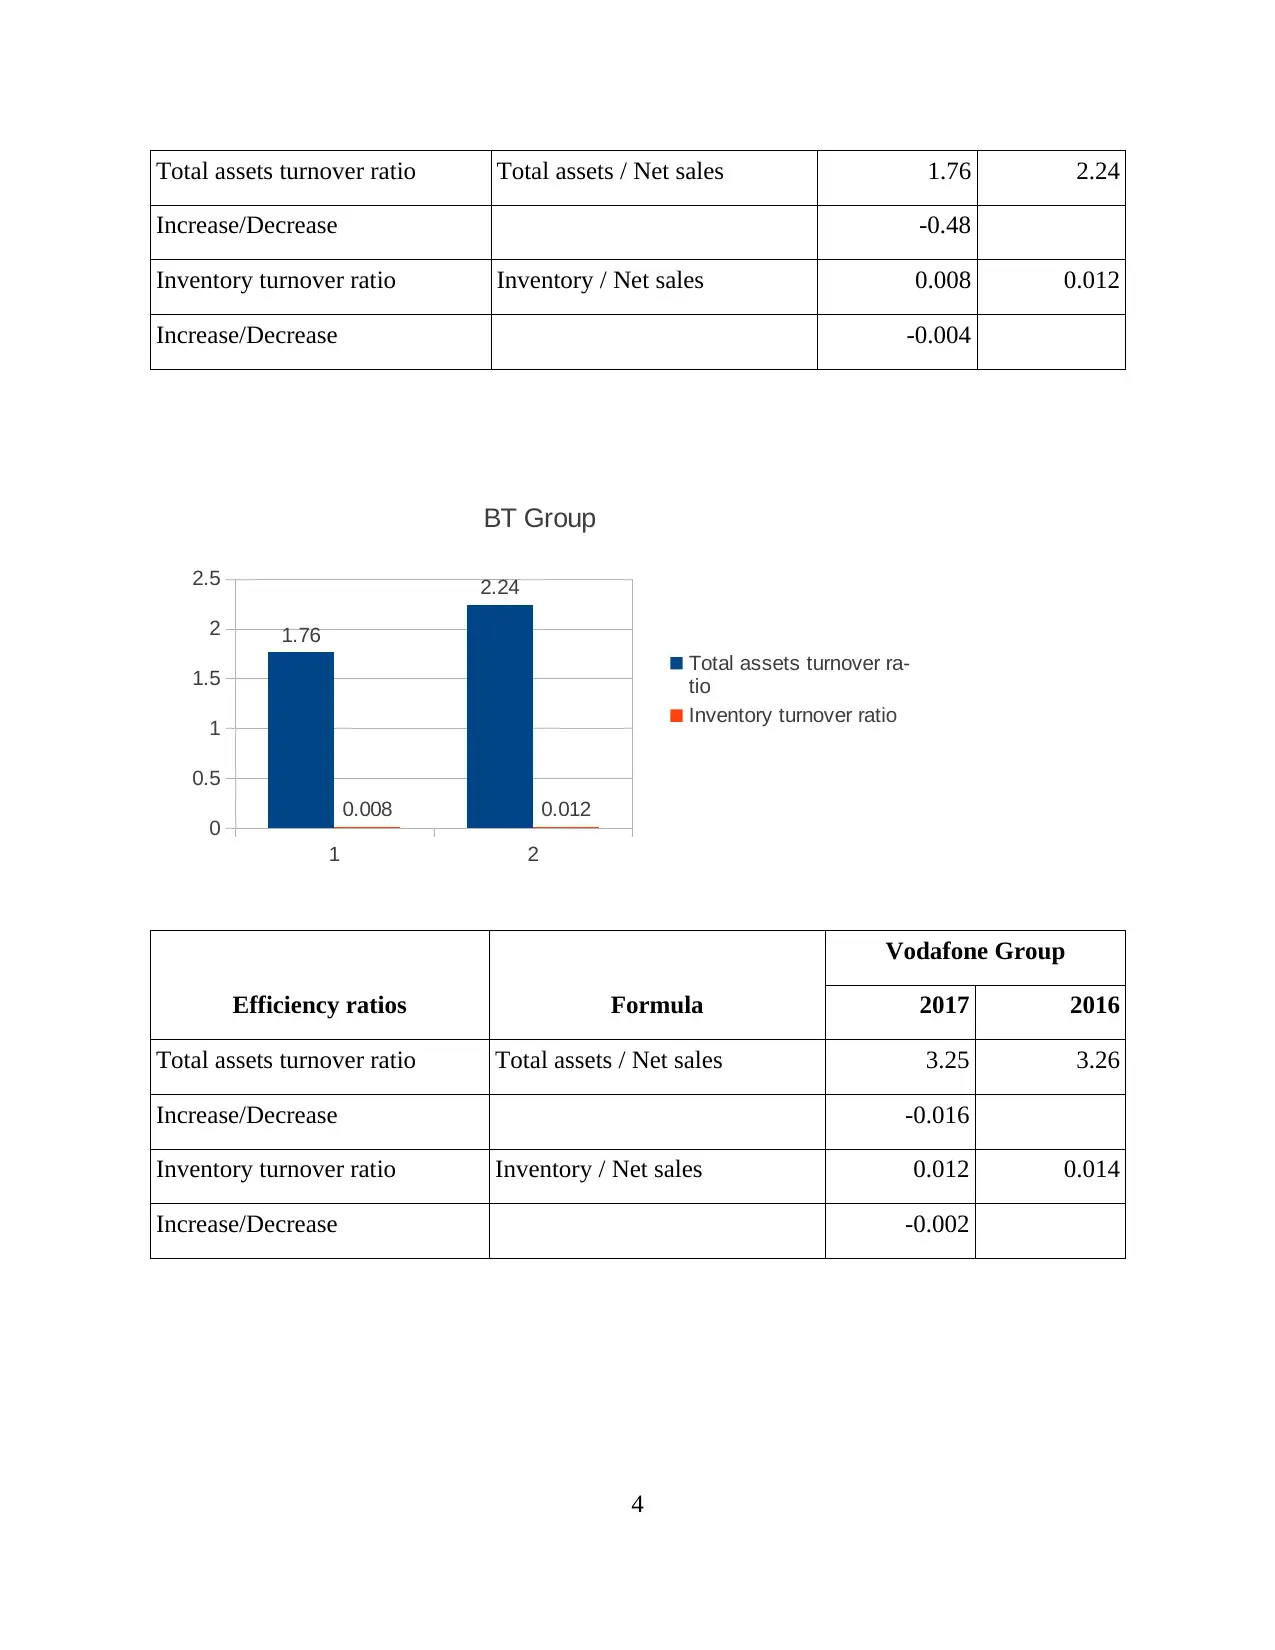
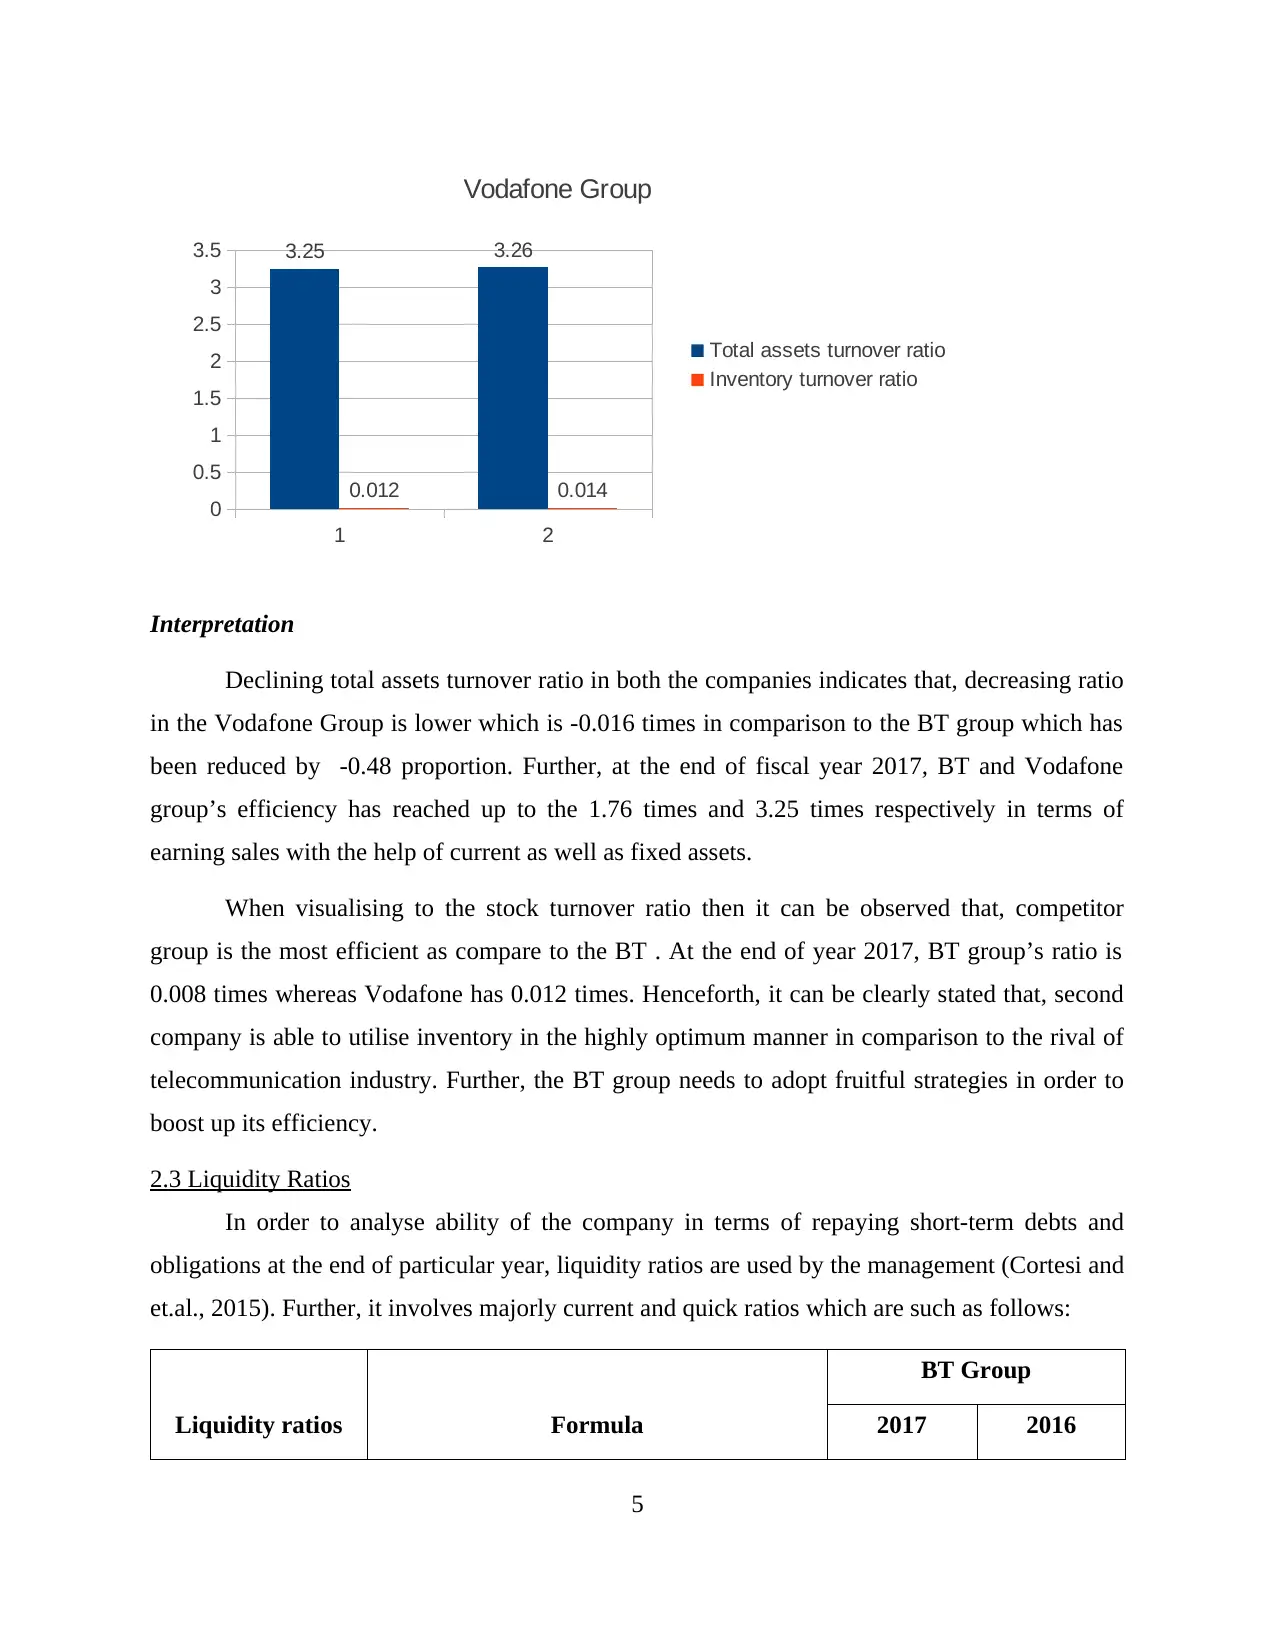
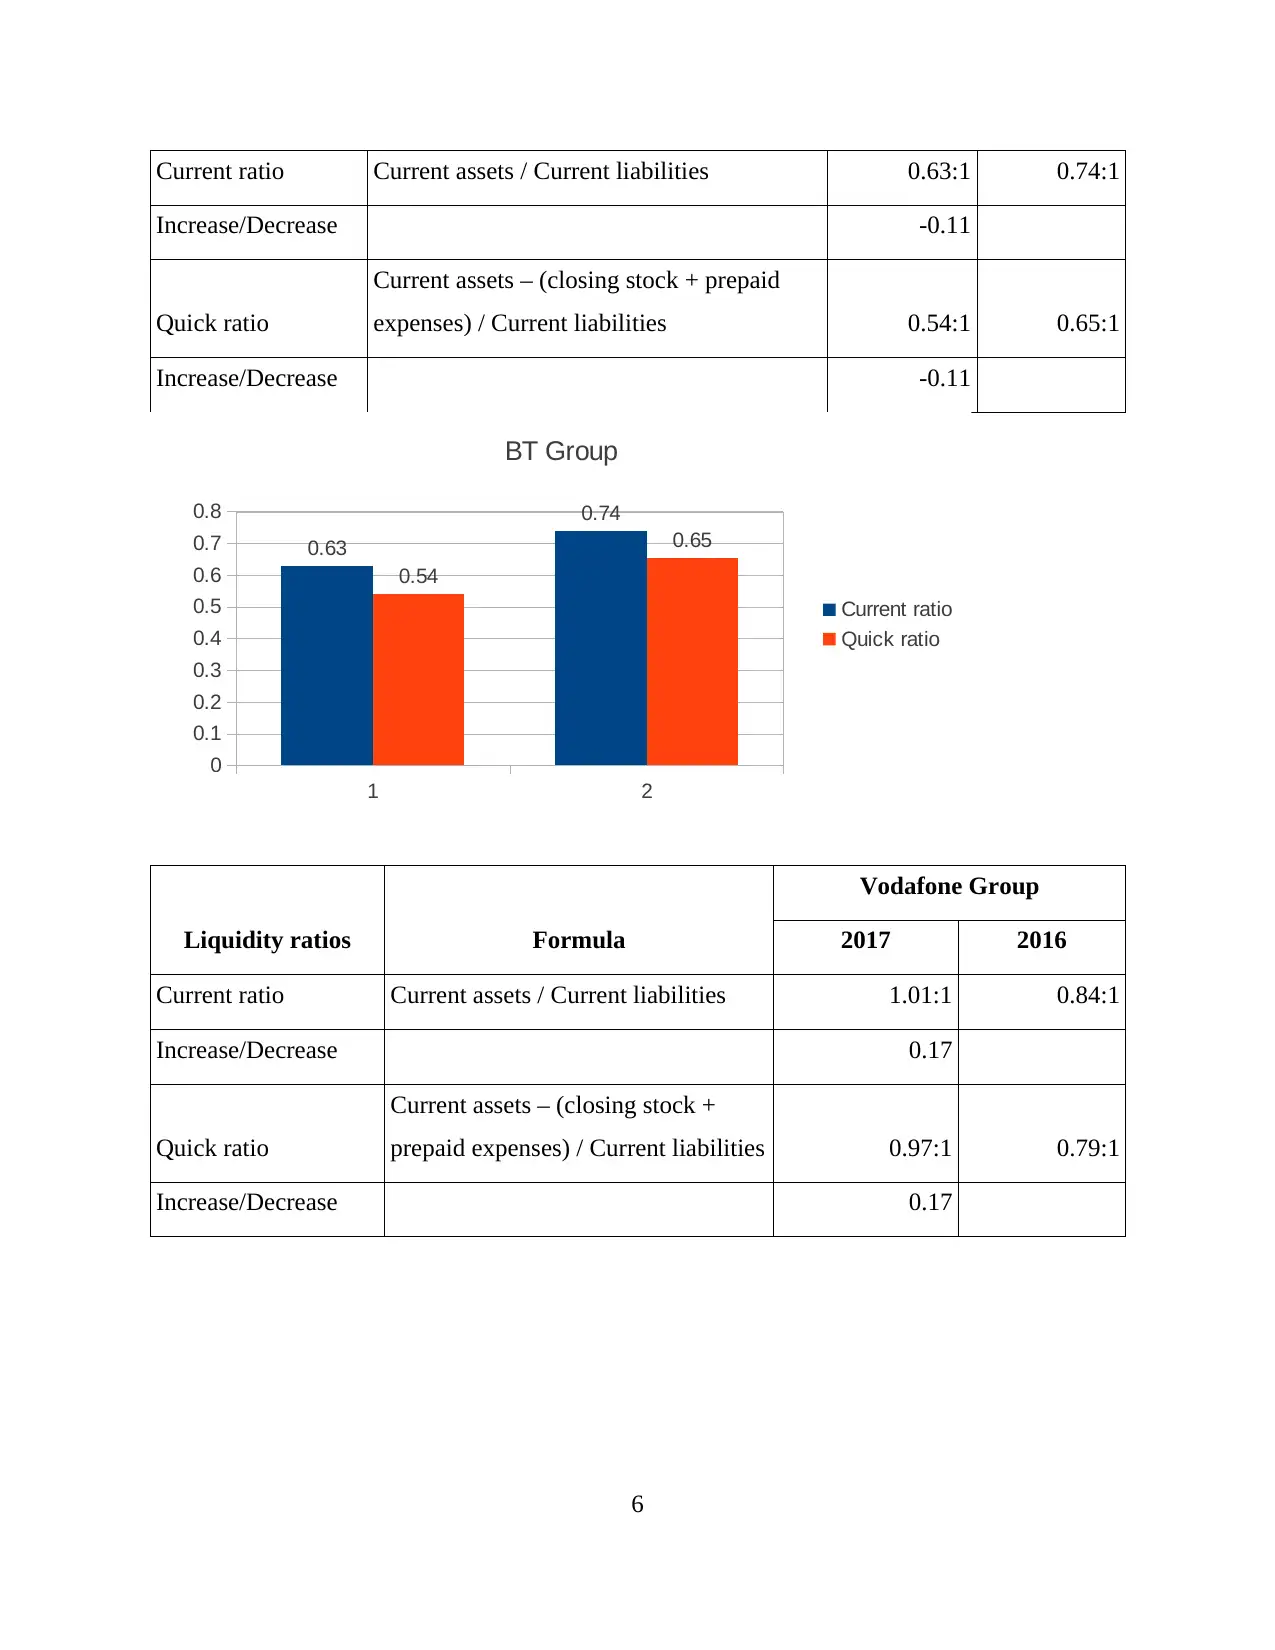
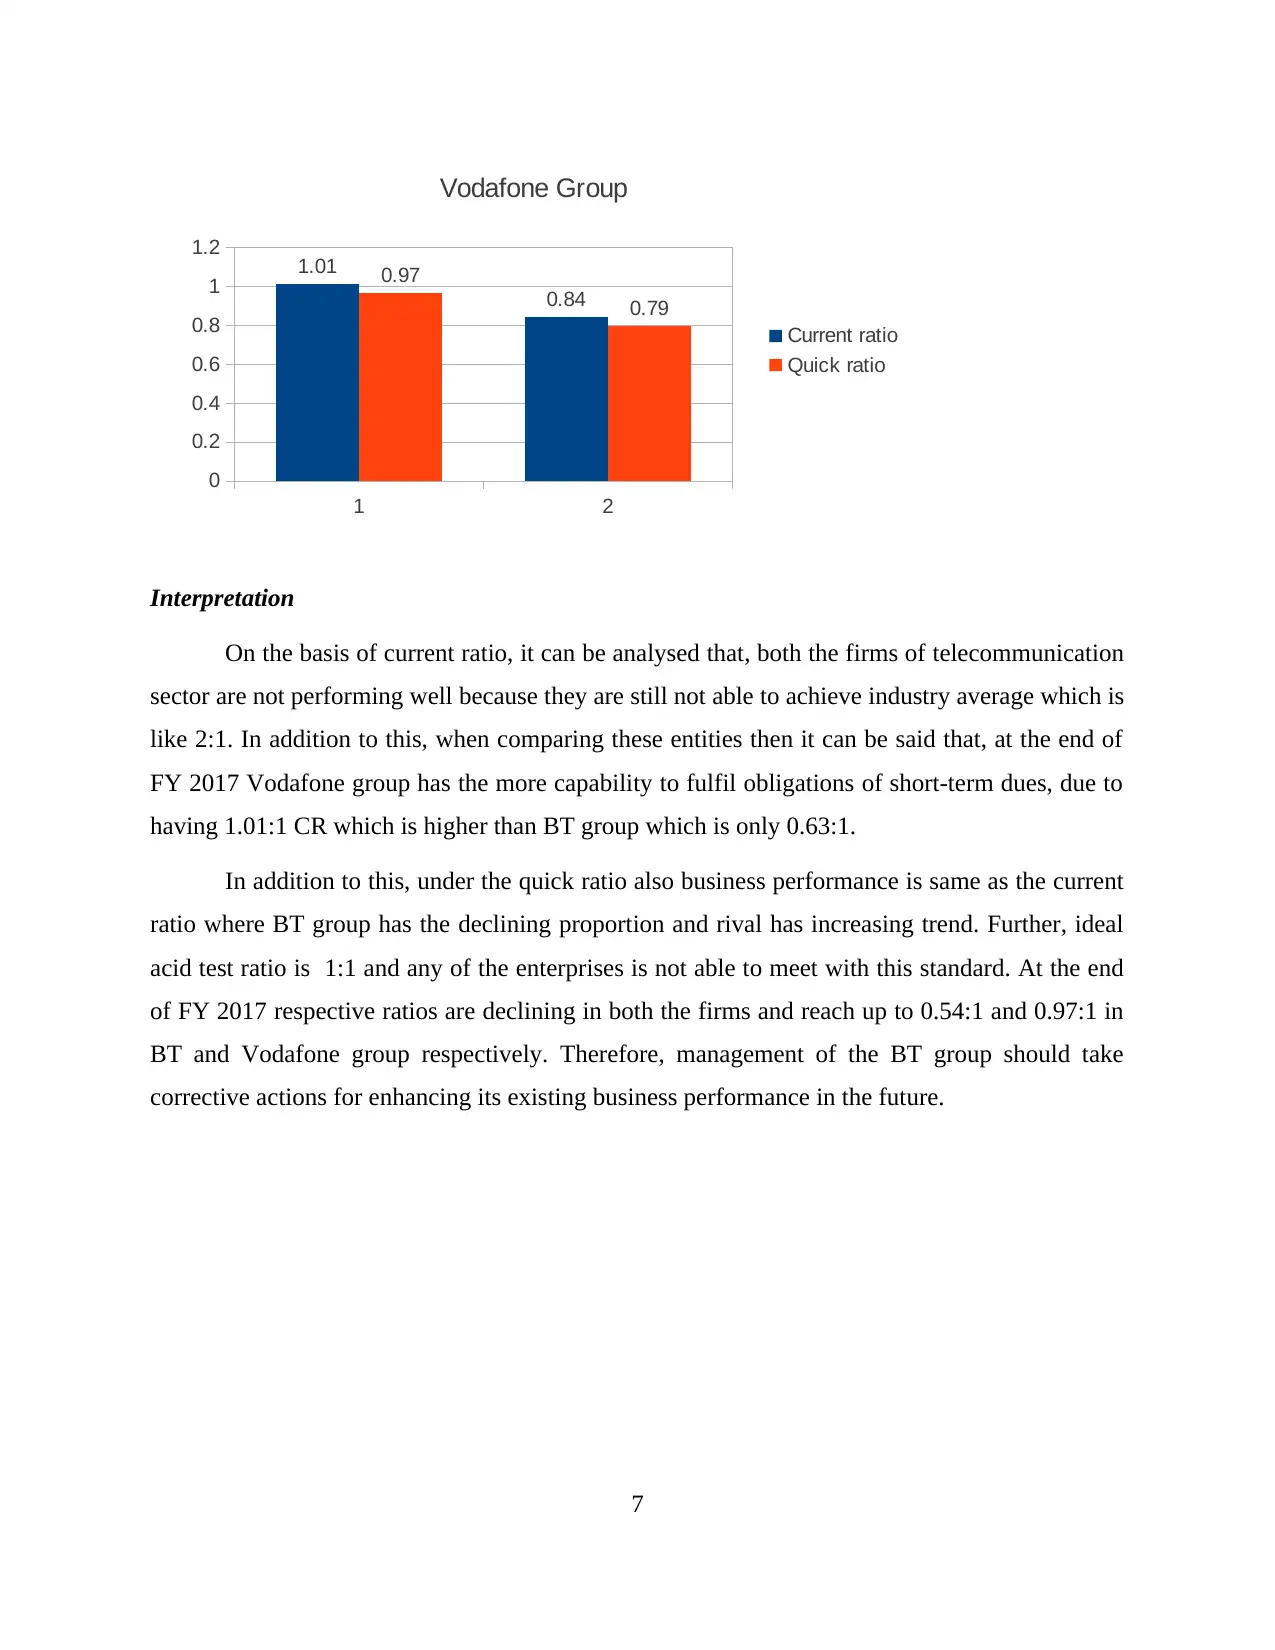
This report conducts a comprehensive financial analysis of the British Telecommunication (BT) group and its competitor, Vodafone Group, both operating in the international telecommunication industry. The analysis utilizes financial ratios, including profitability (gross profit and net profit), efficiency (total assets turnover and inventory turnover), and liquidity (current and quick ratios) to assess the financial performance of both companies for the years 2016 and 2017. The report compares the performance of BT and Vodafone across these ratios, highlighting their strengths and weaknesses in managing costs, assets, and short-term obligations. Additionally, the report examines various sources of finance and financial management strategies, specifically focusing on capital structure and dividend policies of the two companies. The findings offer insights into the companies' abilities to generate profits, manage assets efficiently, and meet their short-term financial obligations, providing a comparative perspective on their financial health and strategic approaches.
tabler-icon-diamond-filled.svg

Contribute Materials

Your contribution can guide someone’s learning journey. Share your documents today.
Document Page
INTERNATIONAL
FINANCIAL STATEMENTS
tabler-icon-diamond-filled.svg

Secure Best Marks with AI Grader

Need help grading? Try our AI Grader for instant feedback on your assignments.
Document Page
TABLE OF CONTENTS
1.0 INTRODUCTION.....................................................................................................................1
2.0 FINANCIAL STATEMENT.....................................................................................................1
2.1 Profitability Ratios............................................................................................................1
2.2 Efficiency Ratios..............................................................................................................2
2.3 Liquidity Ratios................................................................................................................3
2.4 Financial Gearing.............................................................................................................5
3.0 SOURCES OF FINANCE.........................................................................................................5
3.1 Short-term Sources...........................................................................................................5
3.2 Long-term Sources...........................................................................................................5
4.0 FINANCIAL MANAGEMENT STRATEGIES.......................................................................5
4.1 Capital Structure...............................................................................................................5
4.2 Dividend...........................................................................................................................5
5.0 CONCLUSION..........................................................................................................................5
6.0 REFERENCES..........................................................................................................................6
Document Page
1.0 INTRODUCTION
The process by which performance of the company can be assessed within the relevant
market segment is called as the financial analysis. After making analysis of the business, it
enables to know that in which areas improvement is needed to perform better. The present study
is based on the British Telecommunication (BT) group along with its competitor like Vodafone
Group. Both the chosen entities operating in the telecommunication industry at the international
market and have presence across the globe. The research shows business performance of both the
firms with the help of financial ratios. Apart from this, various kinds of long-term and short-term
financing sources are explained which are supportive in order to raise capital within workplace.
In the last part of the present project, strategies for managing the financial resources are
described by using capital structure and dividend policy of both the telecommunication groups.
2.0 FINANCIAL STATEMENT
Those statements which show several aspects of the finances about the particular business
firm and supportive in terms of deriving its performance in the industry are known as the
financial statements. Further, in order to make interpretation of such accounts like balance sheet,
profit and loss etc. there are different tools available (Robinson and et.al., 2015). One of the very
effective and helpful measurement method is financial ratio analysis which includes several tools
such as efficiency, profitability, liquidity, gearing ratios etc. Analysis of the financial statement
of the BT and Vodafone group using ratios is explained below:
2.1 Profitability Ratios
The ratio which reflects about the profit conditions of the cited firms at the end of year is
known as the profitability ratios. It includes basically two terms which are gross profit and net
income ratio (Weygandt, Kimmel and Kieso, 2015). Further, calculation and analysis of these
ratios are stated below:
Profitability ratios Formula
BT Group
2017 2016
Gross Profit Ratio Gross income / Net sales *100 57.08% 54.97%
Increase/Decrease 2.11%
1
Document Page
Net Profit Ratio Net income / Net sales * 100 7.93% 13.59%
Increase/Decrease -5.66%
1 2
0
0.1
0.2
0.3
0.4
0.5
0.6 57.08% 54.97%
7.93%
13.59%
BT Group
Gross Profit Ratio
Net Profit Ratio
Profitability ratios Formula
Vodafone Group
2017 2016
Gross Profit Ratio Gross income / Net sales *100 27.41% 25.72%
Increase/Decrease 1.69%
Net Profit Ratio Net income / Net sales * 100 -13.22% -9.82%
Increase/Decrease -3.40%
2
tabler-icon-diamond-filled.svg

Secure Best Marks with AI Grader

Need help grading? Try our AI Grader for instant feedback on your assignments.
Document Page
1 2
-0.2
-0.15
-0.1
-0.05
0
0.05
0.1
0.15
0.2
0.25
0.3 27.41% 25.72%
-13.22% -9.82%
Vodafone Group
Gross Profit Ratio
Net Profit Ratio
Interpretation
From the GP ratio, it can be assessed that, BT group is performing well in the
telecommunication industry because it has been increased with 2.11% from FY 2016 to 2017. On
the other hand, when looking at the Vodafone group then it improved with 1.69% only which is
lower as compared to the BT group. On the basis of such differences it can be analysed that, BT
group has more capability in terms of managing and reducing the cost of goods sold at the end of
FY 2017.
Moreover, NP ratio is declining in both the companies which is like -5.66% and -3.40%
under the BT and Vodafone group respectively. It can be said that both are not able to generate
positive final income at the end of accounting period 2017. In addition to this, when looking at
the NP ratio individually then it can be found that, BT has effective strategies in order to decline
and manage total indirect expenses in comparison to its competitors.
2.2 Efficiency Ratios
Another tool is efficiency ratio which shows that, company’s efficiency in terms of
generating sales or revenue with the help of assets and stock (Francis and et.al., 2015).
Moreover, such ratios for both the firms at the end of FY 2016 and 2017 are stated below:
Efficiency ratios Formula
BT Group
2017 2016
3
Document Page
Total assets turnover ratio Total assets / Net sales 1.76 2.24
Increase/Decrease -0.48
Inventory turnover ratio Inventory / Net sales 0.008 0.012
Increase/Decrease -0.004
1 2
0
0.5
1
1.5
2
2.5
1.76
2.24
0.008 0.012
BT Group
Total assets turnover ra-
tio
Inventory turnover ratio
Efficiency ratios Formula
Vodafone Group
2017 2016
Total assets turnover ratio Total assets / Net sales 3.25 3.26
Increase/Decrease -0.016
Inventory turnover ratio Inventory / Net sales 0.012 0.014
Increase/Decrease -0.002
4
Document Page
1 2
0
0.5
1
1.5
2
2.5
3
3.5 3.25 3.26
0.012 0.014
Vodafone Group
Total assets turnover ratio
Inventory turnover ratio
Interpretation
Declining total assets turnover ratio in both the companies indicates that, decreasing ratio
in the Vodafone Group is lower which is -0.016 times in comparison to the BT group which has
been reduced by -0.48 proportion. Further, at the end of fiscal year 2017, BT and Vodafone
group’s efficiency has reached up to the 1.76 times and 3.25 times respectively in terms of
earning sales with the help of current as well as fixed assets.
When visualising to the stock turnover ratio then it can be observed that, competitor
group is the most efficient as compare to the BT . At the end of year 2017, BT group’s ratio is
0.008 times whereas Vodafone has 0.012 times. Henceforth, it can be clearly stated that, second
company is able to utilise inventory in the highly optimum manner in comparison to the rival of
telecommunication industry. Further, the BT group needs to adopt fruitful strategies in order to
boost up its efficiency.
2.3 Liquidity Ratios
In order to analyse ability of the company in terms of repaying short-term debts and
obligations at the end of particular year, liquidity ratios are used by the management (Cortesi and
et.al., 2015). Further, it involves majorly current and quick ratios which are such as follows:
Liquidity ratios Formula
BT Group
2017 2016
5
tabler-icon-diamond-filled.svg

Paraphrase This Document

Need a fresh take? Get an instant paraphrase of this document with our AI Paraphraser
Document Page
Current ratio Current assets / Current liabilities 0.63:1 0.74:1
Increase/Decrease -0.11
Quick ratio
Current assets – (closing stock + prepaid
expenses) / Current liabilities 0.54:1 0.65:1
Increase/Decrease -0.11
1 2
0
0.1
0.2
0.3
0.4
0.5
0.6
0.7
0.8
0.63
0.74
0.54
0.65
BT Group
Current ratio
Quick ratio
Liquidity ratios Formula
Vodafone Group
2017 2016
Current ratio Current assets / Current liabilities 1.01:1 0.84:1
Increase/Decrease 0.17
Quick ratio
Current assets – (closing stock +
prepaid expenses) / Current liabilities 0.97:1 0.79:1
Increase/Decrease 0.17
6
Document Page
1 2
0
0.2
0.4
0.6
0.8
1
1.2 1.01
0.84
0.97
0.79
Vodafone Group
Current ratio
Quick ratio
Interpretation
On the basis of current ratio, it can be analysed that, both the firms of telecommunication
sector are not performing well because they are still not able to achieve industry average which is
like 2:1. In addition to this, when comparing these entities then it can be said that, at the end of
FY 2017 Vodafone group has the more capability to fulfil obligations of short-term dues, due to
having 1.01:1 CR which is higher than BT group which is only 0.63:1.
In addition to this, under the quick ratio also business performance is same as the current
ratio where BT group has the declining proportion and rival has increasing trend. Further, ideal
acid test ratio is 1:1 and any of the enterprises is not able to meet with this standard. At the end
of FY 2017 respective ratios are declining in both the firms and reach up to 0.54:1 and 0.97:1 in
BT and Vodafone group respectively. Therefore, management of the BT group should take
corrective actions for enhancing its existing business performance in the future.
7
Document Page
2.4 Financial Gearing
3.0 SOURCES OF FINANCE
3.1 Short-term Sources
3.2 Long-term Sources
4.0 FINANCIAL MANAGEMENT STRATEGIES
4.1 Capital Structure
4.2 Dividend
5.0 CONCLUSION
8
tabler-icon-diamond-filled.svg

Secure Best Marks with AI Grader

Need help grading? Try our AI Grader for instant feedback on your assignments.
Document Page
6.0 REFERENCES
Books and Journals
Cortesi, A. and et.al., 2015. Advanced Financial Accounting: Financial Statement Analysis–
Accounting Issues–Group Accounts. EGEA spa.
Francis, B. and et.al., 2015. Gender differences in financial reporting decision making: Evidence
from accounting conservatism. Contemporary Accounting Research. 32(3). pp.1285-1318.
Revell, J. ed., 2016. The recent evolution of financial systems. Springer.
Robinson, T. R. and et.al., 2015.International financial statement analysis. John Wiley & Sons.
Weygandt, J. J., Kimmel, P. D. and Kieso, D. E., 2015. Financial & Managerial Accounting.
John Wiley & Sons.
9
chevron_up_icon
1 out of 11
circle_padding
hide_on_mobile
zoom_out_icon
logo.png

Your All-in-One AI-Powered Toolkit for Academic Success.

Available 24*7 on WhatsApp / Email

[object Object]