BTEC 90 Credit Diploma in Engineering Unit 53 Measurement Report
VerifiedAdded on 2020/04/13
|11
|1078
|206
Report
AI Summary
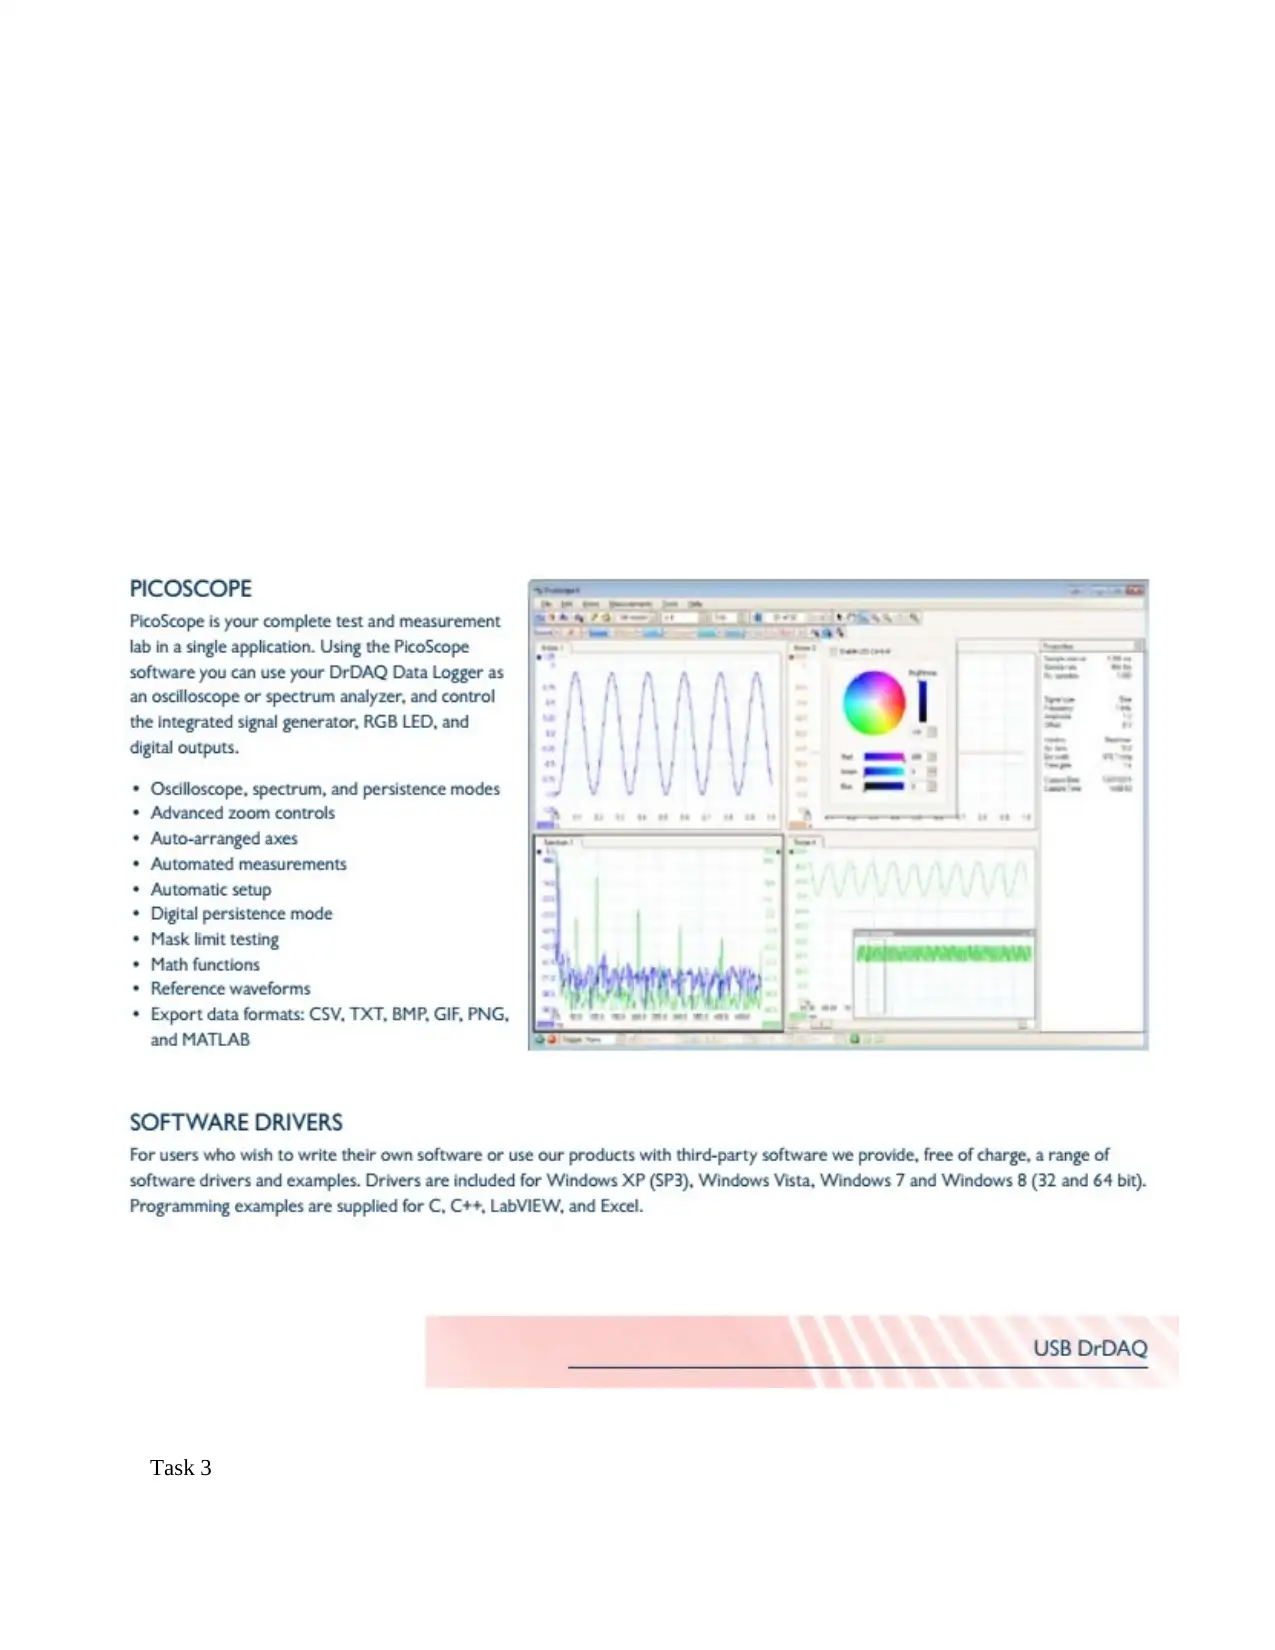
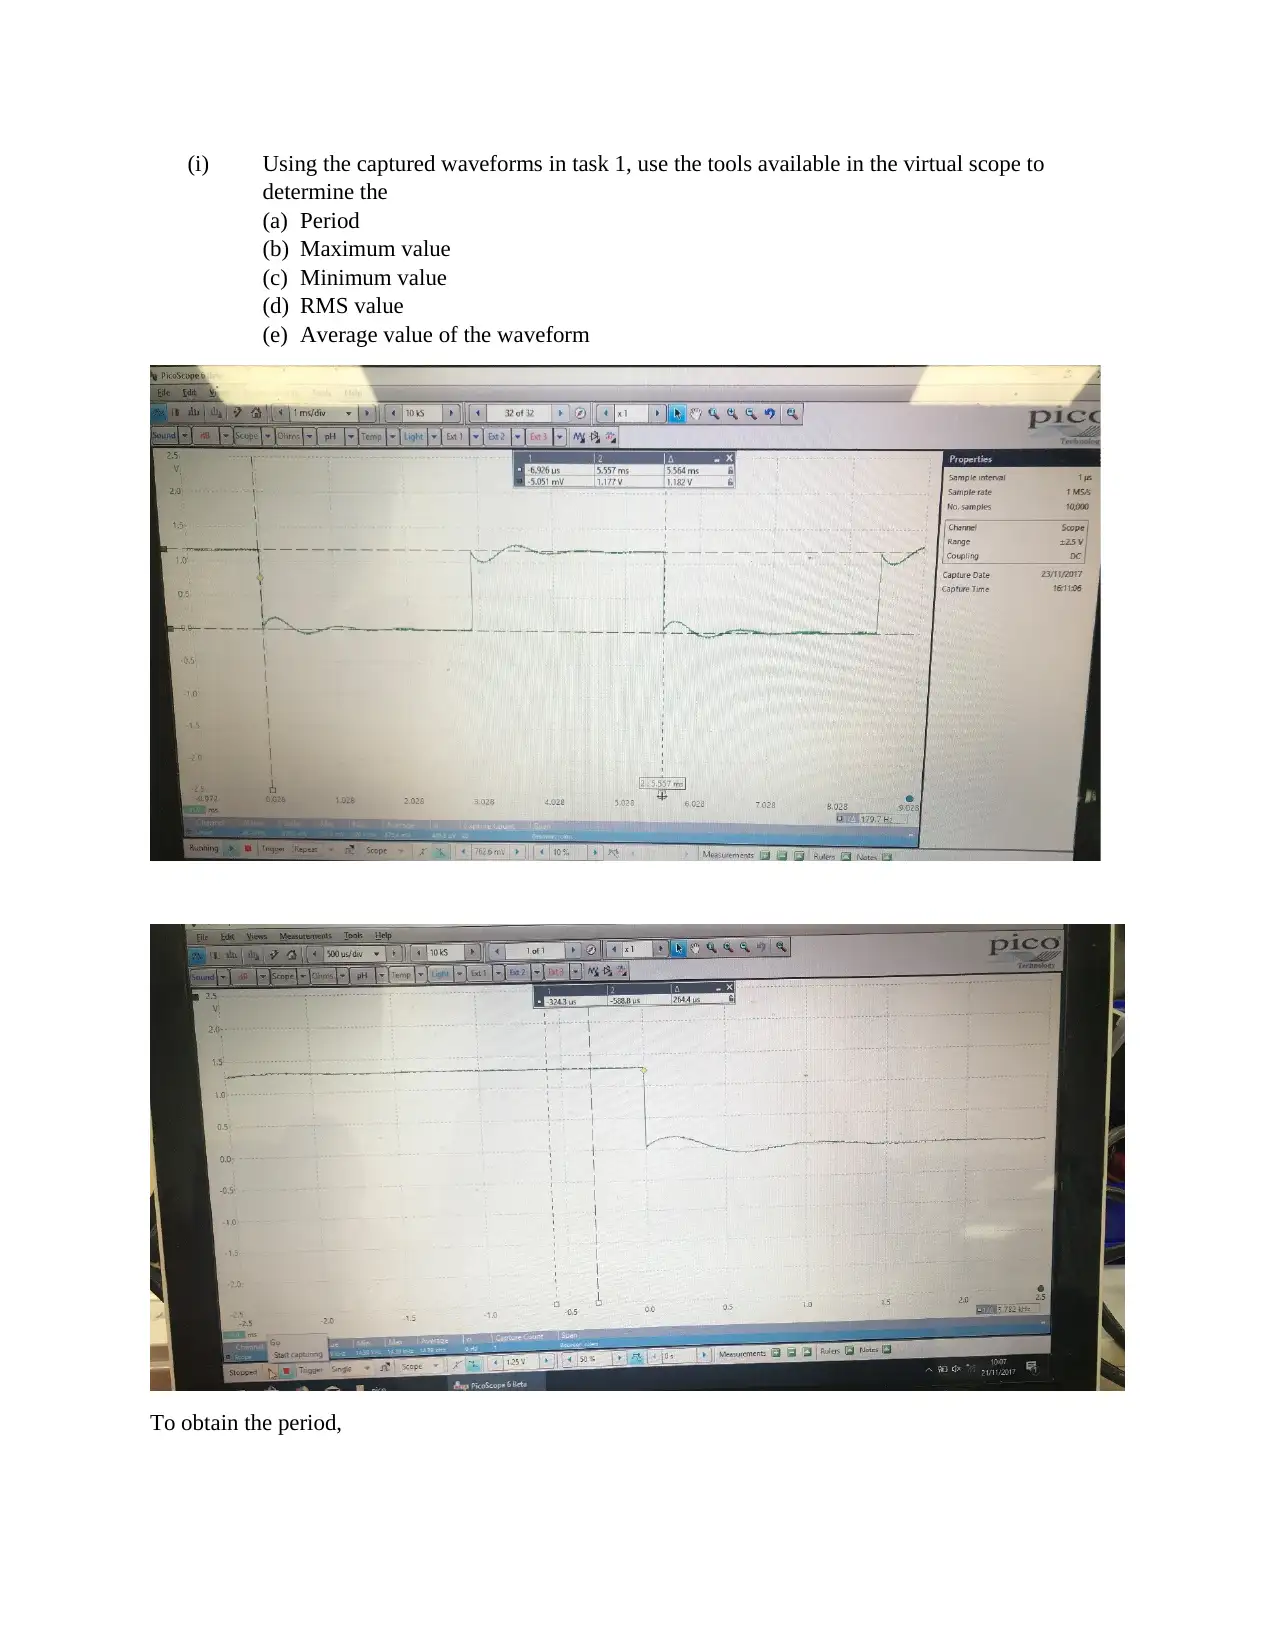
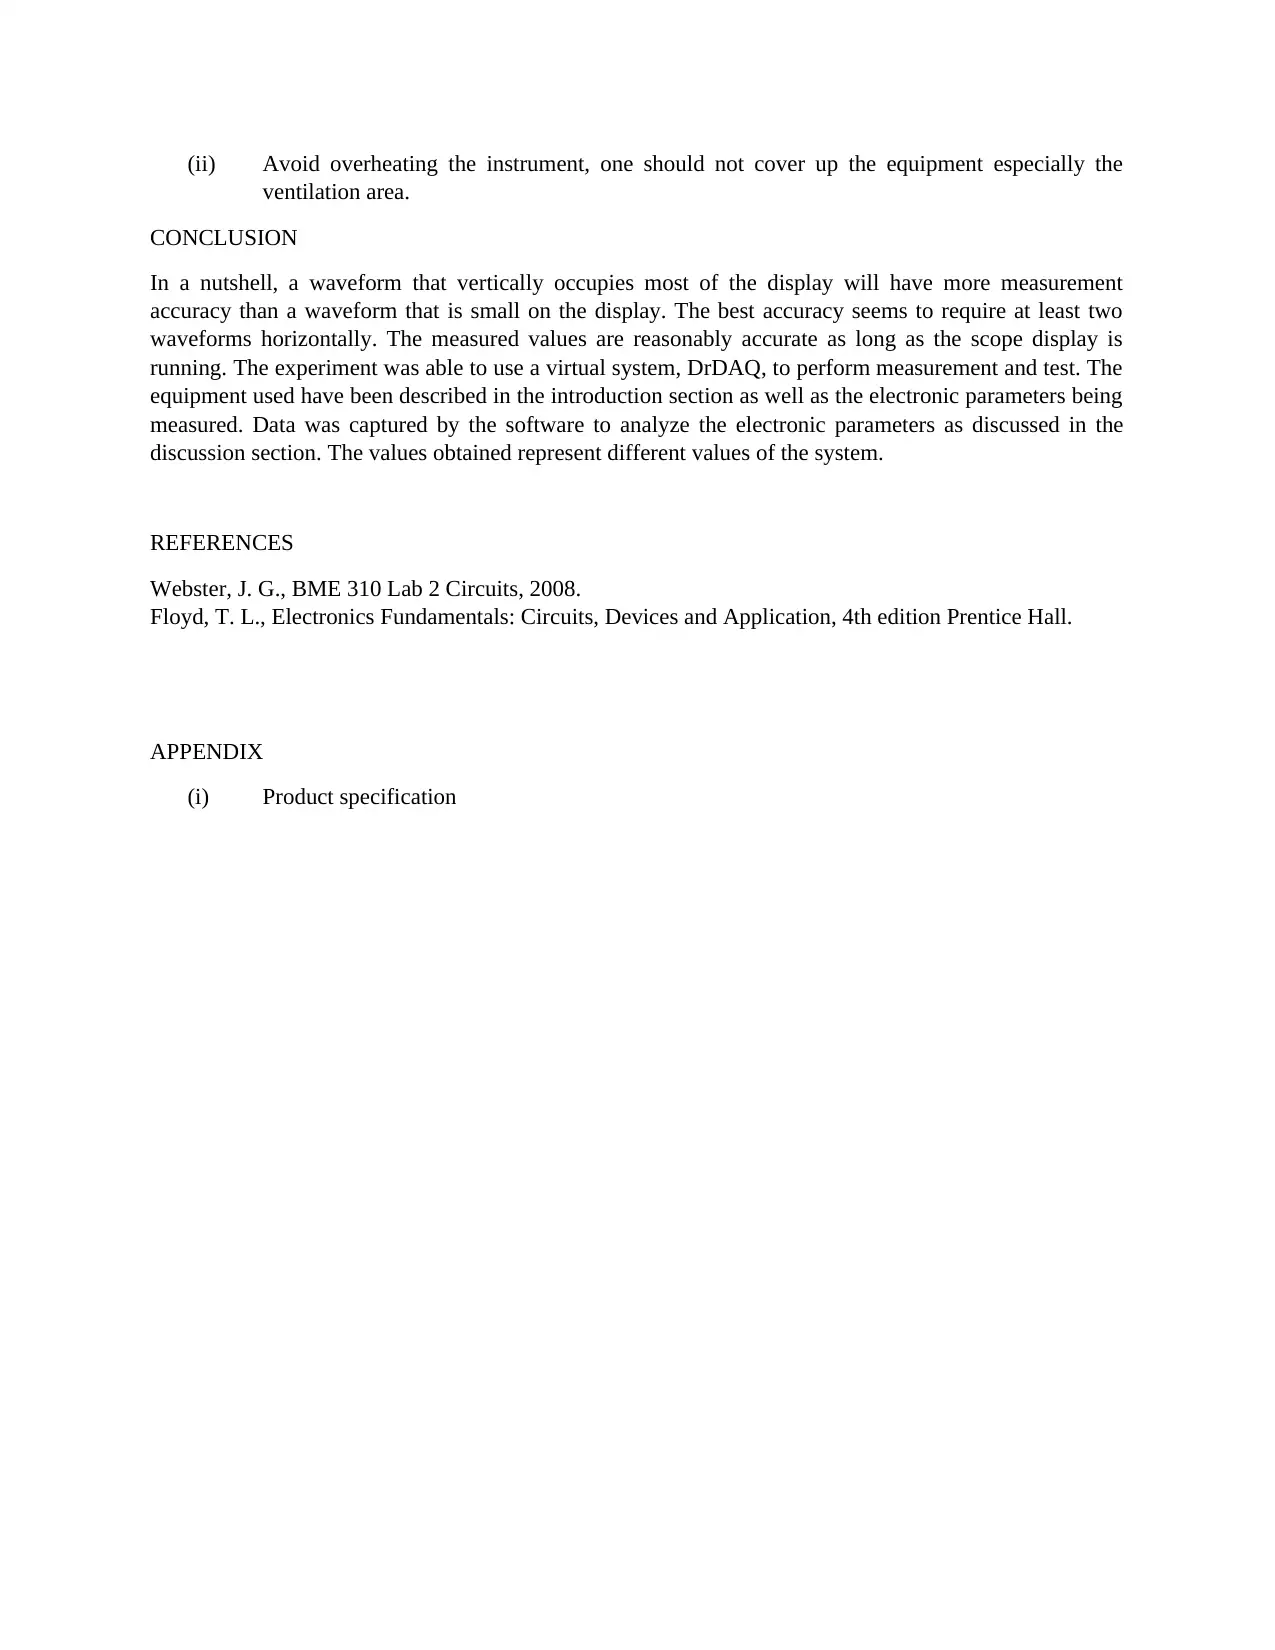
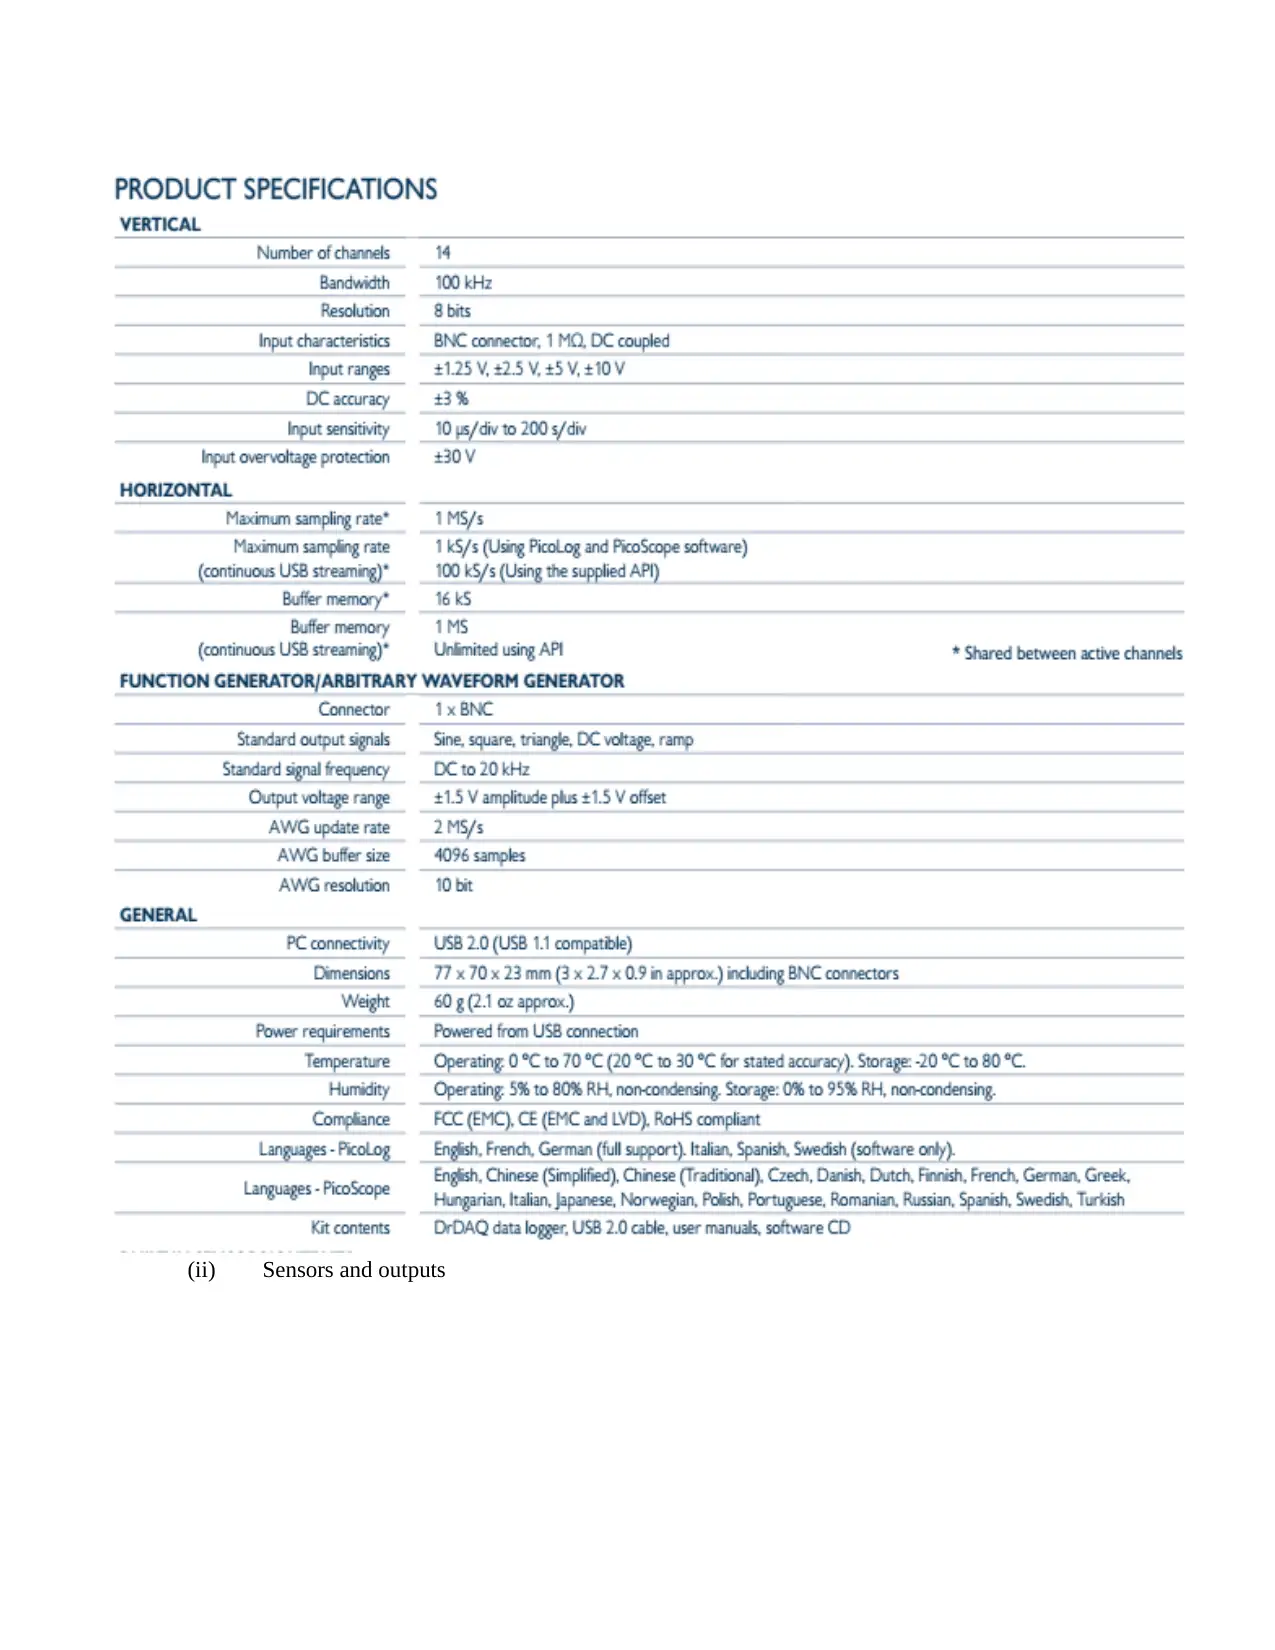
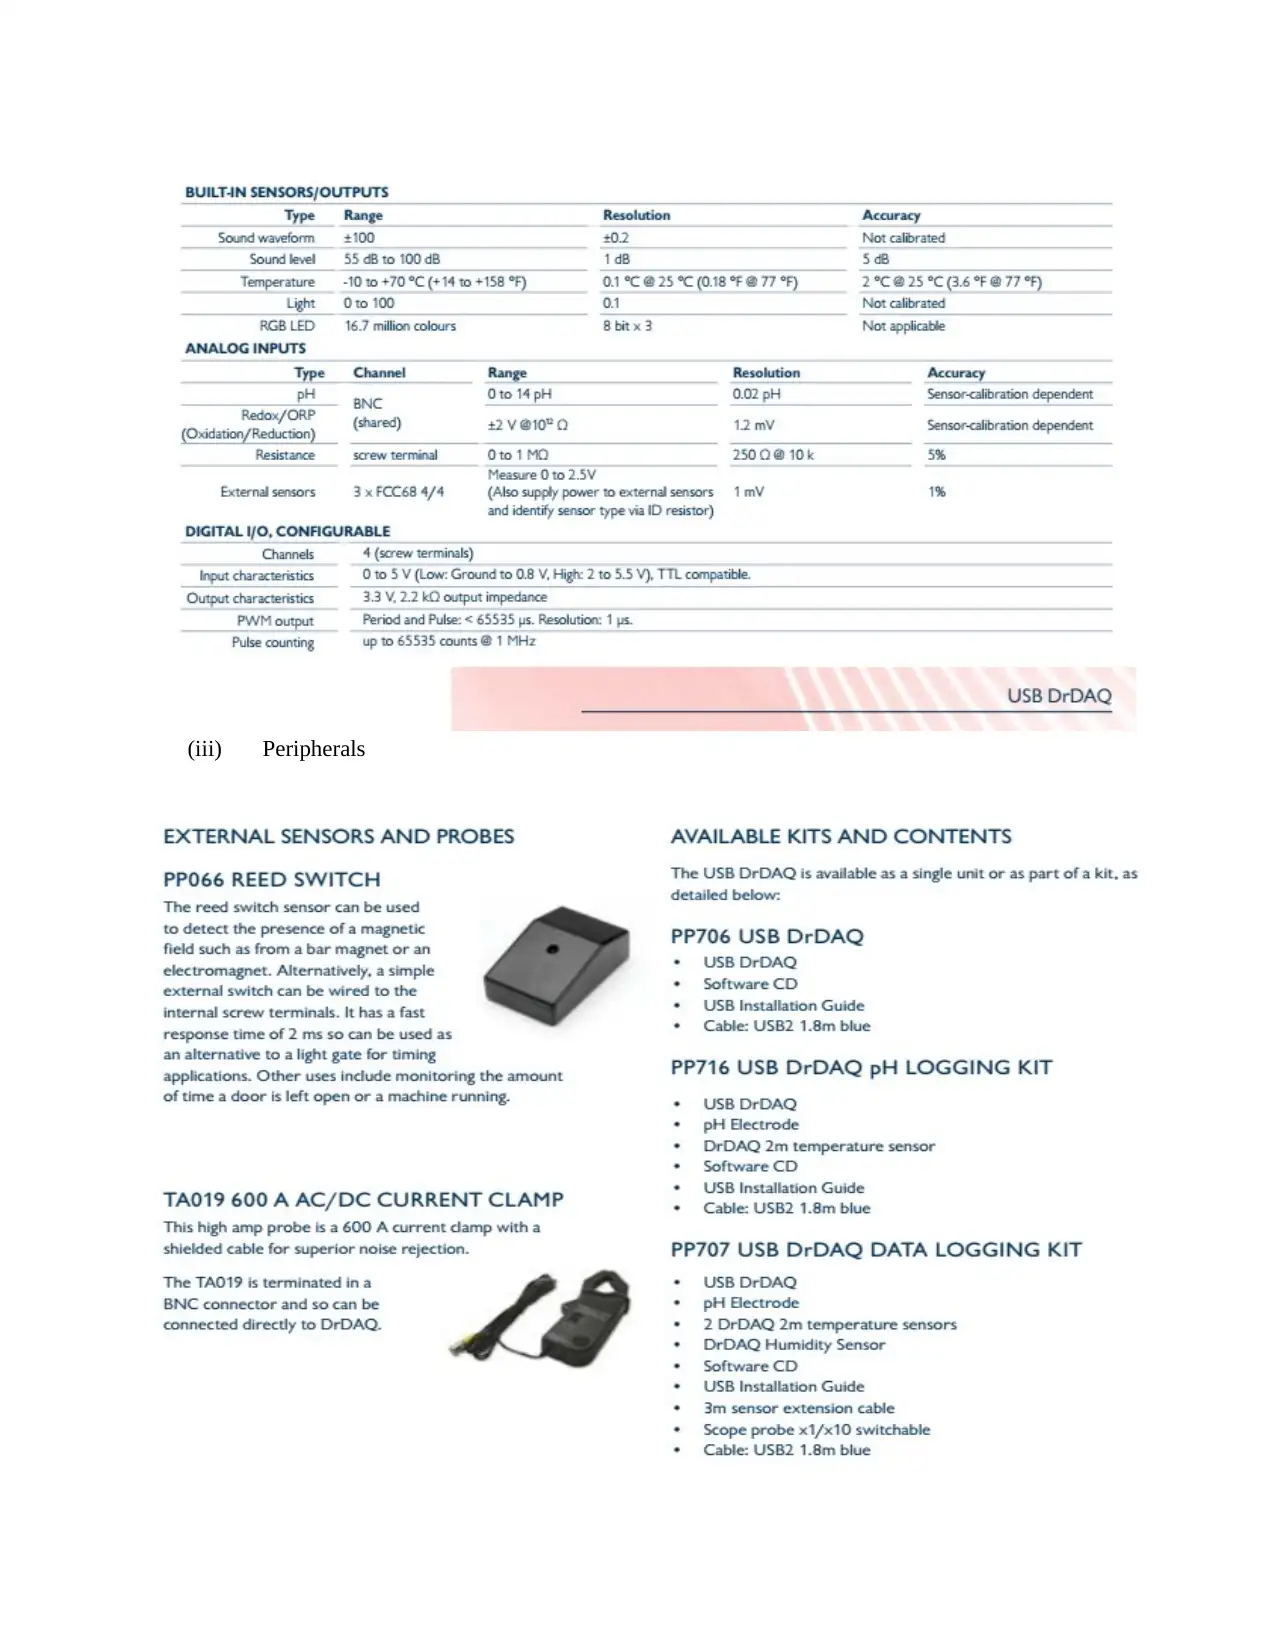
This report details an electronic measurement and testing experiment conducted using a DrDAQ virtual oscilloscope. The assignment focuses on analyzing electronic waveforms generated by a signal generator and the response of a circuit. The procedure involves connecting the signal generator to the circuit and using the virtual oscilloscope to measure the step response. The report describes the system used, including the DrDAQ data logger and virtual oscilloscope, and references the manufacturer's data sheet for key parameters. The core of the report involves using the virtual scope to determine various waveform parameters such as period, maximum, minimum, RMS, and average values. The discussion section explains the relationship between these parameters, the effect of the circuit components on the waveform, and the precautions to be observed during measurements. The conclusion emphasizes the importance of waveform display accuracy and the successful use of the virtual system for measurement and testing. References and product specifications are included to support the findings.

UNIVERSITY AFFILIATION
BTEC 90 CREDIT DIPLOMA IN ENGINEERING
UNIT 53 ELECTRONIC MEASURE AND TEST
ASSIGNMENT NO: 3 OF 3 – VIRTUAL TESTING
STUDENT NAME
STUDENT ID
DATE OF SUBMISSION
BTEC 90 CREDIT DIPLOMA IN ENGINEERING
UNIT 53 ELECTRONIC MEASURE AND TEST
ASSIGNMENT NO: 3 OF 3 – VIRTUAL TESTING
STUDENT NAME
STUDENT ID
DATE OF SUBMISSION
Paraphrase This Document
Need a fresh take? Get an instant paraphrase of this document with our AI Paraphraser

INTRODUCTION
DrDAQ virtual oscilloscope is a software section of the USB DrDAQ data logger. It enables one to
generate arbitrary waveform from the inputs section. The PICO technology PC enabled programs are easy
and intuitive to use. The product offers superior viewing quality and they can be used for training and
knowledge transfer sessions. The system has a data logger that captures data and displays it graphically
on a PC using the virtual oscilloscope software. Electronic properties of materials are closely related to
the structure of the material on the atomic scale. The virtual oscilloscope is useful in displaying the
electrical signals on the PC and measure its value. There are various waveforms generated as output such
as,
(i) Square waveform
(ii) Triangle waveform
(iii) Ramp or sawtooth waveform
(iv) Pulse waveform
Some of the main electrical parameters that are analyzed in this paper are the amplitude, period,
frequency, peak values, rms value and the average values. There is a relationship among some of the
parameters for instance the period and the frequency are inversely proportional. The waveform
propagates in cycles and the time taken to complete one full cycle is referred to as the period. The
oscilloscope samples the inputs in terms of 8 bits and provides for 256 possible voltage levels.
AIMS AND OBECTIVES
(i) To determine the measurement of electronic waveform parameters while testing on a piece of
electronic equipment.
(ii) To describe the operation of measurement techniques, instruments, and their connections with
hardware and software.
(iii) To use the virtual oscilloscope to analyze waveforms and discuss the values obtained in terms
of ac and dc values as well as the relationship of the attributes of a waveform.
PROCEDURE
Equipment
(i) DrDAQ data logger and oscilloscope
(ii) BNC-T adapter
(iii) Oscilloscope probes
(iv) Signal generator
(v) BNC to 2 leads
(vi) Connectors and cables connecting function/signal generator to oscilloscopes and speaker.
(vii)
Task 1

(i) Connect a signal generator with a suitable square wave or pulse output to the input of the
circuit as shown below.
(ii) Connect a virtual scope DrDAQ as shown below, with suitable software running on the
attached laptop and carefully measure the step response of the following circuit:
circuit as shown below.
(ii) Connect a virtual scope DrDAQ as shown below, with suitable software running on the
attached laptop and carefully measure the step response of the following circuit:
⊘ This is a preview!⊘
Do you want full access?
Subscribe today to unlock all pages.

Trusted by 1+ million students worldwide

Task 2
(i) Describe the system used in task 1 above
(ii) Obtain a copy of the manufactures data sheet and list the key parameters and limitations of
the device.
Some of the key features of the DrDAQ data logger and virtual oscilloscope are,
(i) Describe the system used in task 1 above
(ii) Obtain a copy of the manufactures data sheet and list the key parameters and limitations of
the device.
Some of the key features of the DrDAQ data logger and virtual oscilloscope are,
Paraphrase This Document
Need a fresh take? Get an instant paraphrase of this document with our AI Paraphraser

Task 3

(i) Using the captured waveforms in task 1, use the tools available in the virtual scope to
determine the
(a) Period
(b) Maximum value
(c) Minimum value
(d) RMS value
(e) Average value of the waveform
To obtain the period,
determine the
(a) Period
(b) Maximum value
(c) Minimum value
(d) RMS value
(e) Average value of the waveform
To obtain the period,
⊘ This is a preview!⊘
Do you want full access?
Subscribe today to unlock all pages.

Trusted by 1+ million students worldwide

f = 1
T
Where T is the period of the waveform; making T the subject of the formula,
T = 1
f
T = 1
1.144 k =0.874125 x 10⁻⁴ sec
T = 1
179.7 =5.5648 x 10⁻³ sec
T = 1
3.782k =2.6441 x 10⁻⁴ sec
The maximum and minimum values can be read from the waveform on the PICO software,
Max value = 1.182 Volts
Min value= 1.177 Volts
To obtain the RMS value,
V rms=0.7071 x 1.182 volts
V rms=0.8358 volts
To obtain the average value,
For an alternating current, the RMS value is approximately 0.707 of its peak value. The form factor of an
AC waveform is the ratio of its RMS value to its average value. In practice or mathematically, the form
factor is given as,
Form factor=1.11 ( ratio )
Form factor= Erms
Eav
Eav= Erms
FormFactor
Eav= 0.8358
1.11 =0.75297 Volts
Paraphrase This Document
Need a fresh take? Get an instant paraphrase of this document with our AI Paraphraser

DISCUSSION
Due to the interaction between the capacitor and the coil the waveform as measured by the virtual
oscilloscope should show oscillations on the rising and falling edges of the pulses. The frequency of the
oscillations is given by,
f = 1
2 π √ LC
The recorded frequency and inductance is,
f =1.144 KHz , L=0.484 H
Where f is the frequency in Hz, L is the inductance in Henrys and C is the capacitance in Farads.
To obtain the inductance of the transformer coil,
f = 1
2 π √ LC
Making L the subject of the formula,
( 2 πf )2 = 1
LC
L= 1
( 2 πf ) 2 C
The following are the values for the frequency and capacitance,
F 1144Hz
C 40nF
L= 1
( 2 π∗1144 )2∗40∗10−9
L=0.48386 H
The voltage at any point along the square wave is equal to the maximum or the peak voltage value. The
peak to peak voltage is the amount of voltage attained by the waveform. The peak value is the maximum
amount of voltage attained by the waveform. The instantaneous voltage at any point on a square wave is
equal to the peak or maximum voltage as displayed on the oscilloscope value section. The peak value of
combined wave is the sum of the DC voltage and the peak value of the AC waveform amplitude. The
average values are called the dc values of a waveform. The dc meters indicate the average values as
opposed to the instantaneous values. To find the average value of a waveform the areas above axis are
positive and areas below the axis are negative. The effective value of the rms value of the waveform is
equivalent to a dc value. It tells how many volts or amps of dc that an ac waveform supplies in terms of
its ability to produce the same average power. Some precautions to observe when taking measurements
using the DrDAQ oscilloscope,
(i) The input should not be more than 400V.

(ii) Avoid overheating the instrument, one should not cover up the equipment especially the
ventilation area.
CONCLUSION
In a nutshell, a waveform that vertically occupies most of the display will have more measurement
accuracy than a waveform that is small on the display. The best accuracy seems to require at least two
waveforms horizontally. The measured values are reasonably accurate as long as the scope display is
running. The experiment was able to use a virtual system, DrDAQ, to perform measurement and test. The
equipment used have been described in the introduction section as well as the electronic parameters being
measured. Data was captured by the software to analyze the electronic parameters as discussed in the
discussion section. The values obtained represent different values of the system.
REFERENCES
Webster, J. G., BME 310 Lab 2 Circuits, 2008.
Floyd, T. L., Electronics Fundamentals: Circuits, Devices and Application, 4th edition Prentice Hall.
APPENDIX
(i) Product specification
⊘ This is a preview!⊘
Do you want full access?
Subscribe today to unlock all pages.

Trusted by 1+ million students worldwide

(ii) Sensors and outputs
Paraphrase This Document
Need a fresh take? Get an instant paraphrase of this document with our AI Paraphraser

(iii) Peripherals
1 out of 11
Related Documents

Your All-in-One AI-Powered Toolkit for Academic Success.
+13062052269
info@desklib.com
Available 24*7 on WhatsApp / Email
Unlock your academic potential
Copyright © 2020–2025 A2Z Services. All Rights Reserved. Developed and managed by ZUCOL.