BTEC Level 4 HND Business: Talent Management Project Report, 2021
VerifiedAdded on 2021/06/17
|28
|9581
|256
Report
AI Summary
This report presents the findings of a talent management project conducted for a BTEC Level 4 HND Diploma in Business, focusing on Unit 6: Management a Successful Business Project. The project, completed in 2021, involved analyzing research and data, communicating recommendations, and reflecting on the project's value for sustainable organizational performance. The report includes a detailed methodology section, outlining the use of primary and secondary data, quantitative and qualitative data collection methods, and considerations for reliability and validity. The project aimed to assess the current recruiting process, the match between assignments and employee abilities, and improve the efficiency of Human Resource management. The report provides a critical review of the project, evaluating objective achievements, benefits, performance, and learned experiences related to talent management. It also includes a weekly logbook and concludes with recommendations for future improvements. The project used a survey method to collect data from Honda Company employees in Ho Chi Minh City. The report also highlights the project's limitations and provides specific recommendations based on the findings.
ASSIGNMENT 2
Qualification BTEC Level 4 HND Diploma in Business
Unit number and title Unit 6: Management a Successful Business Project (491)
Submission date 11/03/2021 Date received (1st submission)
Re-submission date 15/03/2021 Date received (2nd submission)
Student name DO TRAN TUYEN Student ID GBS200028
Class GBS0811 Assessor name HUYNH AI VAN
Student declaration
I certify that the assignment submission is entirely my own work and I fully understand the consequences of plagiarism. I understand that
making a false declaration is a form of malpractice.
Student’s signature:
Grading grid
P5 P6 P7 M3 M4 D2
Paraphrase This Document
Need a fresh take? Get an instant paraphrase of this document with our AI Paraphraser
Page 1 of 27
Summative Feedbacks: Resubmission Feedbacks:
Grade: Assessor Signature: Date:
Internal Verifier’s Comments:
Signature & Date:
Submission Format:
Page 3 of 28
Grade: Assessor Signature: Date:
Internal Verifier’s Comments:
Signature & Date:
Submission Format:
Page 3 of 28
⊘ This is a preview!⊘
Do you want full access?
Subscribe today to unlock all pages.
Trusted by 1+ million students worldwide
Format: This assignment is an Individual report. You must use font Calibri size 12, set
number of the pages and use multiple line spacing at 1.5 with Justify Text to
enhance the legibility for markers. Margins must be: left: 1.25 cm; right: 1 cm;
top: 1 cm and bottom: 1 cm. The reference follows Harvard referencing system.
The recommended word limit is 2000 words (+/- 10%). The cover page of the
report has to be the Assignment front sheet 1. z
Submission Students are compulsory to submit the assignment in due date and in a way
requested by the lecturer. The form of submission will be a hard copy or a soft
copy posted on http://cms.greenwich.edu.vn/. Remember to convert the word
file into PDF file before the submission on CMS. Otherwise, you will fail and have
to retake the assignment.
Note: The individual Assignment must be your own work, and not copied by or from
another student or from books etc. If you use ideas, quotes or data (such as
diagrams) from books, journals or other sources, you must reference your
sources, using the Harvard style. Make sure that you know how to reference
properly, and that understand the guidelines on plagiarism. If you do not, you
definitely get fail!
Unit Learning Outcomes:
LO3 Present the project and communicate appropriate recommendations based on
meaningful conclusions drawn from the evidence findings and/or analysis
LO4 Reflect on the value gained from conducting the project and its usefulness to support
sustainable organisational performance.
Assignment Brief and Guidance:
Theme: Talent Management.
After completing the project management plan, you are required to implement and report the
result. These are your tasks for the second phase:
Page 4 of 28
Paraphrase This Document
Need a fresh take? Get an instant paraphrase of this document with our AI Paraphraser
1. Present and discuss your research findings and data in the form of a report.
2. Communicate appropriate recommendations based on the results of findings and data
analysis to draw valid and meaningful conclusions.
3. Reflect on the value of project management process to meet the stated objectives and
support own learning and performance. Use the following suggestions:
• What did you aim to achieve through your work?
• Did your work succeed in achieving your aims? How do you know? Specifically,
please outline any evaluation and assessment undertaken.
• What aspects of your development process do you think worked well and why?
Evaluate all aspects of the project (e.g. initial research, concept development,
development process, presentation, etc.) from a range of perspectives.
• What problems emerged during the project and how were they tackled? Was there
timely identification of issues and resolution during the project process?
• What did you learn from undertaking the project?
• What are the strengths and weaknesses of your process that you have identified?
• How could your process improve for the future?
4. Evaluate the selection of appropriate tools and techniques for accuracy and authenticity to
support and justify recommendations
5. Evaluate the value of the project management process and the use of quality research to
meet stated objectives and support own learning and performance
6. Critically evaluate and reflect on the benefits of the project’s findings and
recommendations.
7. Critically evaluate the project management process by giving detailed answers to all
questions in the weekly logbooks.
8. Logbook must be attached to student’s portfolio.
Pass Merit Distinction
LO3 Present the project and communicate appropriate
recommendations based on meaningful conclusions
drawn from the evidence findings and/or analysis
D2 Critically evaluate and reflect
on the project outcomes, the
decision- making process and
changes or
Page 5 of 28
P5 Analyse research and
data using appropriate
tools and techniques
meeting project aims and
objectives
P6 Communicate
appropriate
recommendations as a
result of research and data
analysis to draw valid and
meaningful conclusions
M3 Evaluate the selection of
appropriate tools and
techniques for accuracy and
authenticity to support and
justify recommendations
developments of the initial project
management plan to support
justification of recommendations
and learning during the project
LO4 Reflect on the value gained from conducting the
project and its usefulness to support sustainable
organisational performance
P7 Reflect on the value of
undertaking the research
to meet stated objectives
and own learning and
performance
M4 Evaluate the value of the
project management process
and use of quality research
to meet stated objectives
and support own learning
and performance
Table of Contents
I. INTRODUCTION.....................................................................................................................................
II. Methodology.........................................................................................................................................
1. Secondary/ Primary Data......................................................................................................................
2. Quantitative/Qualitative data.............................................................................................................
3. Reliability and Validity........................................................................................................................
4. PROJECT MANAGEMENT....................................................................................................................
5. RACI Matrix.........................................................................................................................................
III. PROJECT RESULTS AND ANALYSIS.......................................................................................................15
IV. LIMITATIONS OF THE PROJECT...........................................................................................................20
V. RECOMENDATIONS.............................................................................................................................20
Page 6 of 28
⊘ This is a preview!⊘
Do you want full access?
Subscribe today to unlock all pages.
Trusted by 1+ million students worldwide
VI. CRITICAL REVIEW................................................................................................................................22
1. Objective achievements......................................................................................................................
2. Benefits of the project........................................................................................................................
3. Performance evaluation.....................................................................................................................
4. Talent Management...........................................................................................................................
5. Learned experience............................................................................................................................
VII. WEEKLY LOGBOOK..............................................................................................................................25
VIII. CONCLUSION.......................................................................................................................................27
References..................................................................................................................................................
ASSIGNMENT 2
I. INTRODUCTION
This task would review the project's findings and share specific recommendations focused on
descriptive studies resulting from evaluations and data collection. Furthermore, I will focus on the
project's advantages and value, as well as its usefulness in improving and promoting long-term
operational performance.
Most businesses must now cope with a staffing deficit. The lack of personnel would have a significant
negative effect on the company. Since prompt workforce replenishment is important, the Human
Resource department will be under a lot of pressure to locate replacements. The theory is as follows:
Mistakes in employment purposes - hiring workers solely for the purpose of finding the best
candidates for the right jobs. As a consequence, it is highly possible that you will end up recruiting the
wrong employee, losing a lot of money and resources. Simultaneously, there is a mismatch between
the number of positions and the number of workers.
The quantitative data collection methods will be implemented with the support of an offline survey
through questionnaires (15 questions) provided to 200 employees from middle management or
below of Honda Company (branch at Ho Chi Minh City). The implementation period is from 31 Dec
2020 to 3 Feb 2021 with the budget 68.360.000 VND. Additionally, there are 7 pre-estimated risks of
design, evaluation, incomplete information, force majeure solution, make a survey, and technology.
This could allow the project to collect relevant data: The current recruiting process consistency, the
degree of match between the amount of assignments and the workers' abilities to succeed, and a
need to enhance the company's current Human Resource management efficiency.
The project's three main objectives are as follows:
Page 7 of 28
Paraphrase This Document
Need a fresh take? Get an instant paraphrase of this document with our AI Paraphraser
+ It's obvious that rescinding more than half of the survey is a bad idea (employees are not able
to answer questions thoroughly)
+ Obtaining the participation of more than 150 employees in the survey.
+ After reviewing the survey data, the director of Human Resources must come up with at least
one solution to the issue and send it to the BOD.
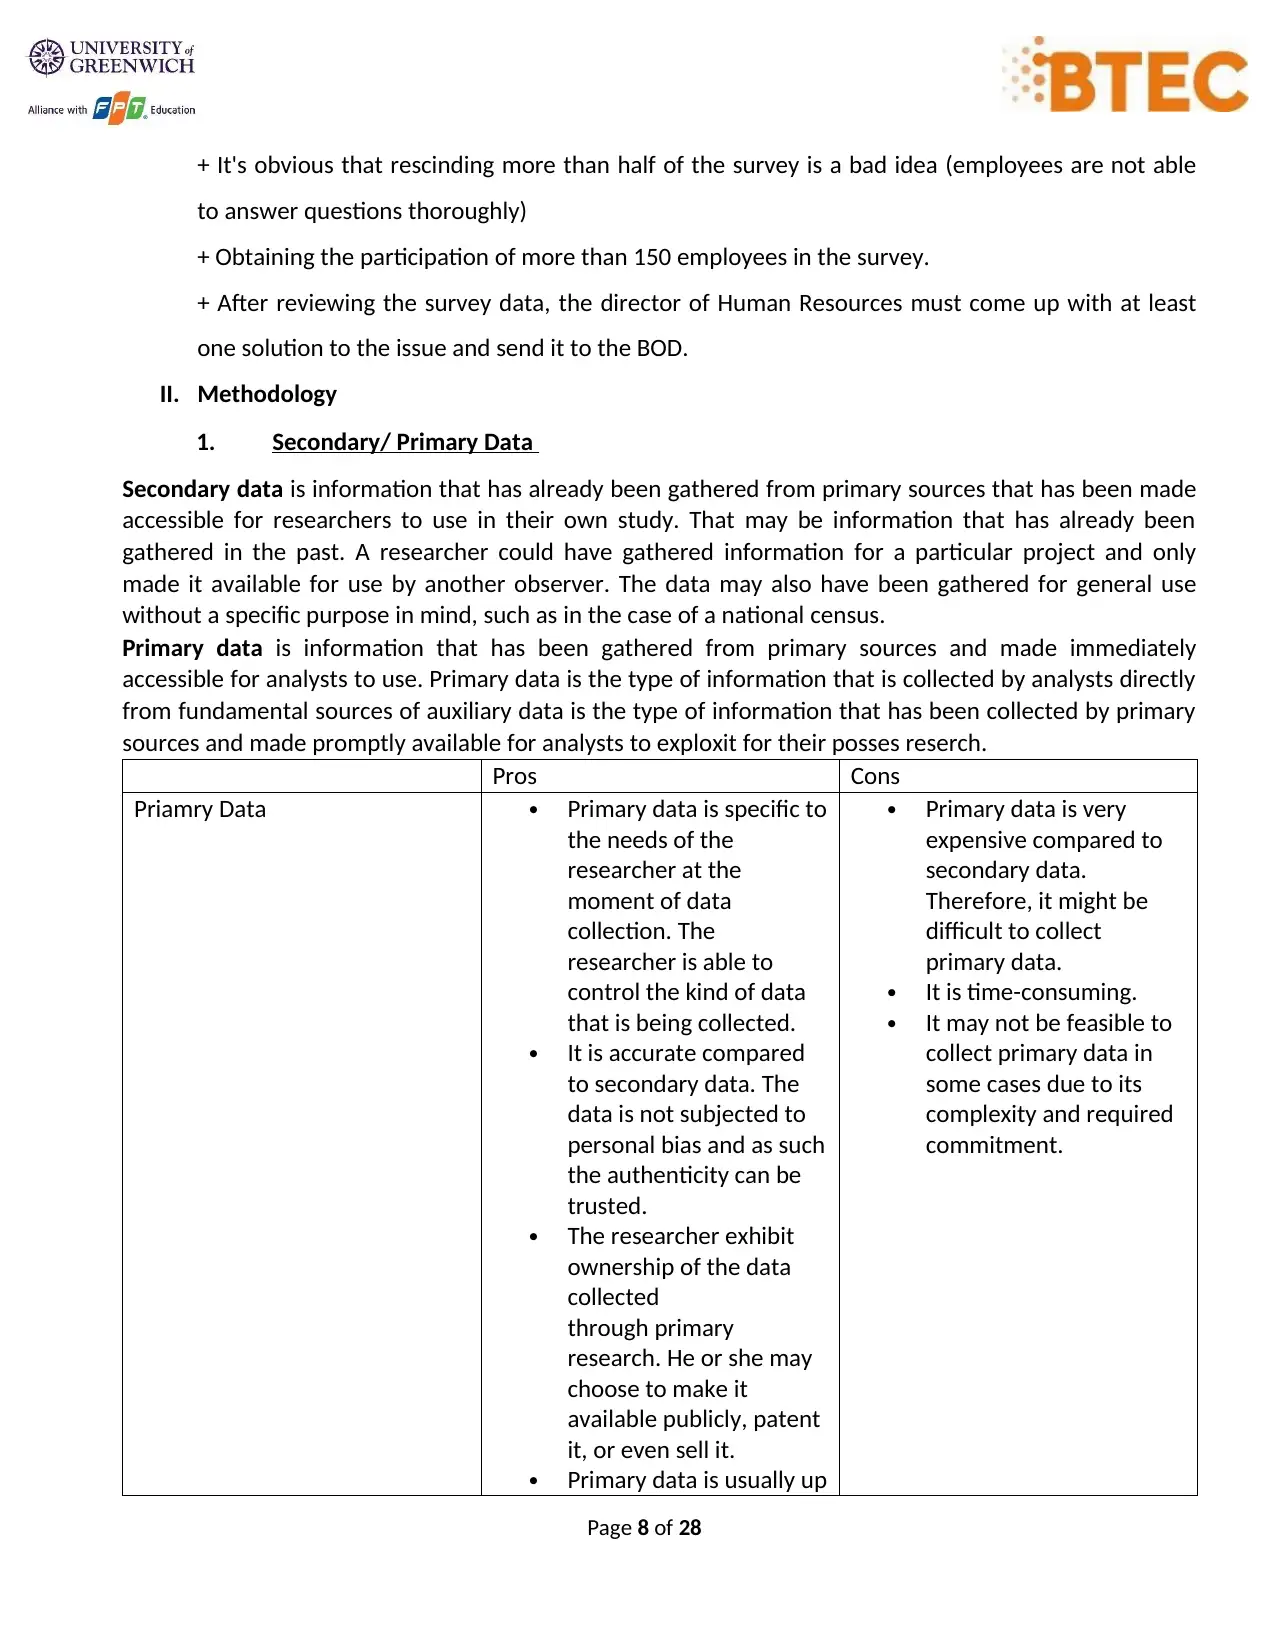
II. Methodology
1. Secondary/ Primary Data
Secondary data is information that has already been gathered from primary sources that has been made
accessible for researchers to use in their own study. That may be information that has already been
gathered in the past. A researcher could have gathered information for a particular project and only
made it available for use by another observer. The data may also have been gathered for general use
without a specific purpose in mind, such as in the case of a national census.
Primary data is information that has been gathered from primary sources and made immediately
accessible for analysts to use. Primary data is the type of information that is collected by analysts directly
from fundamental sources of auxiliary data is the type of information that has been collected by primary
sources and made promptly available for analysts to exploxit for their posses reserch.
Pros Cons
Priamry Data Primary data is specific to
the needs of the
researcher at the
moment of data
collection. The
researcher is able to
control the kind of data
that is being collected.
It is accurate compared
to secondary data. The
data is not subjected to
personal bias and as such
the authenticity can be
trusted.
The researcher exhibit
ownership of the data
collected
through primary
research. He or she may
choose to make it
available publicly, patent
it, or even sell it.
Primary data is usually up
Primary data is very
expensive compared to
secondary data.
Therefore, it might be
difficult to collect
primary data.
It is time-consuming.
It may not be feasible to
collect primary data in
some cases due to its
complexity and required
commitment.
Page 8 of 28
to answer questions thoroughly)
+ Obtaining the participation of more than 150 employees in the survey.
+ After reviewing the survey data, the director of Human Resources must come up with at least
one solution to the issue and send it to the BOD.
II. Methodology
1. Secondary/ Primary Data
Secondary data is information that has already been gathered from primary sources that has been made
accessible for researchers to use in their own study. That may be information that has already been
gathered in the past. A researcher could have gathered information for a particular project and only
made it available for use by another observer. The data may also have been gathered for general use
without a specific purpose in mind, such as in the case of a national census.
Primary data is information that has been gathered from primary sources and made immediately
accessible for analysts to use. Primary data is the type of information that is collected by analysts directly
from fundamental sources of auxiliary data is the type of information that has been collected by primary
sources and made promptly available for analysts to exploxit for their posses reserch.
Pros Cons
Priamry Data Primary data is specific to
the needs of the
researcher at the
moment of data
collection. The
researcher is able to
control the kind of data
that is being collected.
It is accurate compared
to secondary data. The
data is not subjected to
personal bias and as such
the authenticity can be
trusted.
The researcher exhibit
ownership of the data
collected
through primary
research. He or she may
choose to make it
available publicly, patent
it, or even sell it.
Primary data is usually up
Primary data is very
expensive compared to
secondary data.
Therefore, it might be
difficult to collect
primary data.
It is time-consuming.
It may not be feasible to
collect primary data in
some cases due to its
complexity and required
commitment.
Page 8 of 28
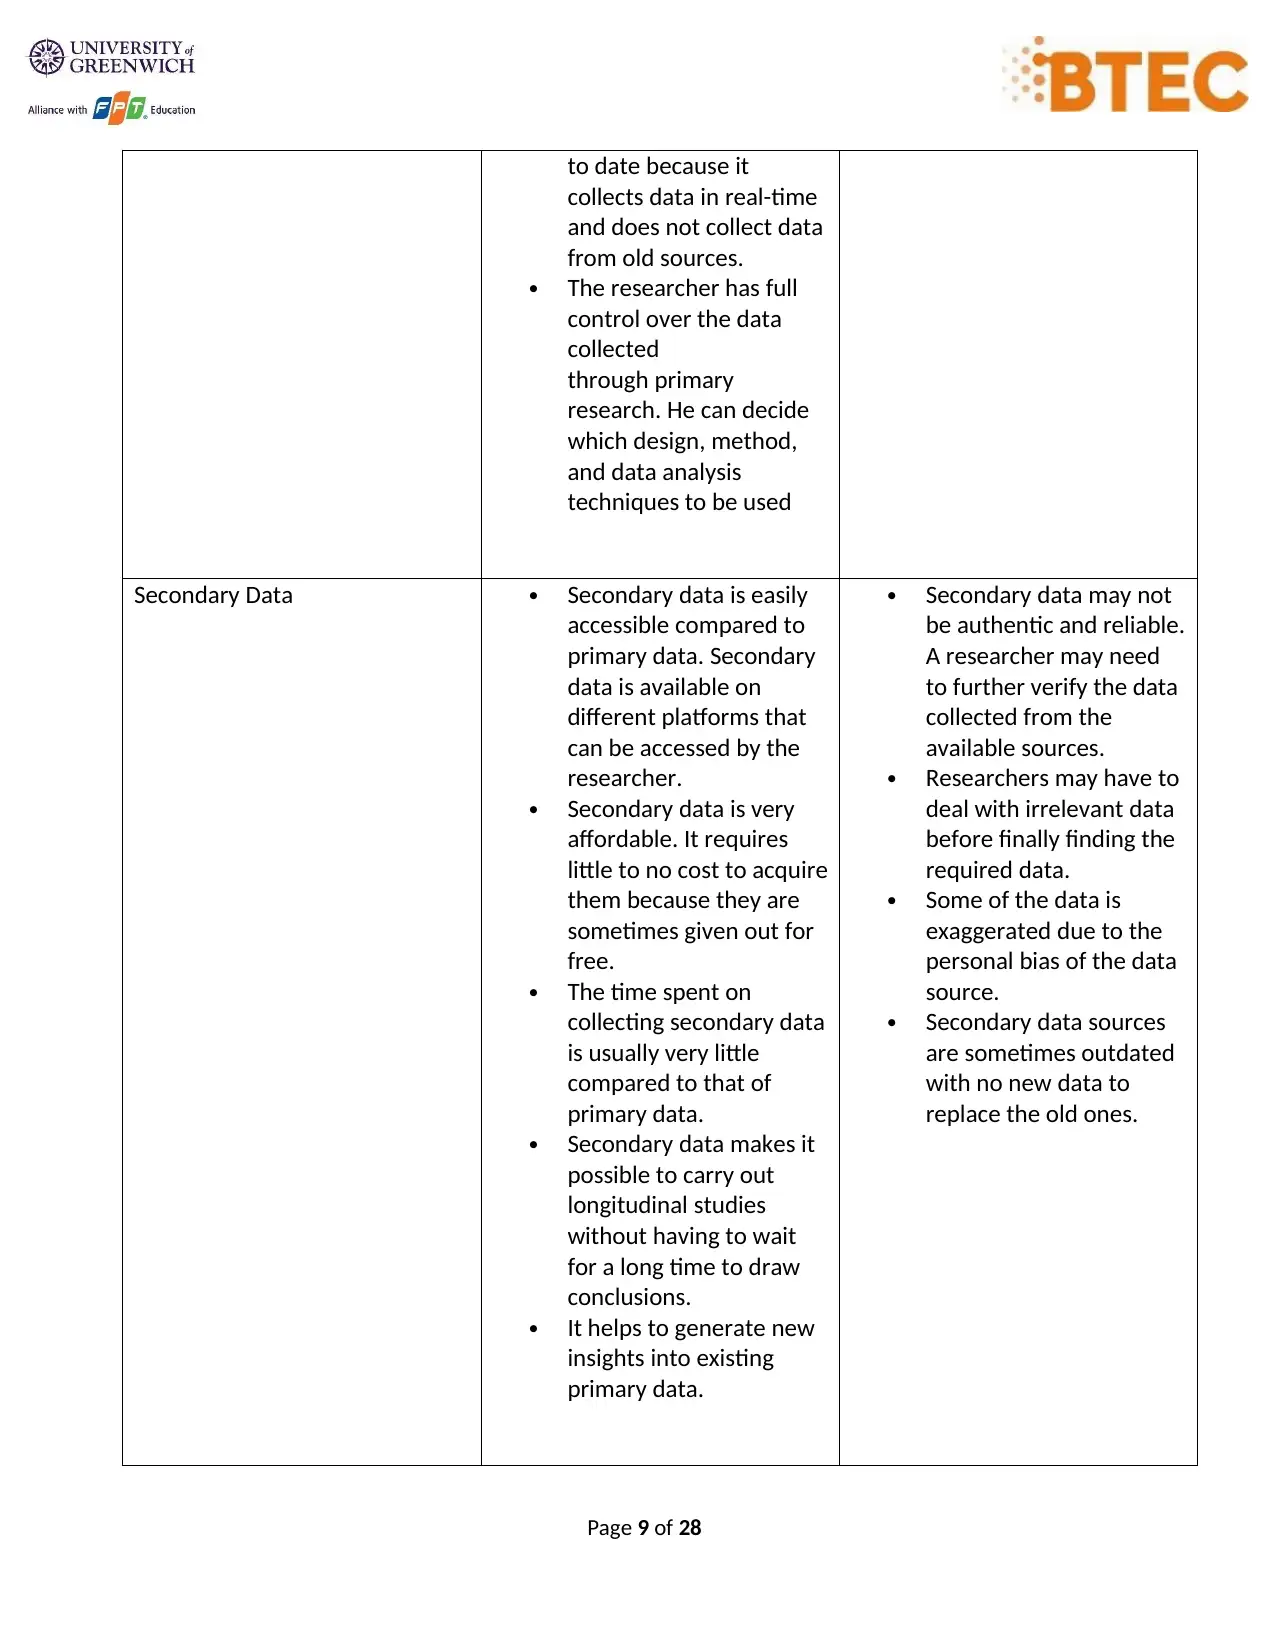
to date because it
collects data in real-time
and does not collect data
from old sources.
The researcher has full
control over the data
collected
through primary
research. He can decide
which design, method,
and data analysis
techniques to be used
Secondary Data Secondary data is easily
accessible compared to
primary data. Secondary
data is available on
different platforms that
can be accessed by the
researcher.
Secondary data is very
affordable. It requires
little to no cost to acquire
them because they are
sometimes given out for
free.
The time spent on
collecting secondary data
is usually very little
compared to that of
primary data.
Secondary data makes it
possible to carry out
longitudinal studies
without having to wait
for a long time to draw
conclusions.
It helps to generate new
insights into existing
primary data.
Secondary data may not
be authentic and reliable.
A researcher may need
to further verify the data
collected from the
available sources.
Researchers may have to
deal with irrelevant data
before finally finding the
required data.
Some of the data is
exaggerated due to the
personal bias of the data
source.
Secondary data sources
are sometimes outdated
with no new data to
replace the old ones.
Page 9 of 28
⊘ This is a preview!⊘
Do you want full access?
Subscribe today to unlock all pages.
Trusted by 1+ million students worldwide
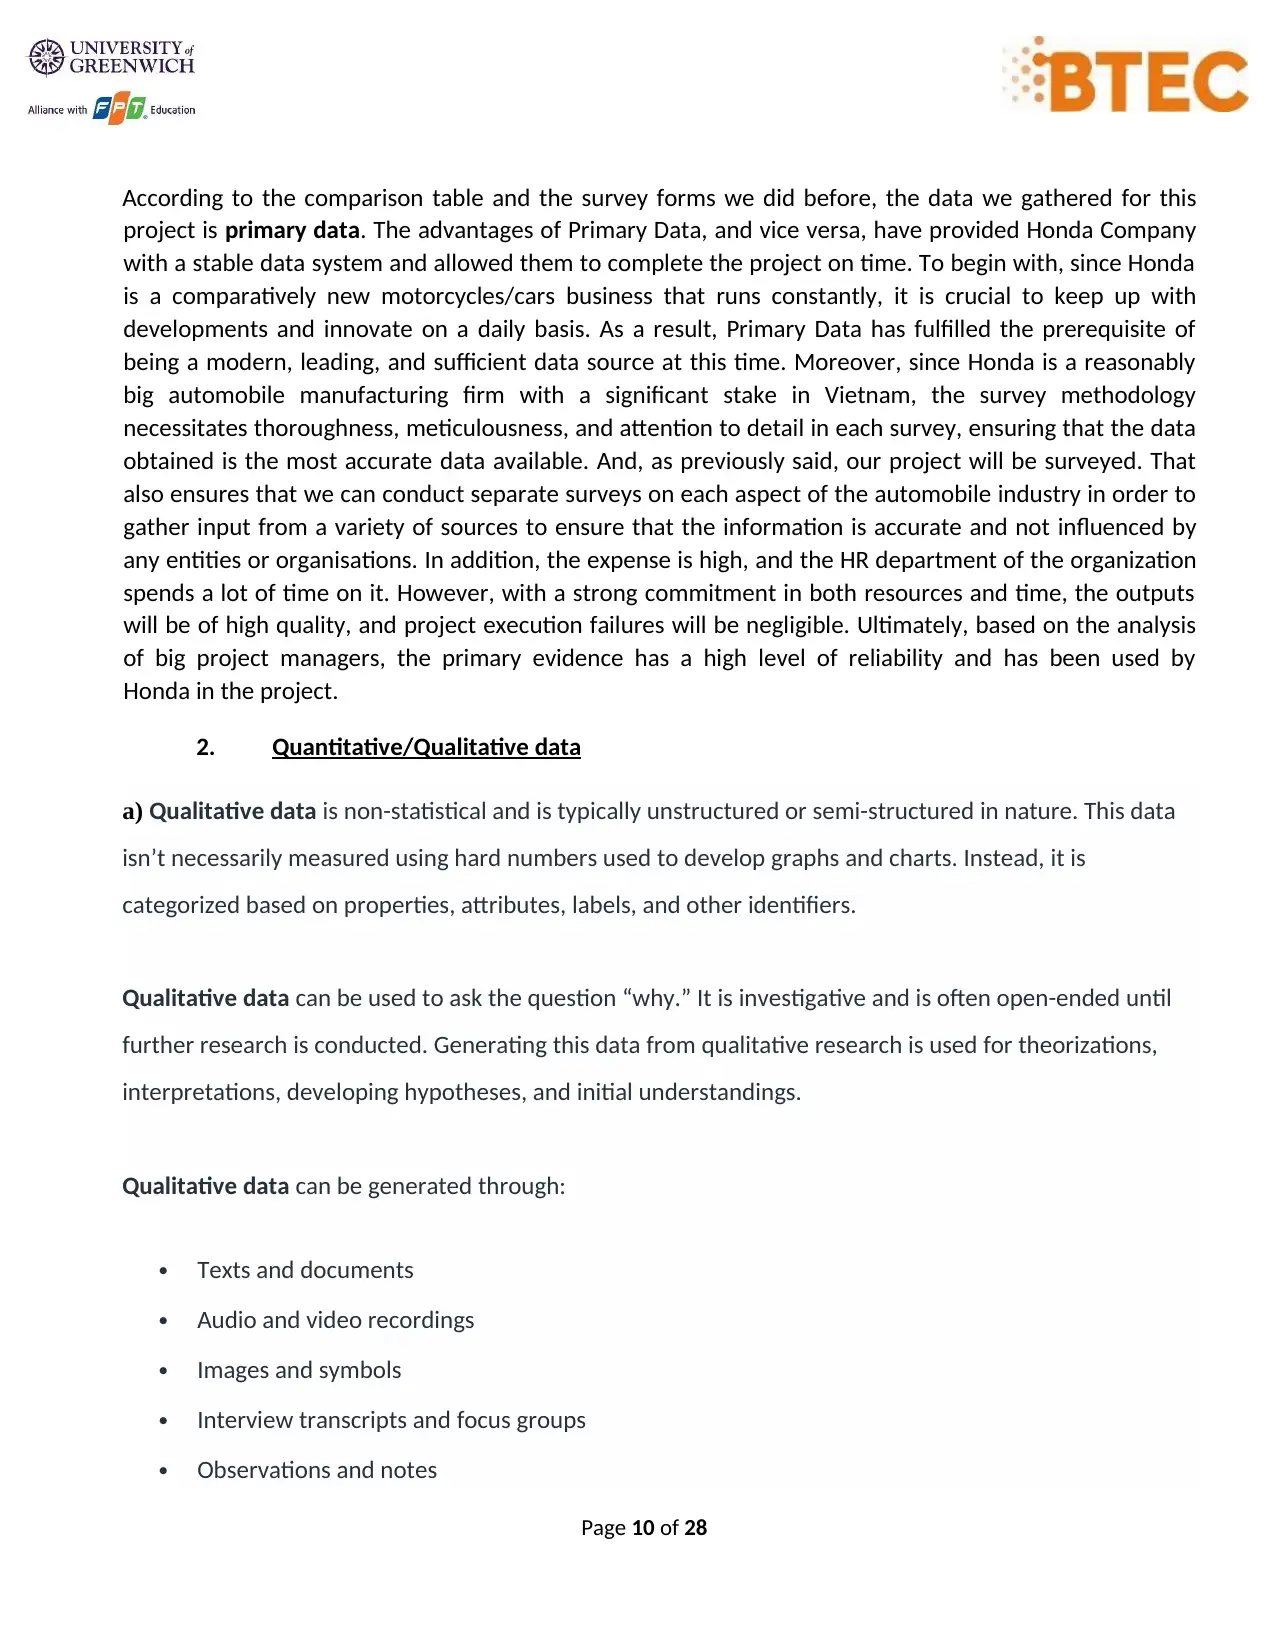
According to the comparison table and the survey forms we did before, the data we gathered for this
project is primary data. The advantages of Primary Data, and vice versa, have provided Honda Company
with a stable data system and allowed them to complete the project on time. To begin with, since Honda
is a comparatively new motorcycles/cars business that runs constantly, it is crucial to keep up with
developments and innovate on a daily basis. As a result, Primary Data has fulfilled the prerequisite of
being a modern, leading, and sufficient data source at this time. Moreover, since Honda is a reasonably
big automobile manufacturing firm with a significant stake in Vietnam, the survey methodology
necessitates thoroughness, meticulousness, and attention to detail in each survey, ensuring that the data
obtained is the most accurate data available. And, as previously said, our project will be surveyed. That
also ensures that we can conduct separate surveys on each aspect of the automobile industry in order to
gather input from a variety of sources to ensure that the information is accurate and not influenced by
any entities or organisations. In addition, the expense is high, and the HR department of the organization
spends a lot of time on it. However, with a strong commitment in both resources and time, the outputs
will be of high quality, and project execution failures will be negligible. Ultimately, based on the analysis
of big project managers, the primary evidence has a high level of reliability and has been used by
Honda in the project.
2. Quantitative/Qualitative data
a) Qualitative data is non-statistical and is typically unstructured or semi-structured in nature. This data
isn’t necessarily measured using hard numbers used to develop graphs and charts. Instead, it is
categorized based on properties, attributes, labels, and other identifiers.
Qualitative data can be used to ask the question “why.” It is investigative and is often open-ended until
further research is conducted. Generating this data from qualitative research is used for theorizations,
interpretations, developing hypotheses, and initial understandings.
Qualitative data can be generated through:
Texts and documents
Audio and video recordings
Images and symbols
Interview transcripts and focus groups
Observations and notes
Page 10 of 28
Paraphrase This Document
Need a fresh take? Get an instant paraphrase of this document with our AI Paraphraser
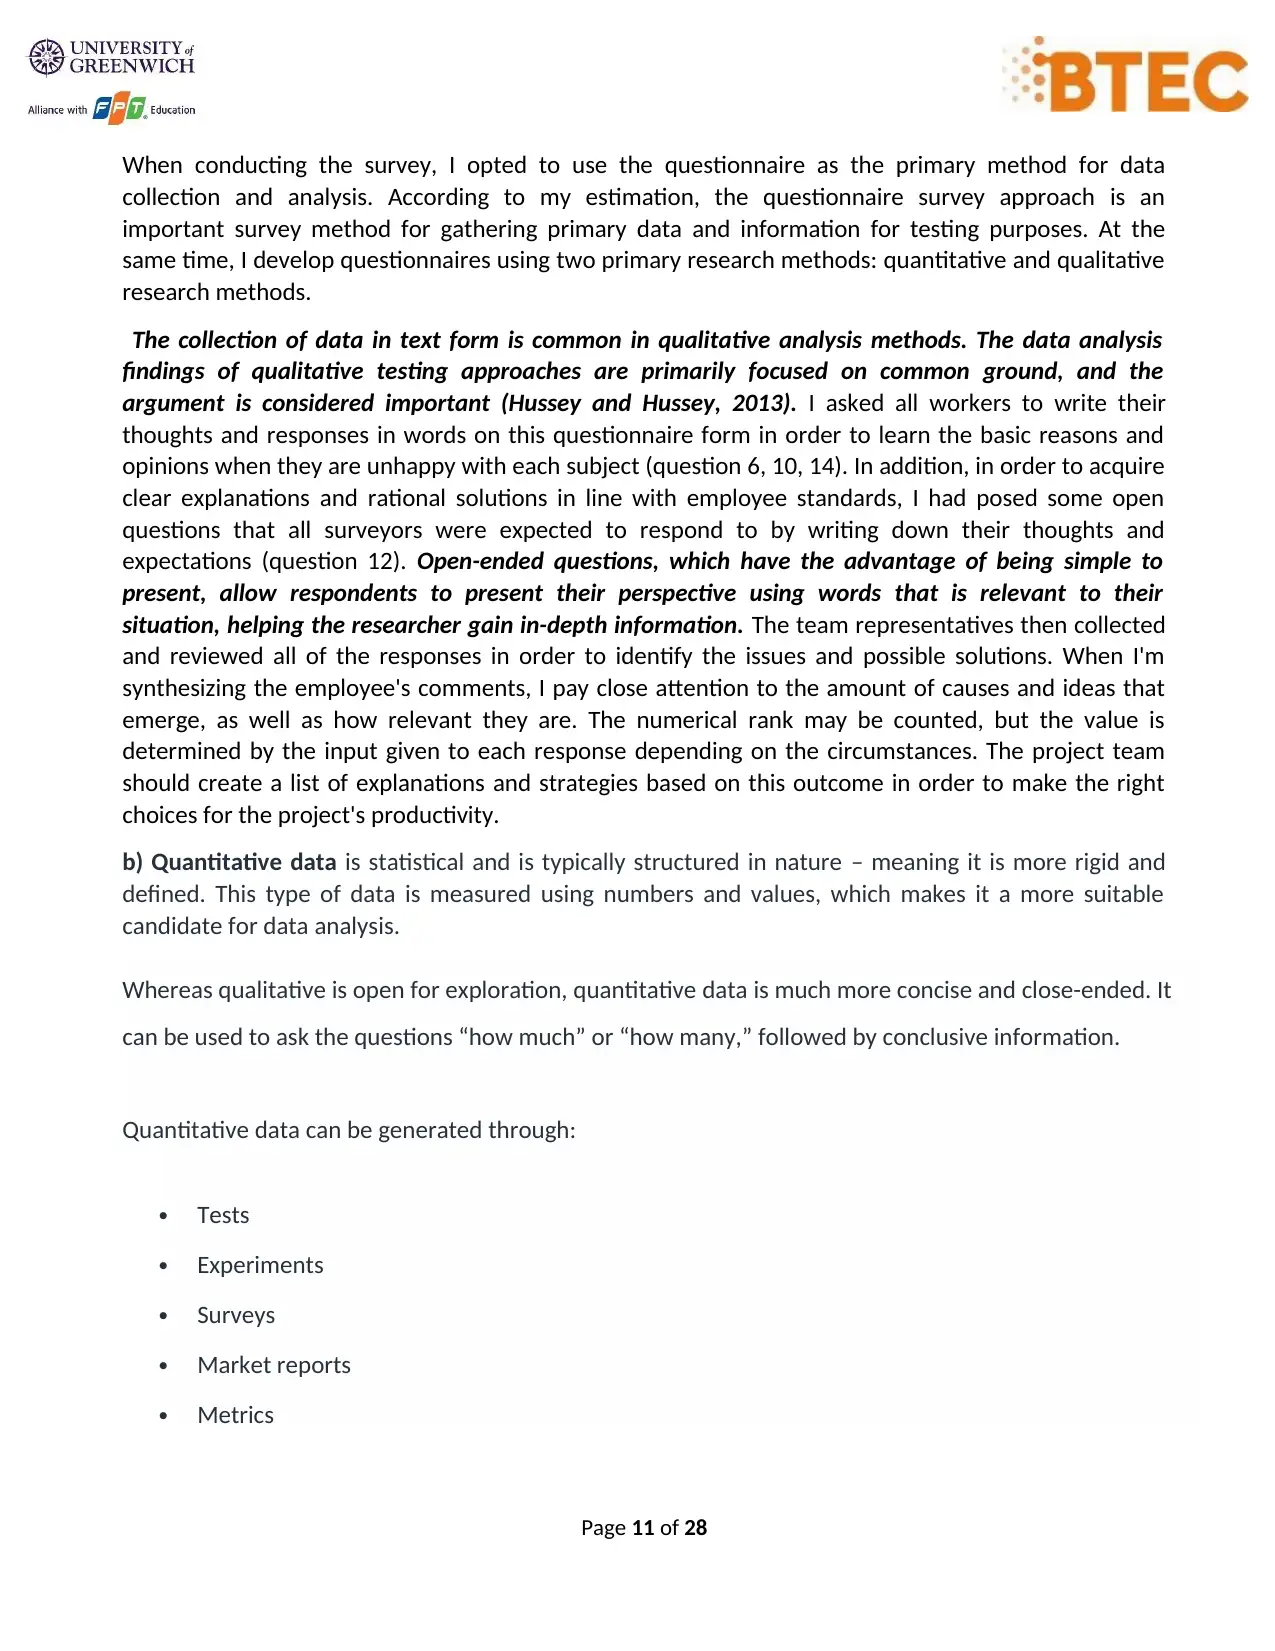
When conducting the survey, I opted to use the questionnaire as the primary method for data
collection and analysis. According to my estimation, the questionnaire survey approach is an
important survey method for gathering primary data and information for testing purposes. At the
same time, I develop questionnaires using two primary research methods: quantitative and qualitative
research methods.
The collection of data in text form is common in qualitative analysis methods. The data analysis
findings of qualitative testing approaches are primarily focused on common ground, and the
argument is considered important (Hussey and Hussey, 2013). I asked all workers to write their
thoughts and responses in words on this questionnaire form in order to learn the basic reasons and
opinions when they are unhappy with each subject (question 6, 10, 14). In addition, in order to acquire
clear explanations and rational solutions in line with employee standards, I had posed some open
questions that all surveyors were expected to respond to by writing down their thoughts and
expectations (question 12). Open-ended questions, which have the advantage of being simple to
present, allow respondents to present their perspective using words that is relevant to their
situation, helping the researcher gain in-depth information. The team representatives then collected
and reviewed all of the responses in order to identify the issues and possible solutions. When I'm
synthesizing the employee's comments, I pay close attention to the amount of causes and ideas that
emerge, as well as how relevant they are. The numerical rank may be counted, but the value is
determined by the input given to each response depending on the circumstances. The project team
should create a list of explanations and strategies based on this outcome in order to make the right
choices for the project's productivity.
b) Quantitative data is statistical and is typically structured in nature – meaning it is more rigid and
defined. This type of data is measured using numbers and values, which makes it a more suitable
candidate for data analysis.
Whereas qualitative is open for exploration, quantitative data is much more concise and close-ended. It
can be used to ask the questions “how much” or “how many,” followed by conclusive information.
Quantitative data can be generated through:
Tests
Experiments
Surveys
Market reports
Metrics
Page 11 of 28
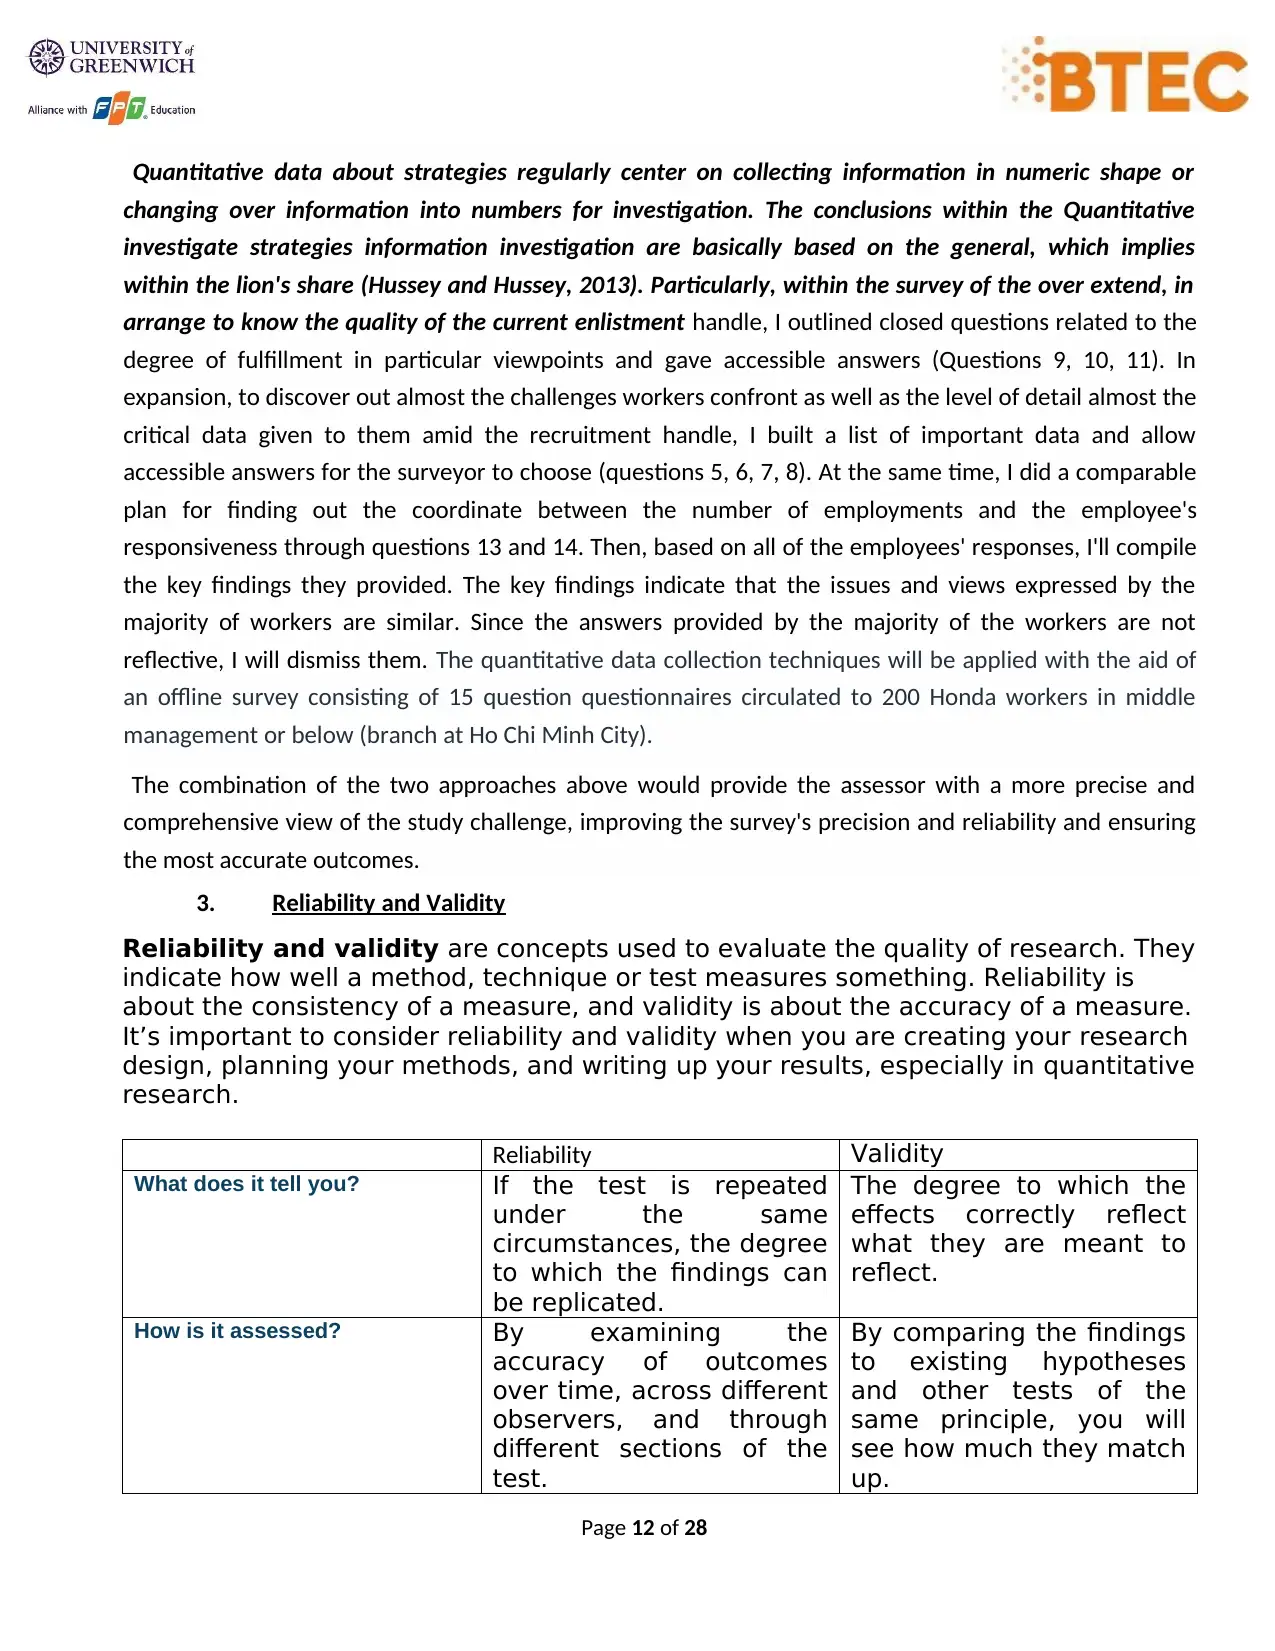
Quantitative data about strategies regularly center on collecting information in numeric shape or
changing over information into numbers for investigation. The conclusions within the Quantitative
investigate strategies information investigation are basically based on the general, which implies
within the lion's share (Hussey and Hussey, 2013). Particularly, within the survey of the over extend, in
arrange to know the quality of the current enlistment handle, I outlined closed questions related to the
degree of fulfillment in particular viewpoints and gave accessible answers (Questions 9, 10, 11). In
expansion, to discover out almost the challenges workers confront as well as the level of detail almost the
critical data given to them amid the recruitment handle, I built a list of important data and allow
accessible answers for the surveyor to choose (questions 5, 6, 7, 8). At the same time, I did a comparable
plan for finding out the coordinate between the number of employments and the employee's
responsiveness through questions 13 and 14. Then, based on all of the employees' responses, I'll compile
the key findings they provided. The key findings indicate that the issues and views expressed by the
majority of workers are similar. Since the answers provided by the majority of the workers are not
reflective, I will dismiss them. The quantitative data collection techniques will be applied with the aid of
an offline survey consisting of 15 question questionnaires circulated to 200 Honda workers in middle
management or below (branch at Ho Chi Minh City).
The combination of the two approaches above would provide the assessor with a more precise and
comprehensive view of the study challenge, improving the survey's precision and reliability and ensuring
the most accurate outcomes.
3. Reliability and Validity
Reliability and validity are concepts used to evaluate the quality of research. They
indicate how well a method, technique or test measures something. Reliability is
about the consistency of a measure, and validity is about the accuracy of a measure.
It’s important to consider reliability and validity when you are creating your research
design, planning your methods, and writing up your results, especially in quantitative
research.
Reliability Validity
What does it tell you? If the test is repeated
under the same
circumstances, the degree
to which the findings can
be replicated.
The degree to which the
effects correctly reflect
what they are meant to
reflect.
How is it assessed? By examining the
accuracy of outcomes
over time, across different
observers, and through
different sections of the
test.
By comparing the findings
to existing hypotheses
and other tests of the
same principle, you will
see how much they match
up.
Page 12 of 28
⊘ This is a preview!⊘
Do you want full access?
Subscribe today to unlock all pages.
Trusted by 1+ million students worldwide
1 out of 28
Related Documents


Your All-in-One AI-Powered Toolkit for Academic Success.
+13062052269
info@desklib.com
Available 24*7 on WhatsApp / Email
![[object Object]](/_next/static/media/star-bottom.7253800d.svg)
Unlock your academic potential
Copyright © 2020–2026 A2Z Services. All Rights Reserved. Developed and managed by ZUCOL.