Financial Management Assignment: BUACC3701, Semester 2, 2018 Analysis
VerifiedAdded on 2023/06/05
|14
|2374
|120
Report
AI Summary
This report presents a comprehensive analysis of a financial management assignment, covering key concepts such as capital structure, flotation costs, and the Capital Asset Pricing Model (CAPM) to determine the cost of equity. The report calculates the weighted average cost of capital (WACC) under different financing scenarios, including debt, preference shares, and equity, and evaluates the impact of these choices. It also explores breakeven points and the effects of funding options on Earnings Per Share (EPS). Furthermore, the report delves into investment decisions, analyzing projects based on Internal Rate of Return (IRR) and marginal investment principles, and addresses behavioral finance concepts like representativeness and probability matching through case studies, providing a complete overview of financial decision-making processes.

BUACC3701 FINANCIAL
MANAGEMENT
ASSIGNMENT
SEMESTER 2, 2018
MANAGEMENT
ASSIGNMENT
SEMESTER 2, 2018
Paraphrase This Document
Need a fresh take? Get an instant paraphrase of this document with our AI Paraphraser

TABLE OF CONTENTS
Question 1..................................................................................................................................3
1..............................................................................................................................................3
2..............................................................................................................................................3
3..............................................................................................................................................3
4..............................................................................................................................................3
5..............................................................................................................................................3
6..............................................................................................................................................3
7..............................................................................................................................................3
8..............................................................................................................................................3
9..............................................................................................................................................3
10............................................................................................................................................3
11............................................................................................................................................3
12............................................................................................................................................3
13............................................................................................................................................3
Question 2..................................................................................................................................4
(i)............................................................................................................................................4
Part A.................................................................................................................................4
Part B..................................................................................................................................4
(ii)...........................................................................................................................................4
Part A.................................................................................................................................4
Part B..................................................................................................................................4
Part C..................................................................................................................................4
Question 3..................................................................................................................................5
Part B......................................................................................................................................5
Part D.....................................................................................................................................5

Part E......................................................................................................................................5
References..................................................................................................................................6
References..................................................................................................................................6
⊘ This is a preview!⊘
Do you want full access?
Subscribe today to unlock all pages.
Trusted by 1+ million students worldwide
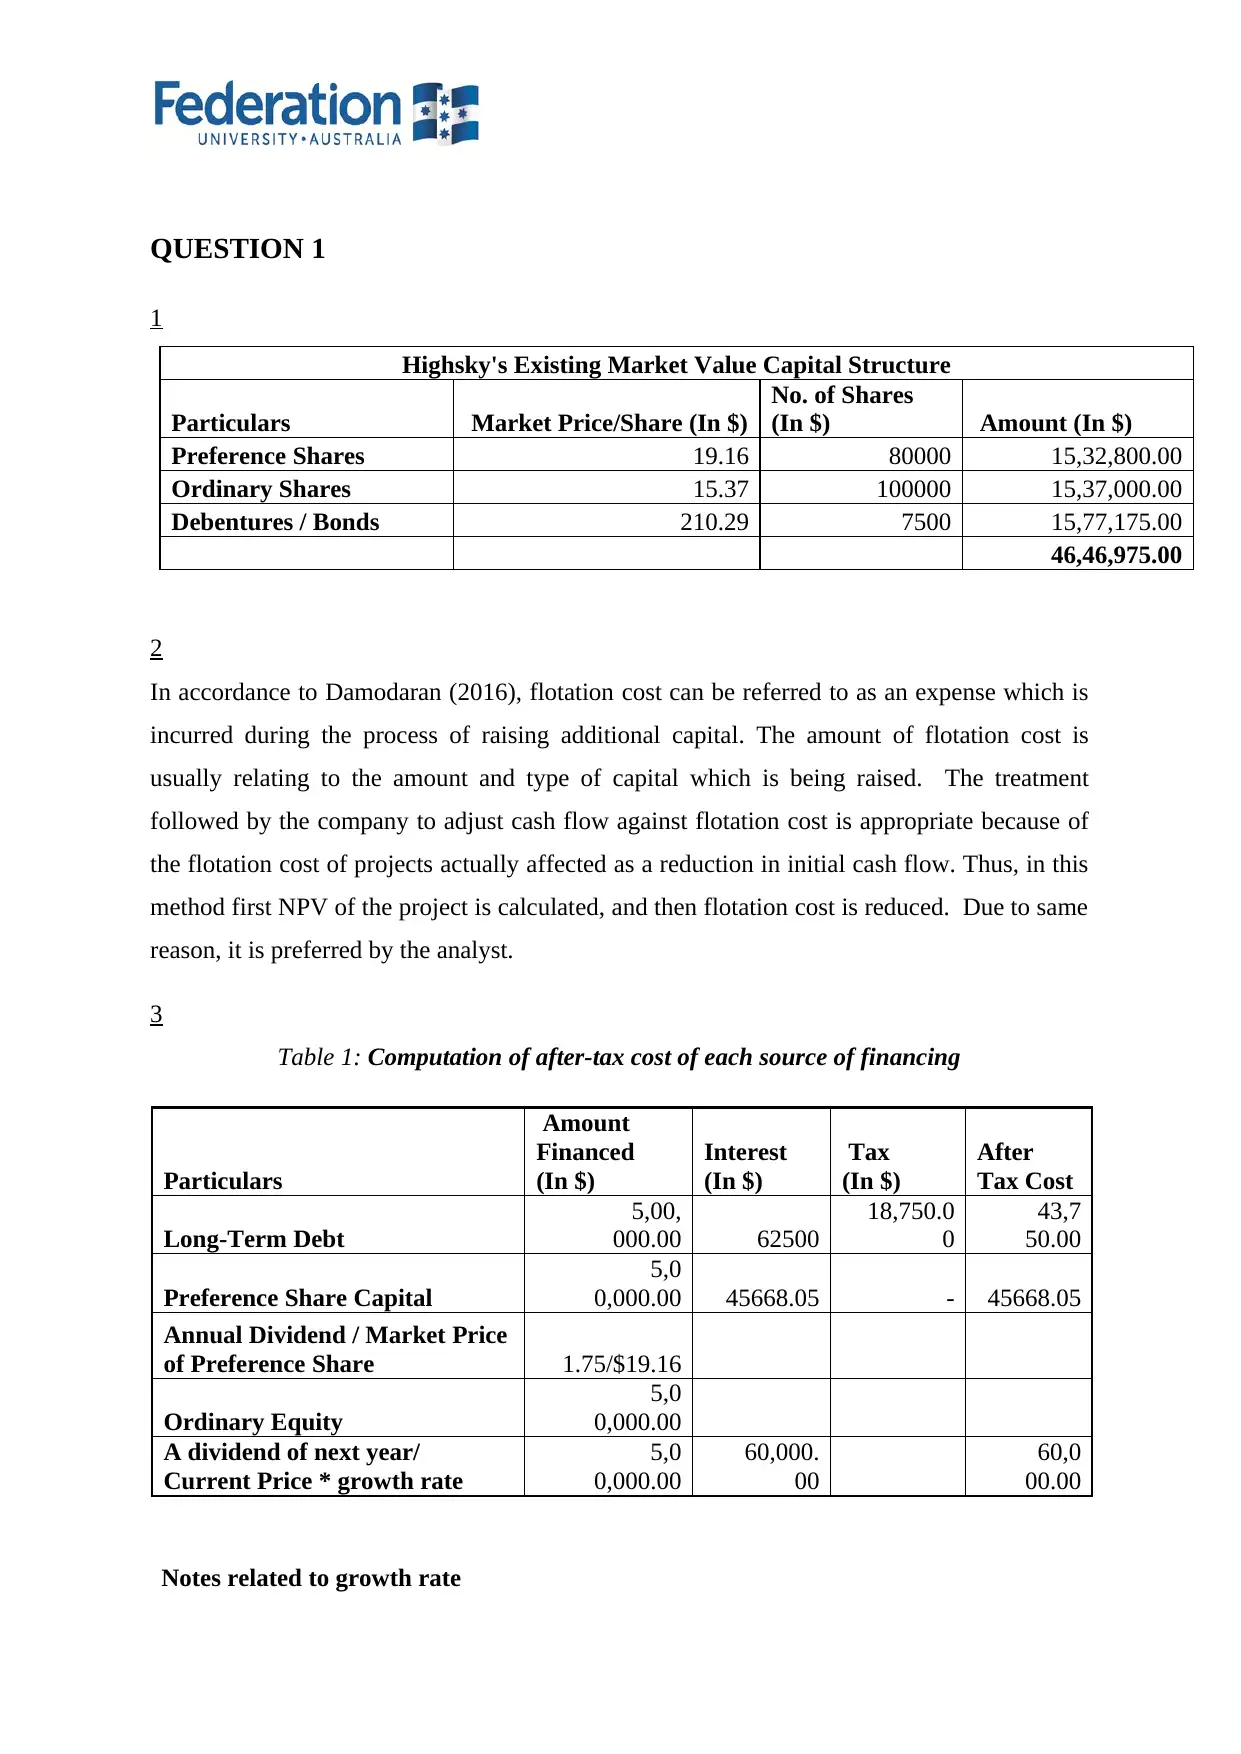
QUESTION 1
1
Highsky's Existing Market Value Capital Structure
Particulars Market Price/Share (In $)
No. of Shares
(In $) Amount (In $)
Preference Shares 19.16 80000 15,32,800.00
Ordinary Shares 15.37 100000 15,37,000.00
Debentures / Bonds 210.29 7500 15,77,175.00
46,46,975.00
2
In accordance to Damodaran (2016), flotation cost can be referred to as an expense which is
incurred during the process of raising additional capital. The amount of flotation cost is
usually relating to the amount and type of capital which is being raised. The treatment
followed by the company to adjust cash flow against flotation cost is appropriate because of
the flotation cost of projects actually affected as a reduction in initial cash flow. Thus, in this
method first NPV of the project is calculated, and then flotation cost is reduced. Due to same
reason, it is preferred by the analyst.
3
Table 1: Computation of after-tax cost of each source of financing
Particulars
Amount
Financed
(In $)
Interest
(In $)
Tax
(In $)
After
Tax Cost
Long-Term Debt
5,00,
000.00 62500
18,750.0
0
43,7
50.00
Preference Share Capital
5,0
0,000.00 45668.05 - 45668.05
Annual Dividend / Market Price
of Preference Share 1.75/$19.16
Ordinary Equity
5,0
0,000.00
A dividend of next year/
Current Price * growth rate
5,0
0,000.00
60,000.
00
60,0
00.00
Notes related to growth rate
Paraphrase This Document
Need a fresh take? Get an instant paraphrase of this document with our AI Paraphraser
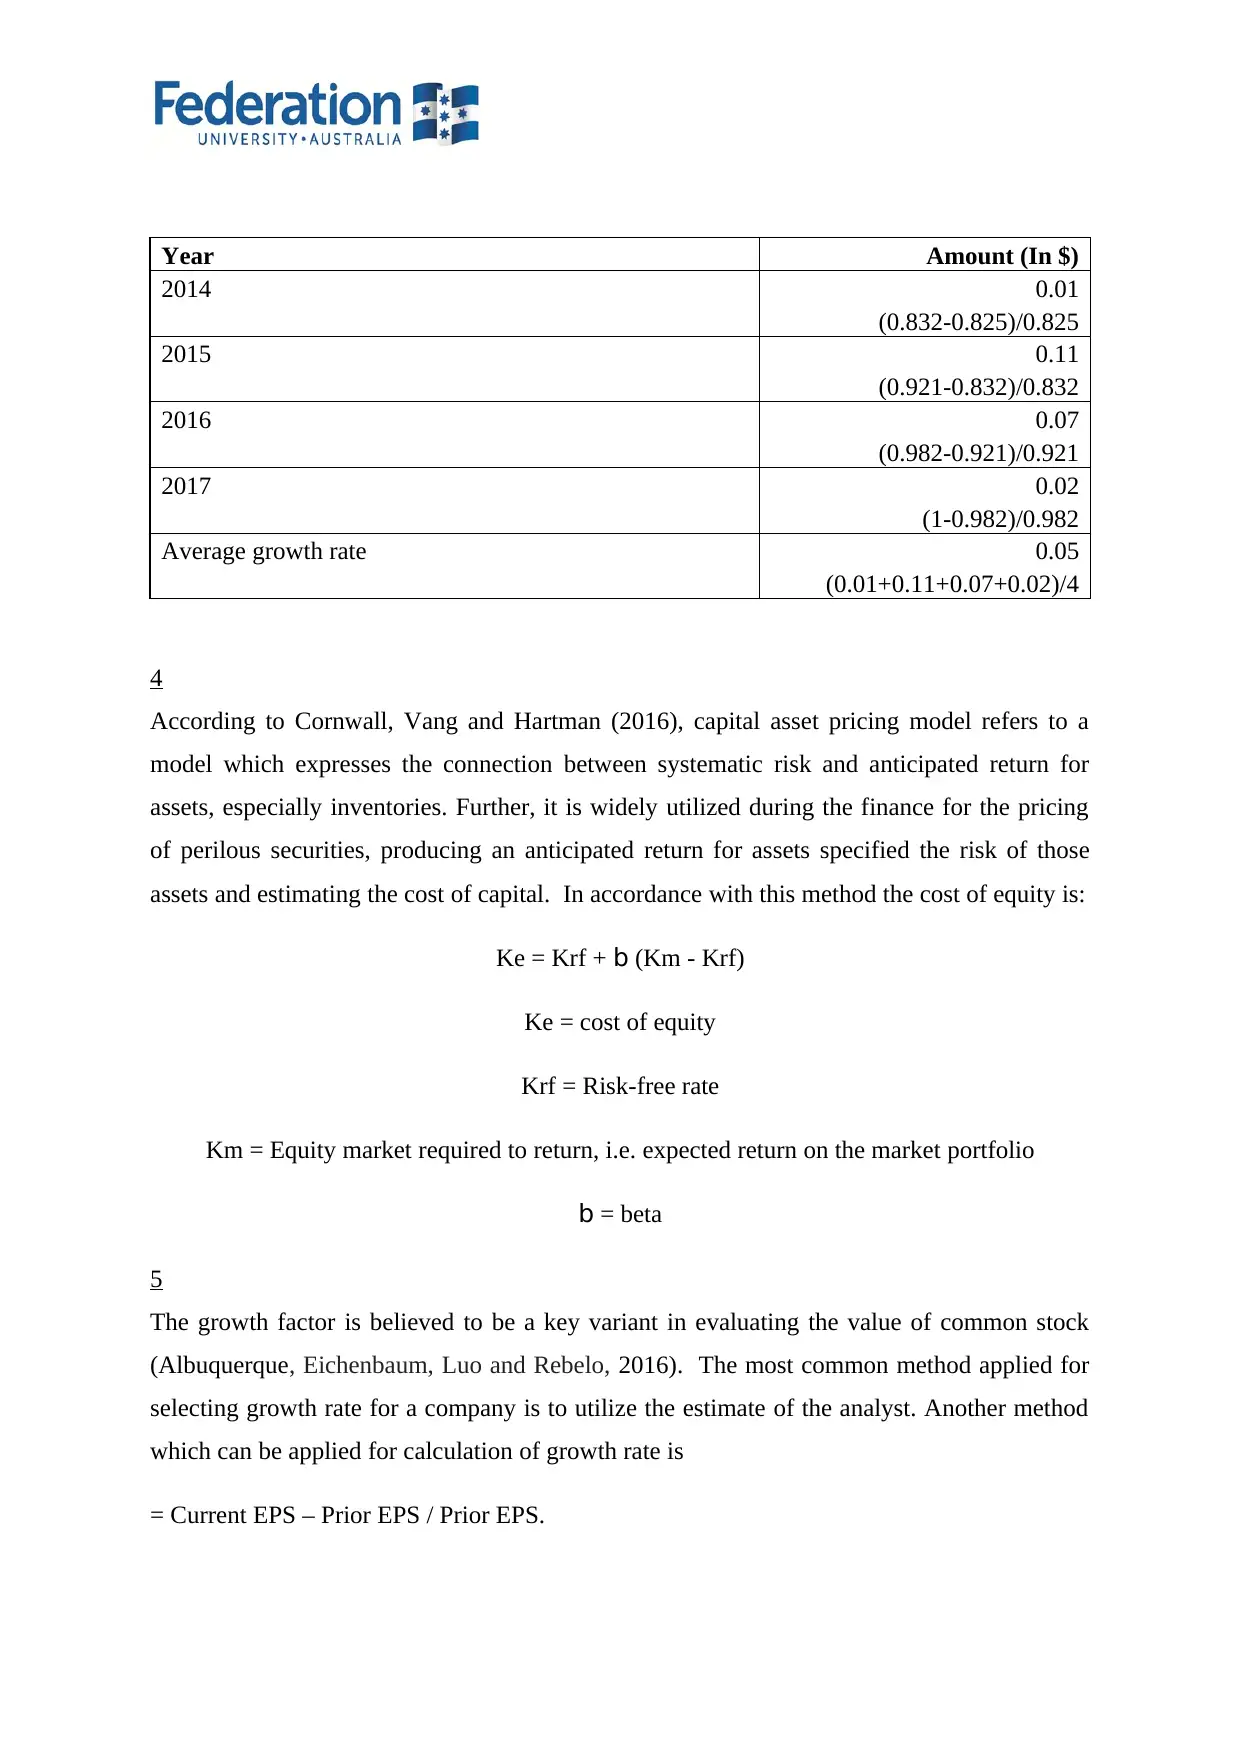
Year Amount (In $)
2014 0.01
(0.832-0.825)/0.825
2015 0.11
(0.921-0.832)/0.832
2016 0.07
(0.982-0.921)/0.921
2017 0.02
(1-0.982)/0.982
Average growth rate 0.05
(0.01+0.11+0.07+0.02)/4
4
According to Cornwall, Vang and Hartman (2016), capital asset pricing model refers to a
model which expresses the connection between systematic risk and anticipated return for
assets, especially inventories. Further, it is widely utilized during the finance for the pricing
of perilous securities, producing an anticipated return for assets specified the risk of those
assets and estimating the cost of capital. In accordance with this method the cost of equity is:
Ke = Krf + b (Km - Krf)
Ke = cost of equity
Krf = Risk-free rate
Km = Equity market required to return, i.e. expected return on the market portfolio
b = beta
5
The growth factor is believed to be a key variant in evaluating the value of common stock
(Albuquerque, Eichenbaum, Luo and Rebelo, 2016). The most common method applied for
selecting growth rate for a company is to utilize the estimate of the analyst. Another method
which can be applied for calculation of growth rate is
= Current EPS – Prior EPS / Prior EPS.
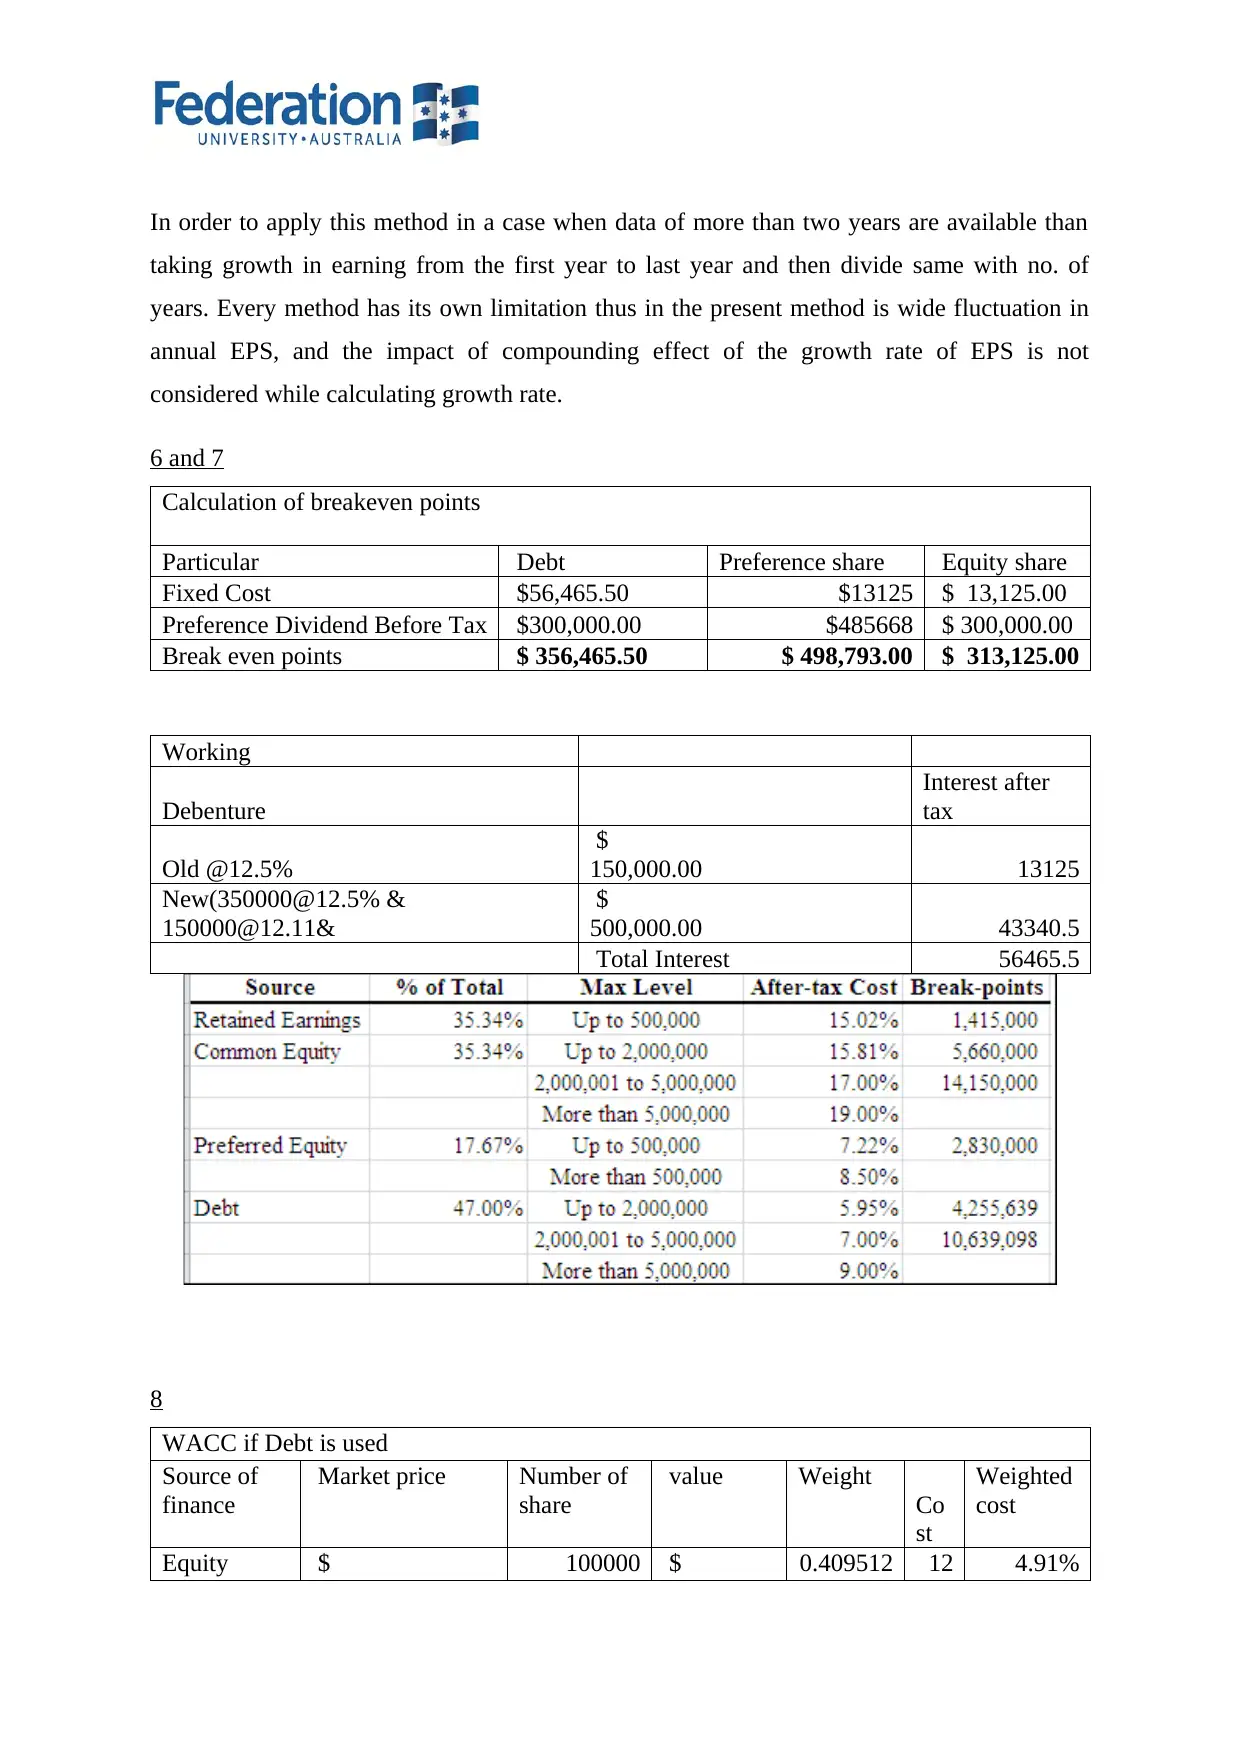
In order to apply this method in a case when data of more than two years are available than
taking growth in earning from the first year to last year and then divide same with no. of
years. Every method has its own limitation thus in the present method is wide fluctuation in
annual EPS, and the impact of compounding effect of the growth rate of EPS is not
considered while calculating growth rate.
6 and 7
Calculation of breakeven points
Particular Debt Preference share Equity share
Fixed Cost $56,465.50 $13125 $ 13,125.00
Preference Dividend Before Tax $300,000.00 $485668 $ 300,000.00
Break even points $ 356,465.50 $ 498,793.00 $ 313,125.00
Working
Debenture
Interest after
tax
Old @12.5%
$
150,000.00 13125
New(350000@12.5% &
150000@12.11&
$
500,000.00 43340.5
Total Interest 56465.5
8
WACC if Debt is used
Source of
finance
Market price Number of
share
value Weight
Co
st
Weighted
cost
Equity $ 100000 $ 0.409512 12 4.91%
⊘ This is a preview!⊘
Do you want full access?
Subscribe today to unlock all pages.
Trusted by 1+ million students worldwide
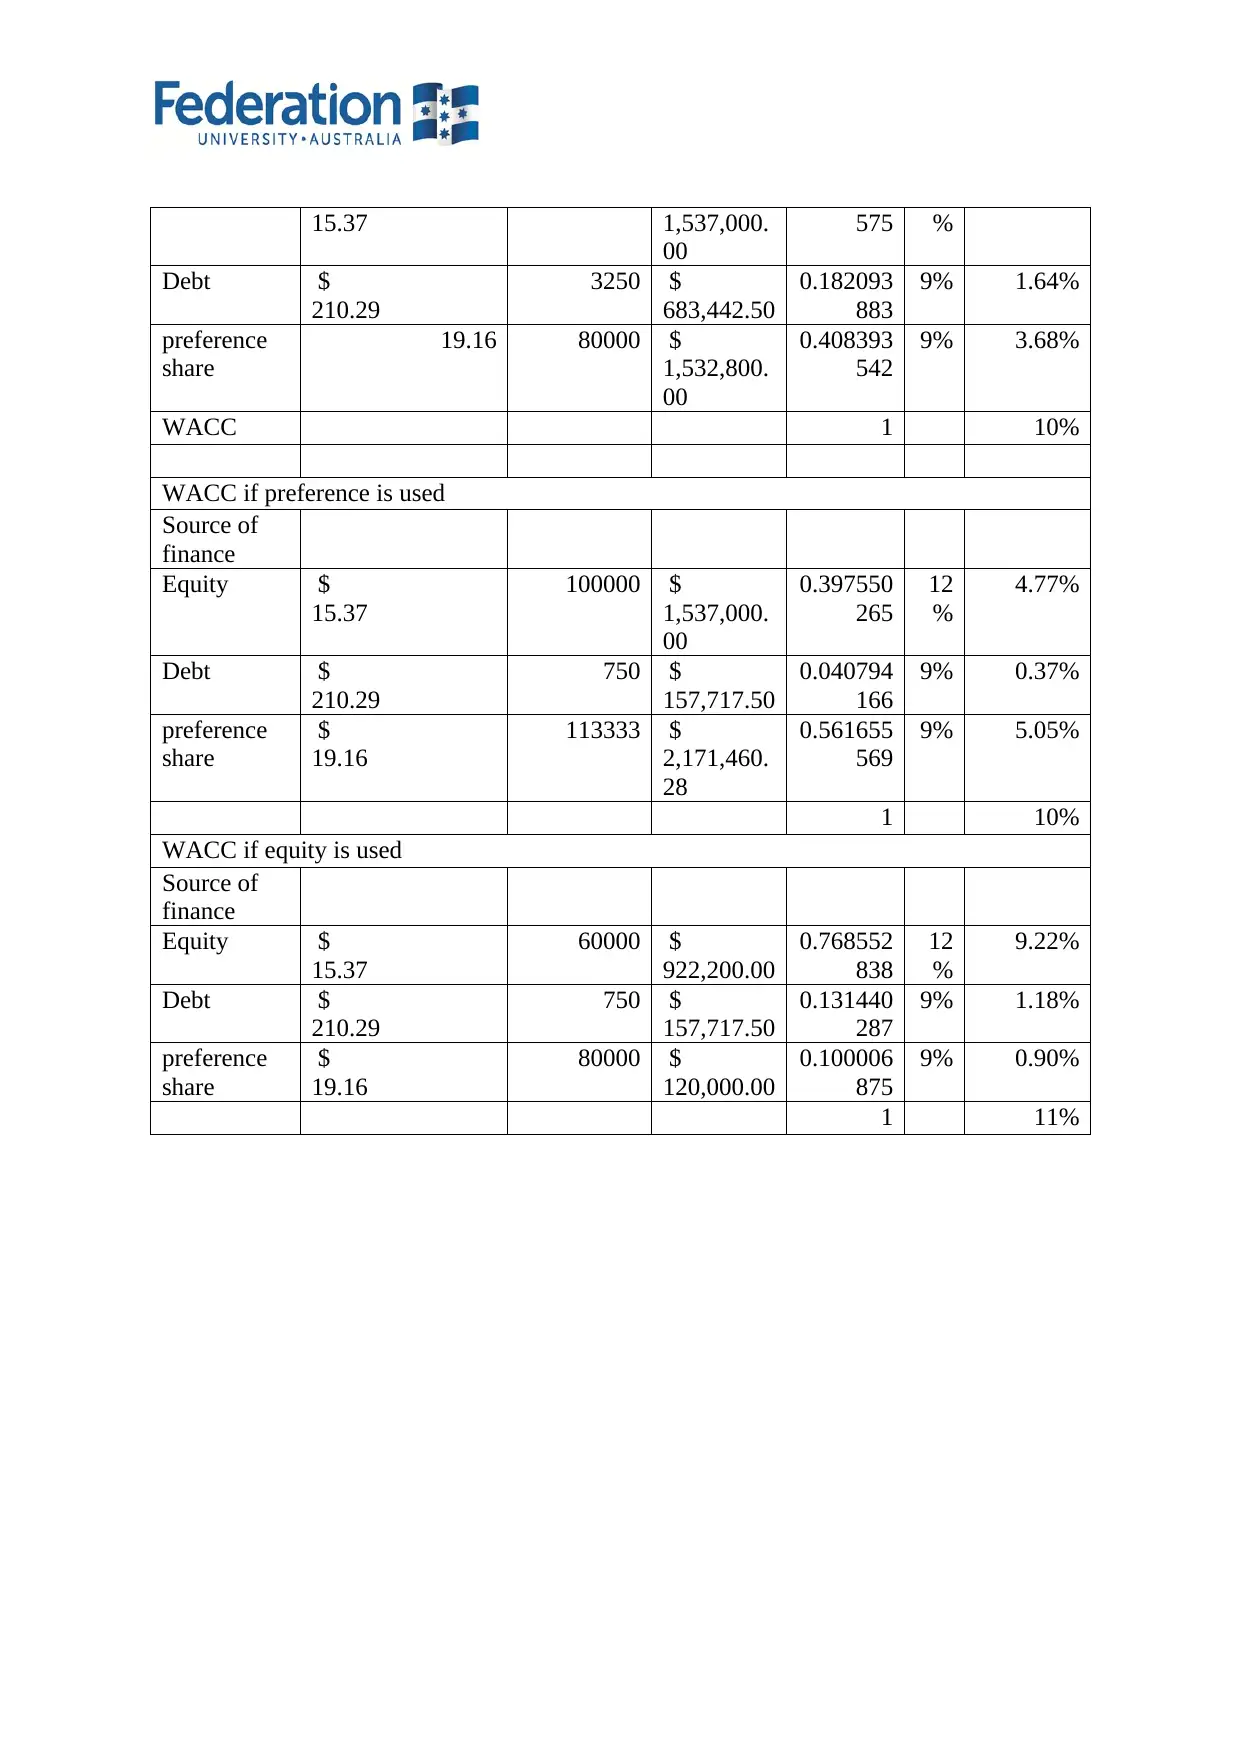
15.37 1,537,000.
00
575 %
Debt $
210.29
3250 $
683,442.50
0.182093
883
9% 1.64%
preference
share
19.16 80000 $
1,532,800.
00
0.408393
542
9% 3.68%
WACC 1 10%
WACC if preference is used
Source of
finance
Equity $
15.37
100000 $
1,537,000.
00
0.397550
265
12
%
4.77%
Debt $
210.29
750 $
157,717.50
0.040794
166
9% 0.37%
preference
share
$
19.16
113333 $
2,171,460.
28
0.561655
569
9% 5.05%
1 10%
WACC if equity is used
Source of
finance
Equity $
15.37
60000 $
922,200.00
0.768552
838
12
%
9.22%
Debt $
210.29
750 $
157,717.50
0.131440
287
9% 1.18%
preference
share
$
19.16
80000 $
120,000.00
0.100006
875
9% 0.90%
1 11%
00
575 %
Debt $
210.29
3250 $
683,442.50
0.182093
883
9% 1.64%
preference
share
19.16 80000 $
1,532,800.
00
0.408393
542
9% 3.68%
WACC 1 10%
WACC if preference is used
Source of
finance
Equity $
15.37
100000 $
1,537,000.
00
0.397550
265
12
%
4.77%
Debt $
210.29
750 $
157,717.50
0.040794
166
9% 0.37%
preference
share
$
19.16
113333 $
2,171,460.
28
0.561655
569
9% 5.05%
1 10%
WACC if equity is used
Source of
finance
Equity $
15.37
60000 $
922,200.00
0.768552
838
12
%
9.22%
Debt $
210.29
750 $
157,717.50
0.131440
287
9% 1.18%
preference
share
$
19.16
80000 $
120,000.00
0.100006
875
9% 0.90%
1 11%
Paraphrase This Document
Need a fresh take? Get an instant paraphrase of this document with our AI Paraphraser
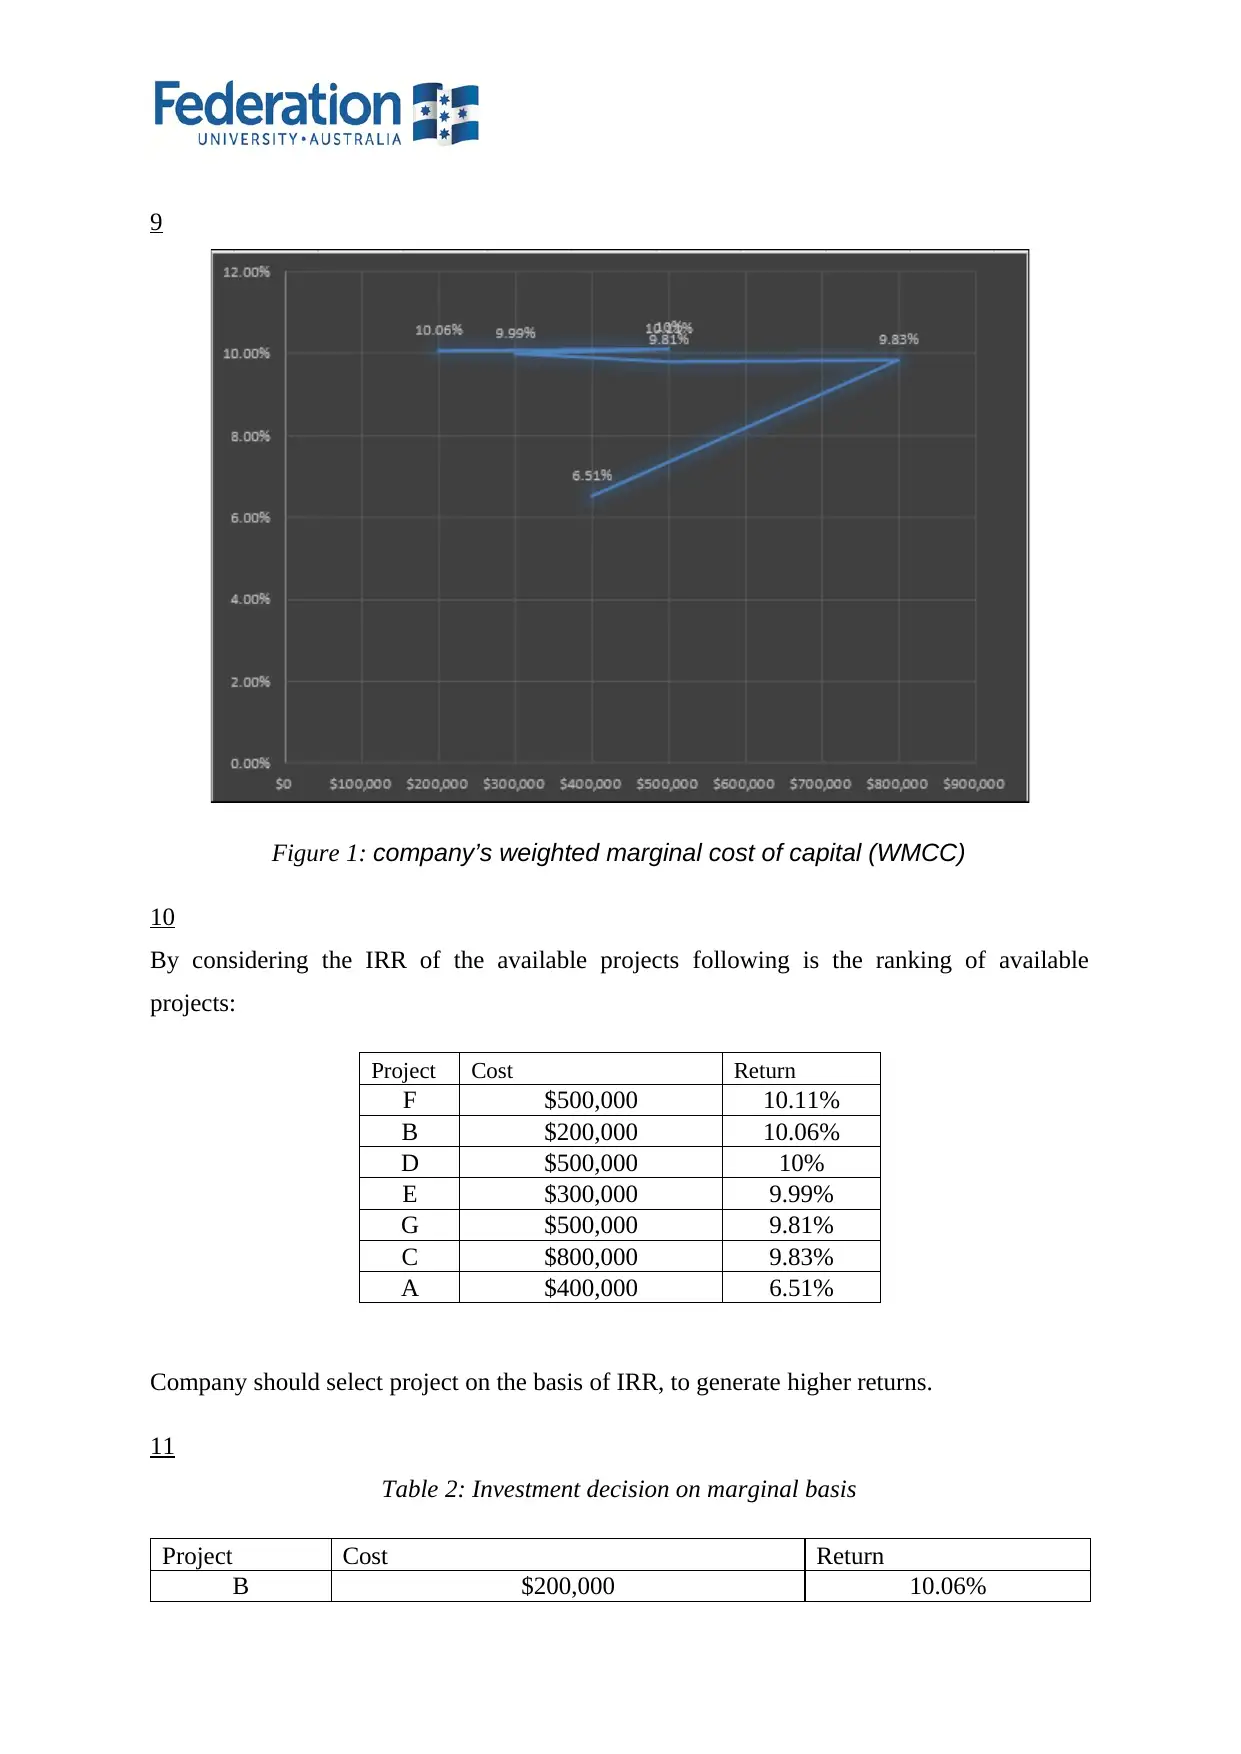
9
Figure 1: company’s weighted marginal cost of capital (WMCC)
10
By considering the IRR of the available projects following is the ranking of available
projects:
Project Cost Return
F $500,000 10.11%
B $200,000 10.06%
D $500,000 10%
E $300,000 9.99%
G $500,000 9.81%
C $800,000 9.83%
A $400,000 6.51%
Company should select project on the basis of IRR, to generate higher returns.
11
Table 2: Investment decision on marginal basis
Project Cost Return
B $200,000 10.06%
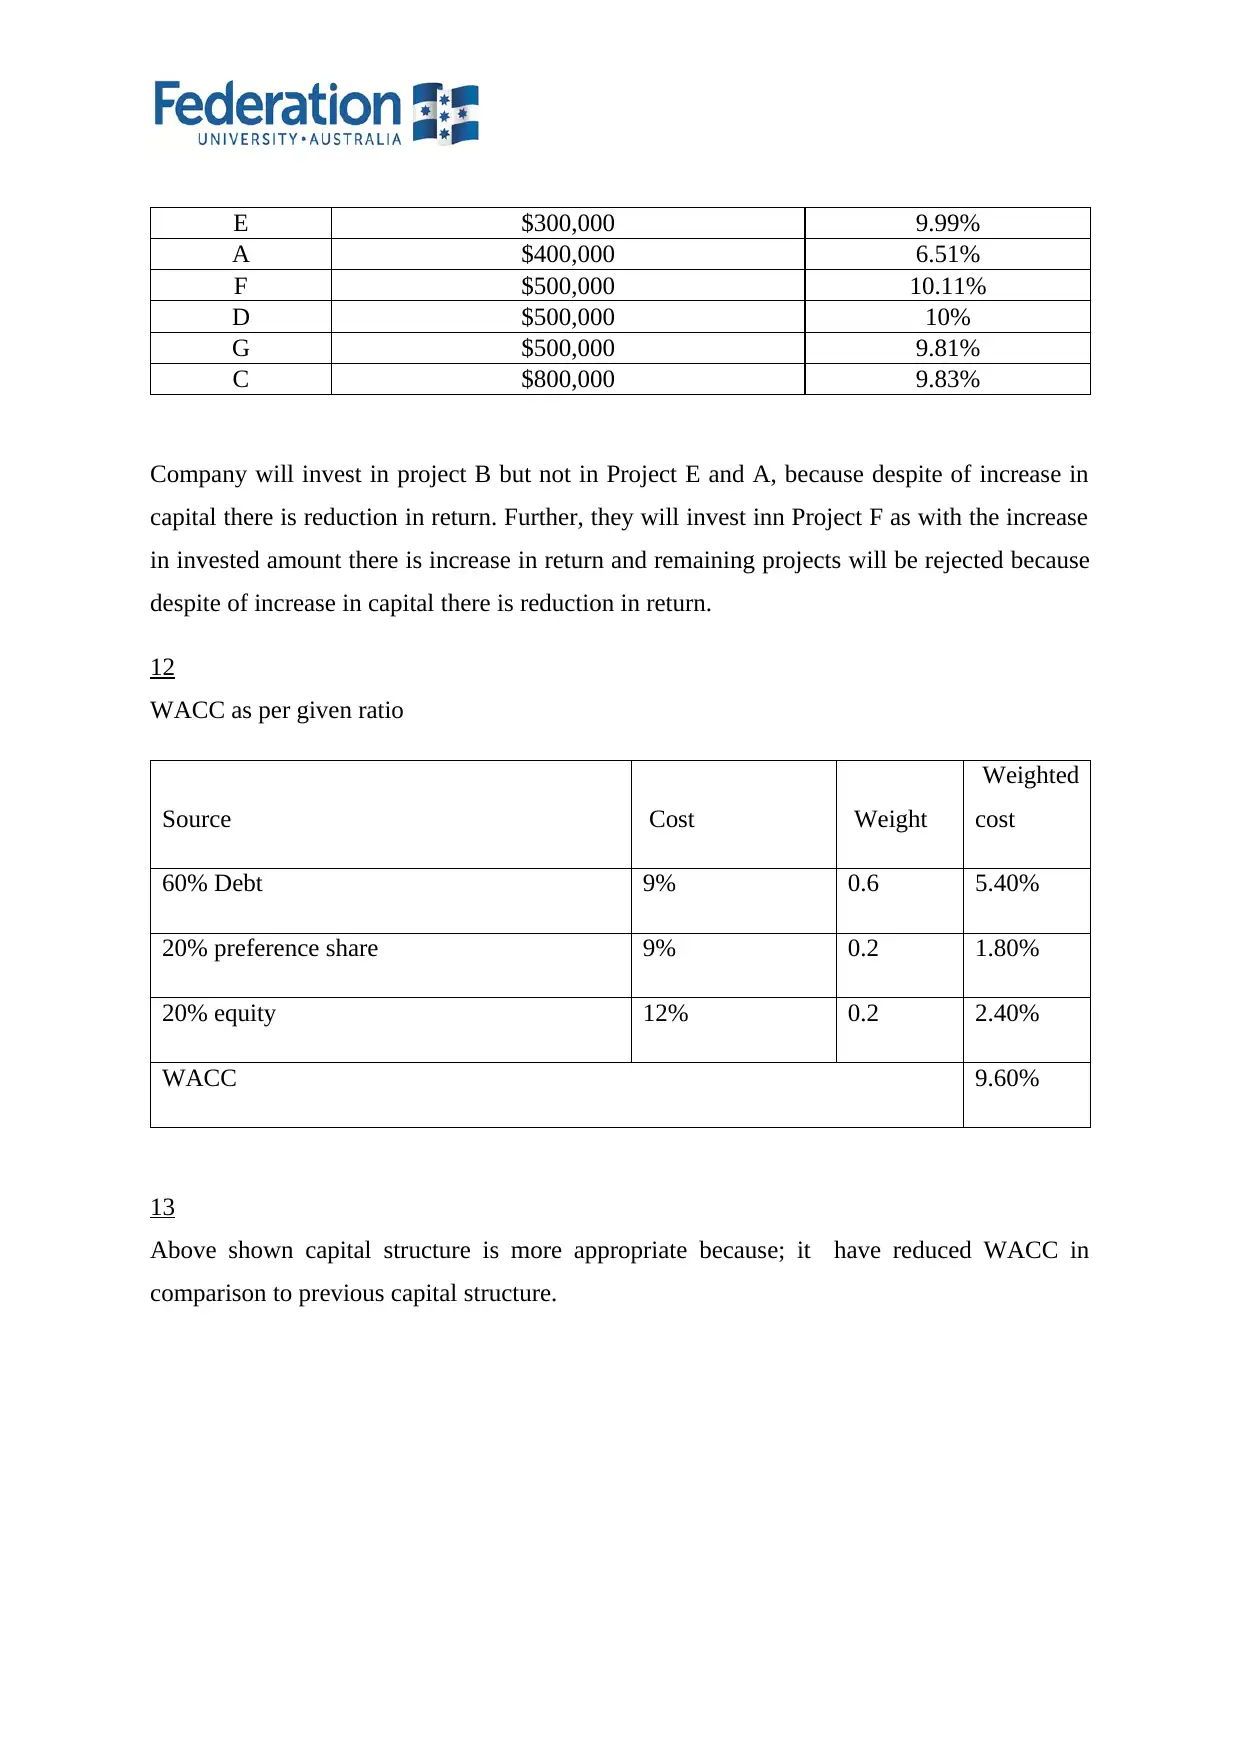
E $300,000 9.99%
A $400,000 6.51%
F $500,000 10.11%
D $500,000 10%
G $500,000 9.81%
C $800,000 9.83%
Company will invest in project B but not in Project E and A, because despite of increase in
capital there is reduction in return. Further, they will invest inn Project F as with the increase
in invested amount there is increase in return and remaining projects will be rejected because
despite of increase in capital there is reduction in return.
12
WACC as per given ratio
Source Cost Weight
Weighted
cost
60% Debt 9% 0.6 5.40%
20% preference share 9% 0.2 1.80%
20% equity 12% 0.2 2.40%
WACC 9.60%
13
Above shown capital structure is more appropriate because; it have reduced WACC in
comparison to previous capital structure.
⊘ This is a preview!⊘
Do you want full access?
Subscribe today to unlock all pages.
Trusted by 1+ million students worldwide
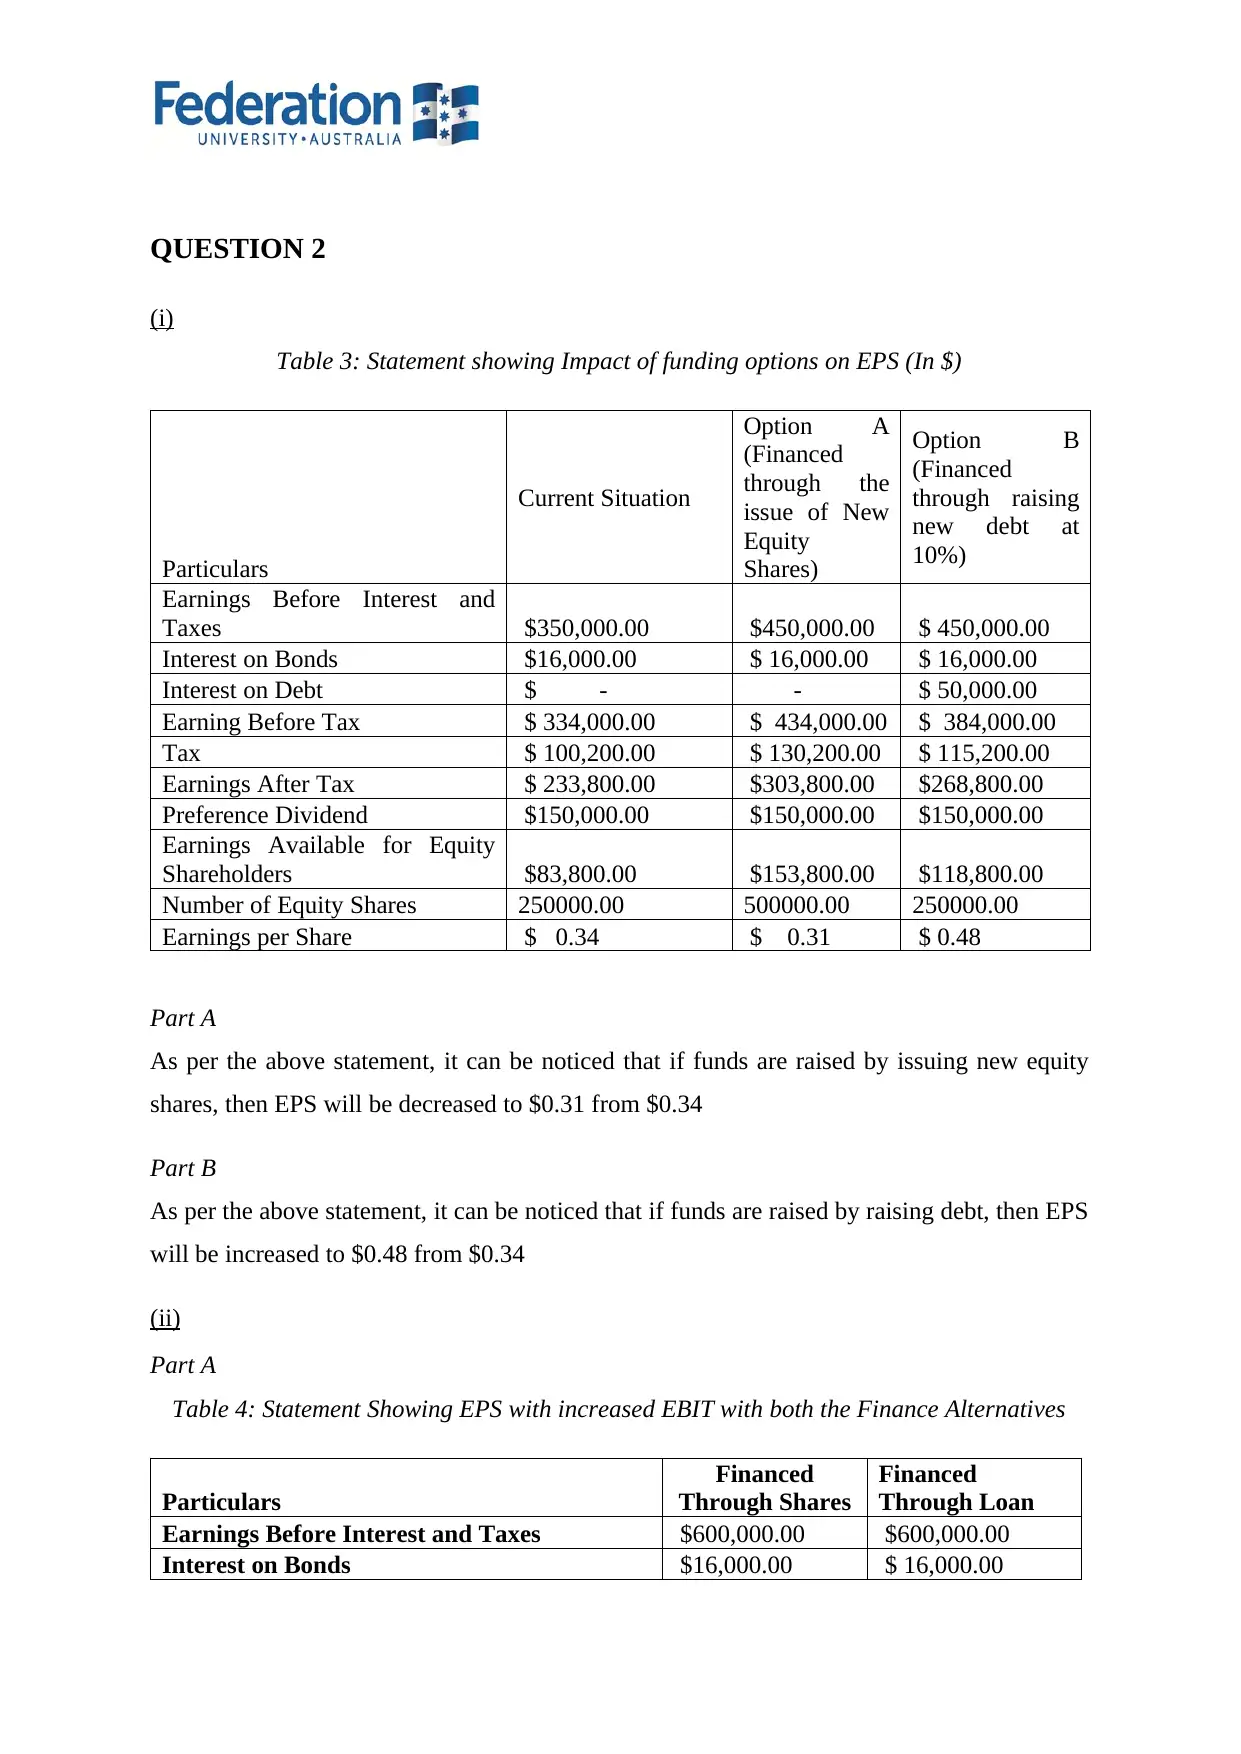
QUESTION 2
(i)
Table 3: Statement showing Impact of funding options on EPS (In $)
Particulars
Current Situation
Option A
(Financed
through the
issue of New
Equity
Shares)
Option B
(Financed
through raising
new debt at
10%)
Earnings Before Interest and
Taxes $350,000.00 $450,000.00 $ 450,000.00
Interest on Bonds $16,000.00 $ 16,000.00 $ 16,000.00
Interest on Debt $ - - $ 50,000.00
Earning Before Tax $ 334,000.00 $ 434,000.00 $ 384,000.00
Tax $ 100,200.00 $ 130,200.00 $ 115,200.00
Earnings After Tax $ 233,800.00 $303,800.00 $268,800.00
Preference Dividend $150,000.00 $150,000.00 $150,000.00
Earnings Available for Equity
Shareholders $83,800.00 $153,800.00 $118,800.00
Number of Equity Shares 250000.00 500000.00 250000.00
Earnings per Share $ 0.34 $ 0.31 $ 0.48
Part A
As per the above statement, it can be noticed that if funds are raised by issuing new equity
shares, then EPS will be decreased to $0.31 from $0.34
Part B
As per the above statement, it can be noticed that if funds are raised by raising debt, then EPS
will be increased to $0.48 from $0.34
(ii)
Part A
Table 4: Statement Showing EPS with increased EBIT with both the Finance Alternatives
Particulars
Financed
Through Shares
Financed
Through Loan
Earnings Before Interest and Taxes $600,000.00 $600,000.00
Interest on Bonds $16,000.00 $ 16,000.00
Paraphrase This Document
Need a fresh take? Get an instant paraphrase of this document with our AI Paraphraser
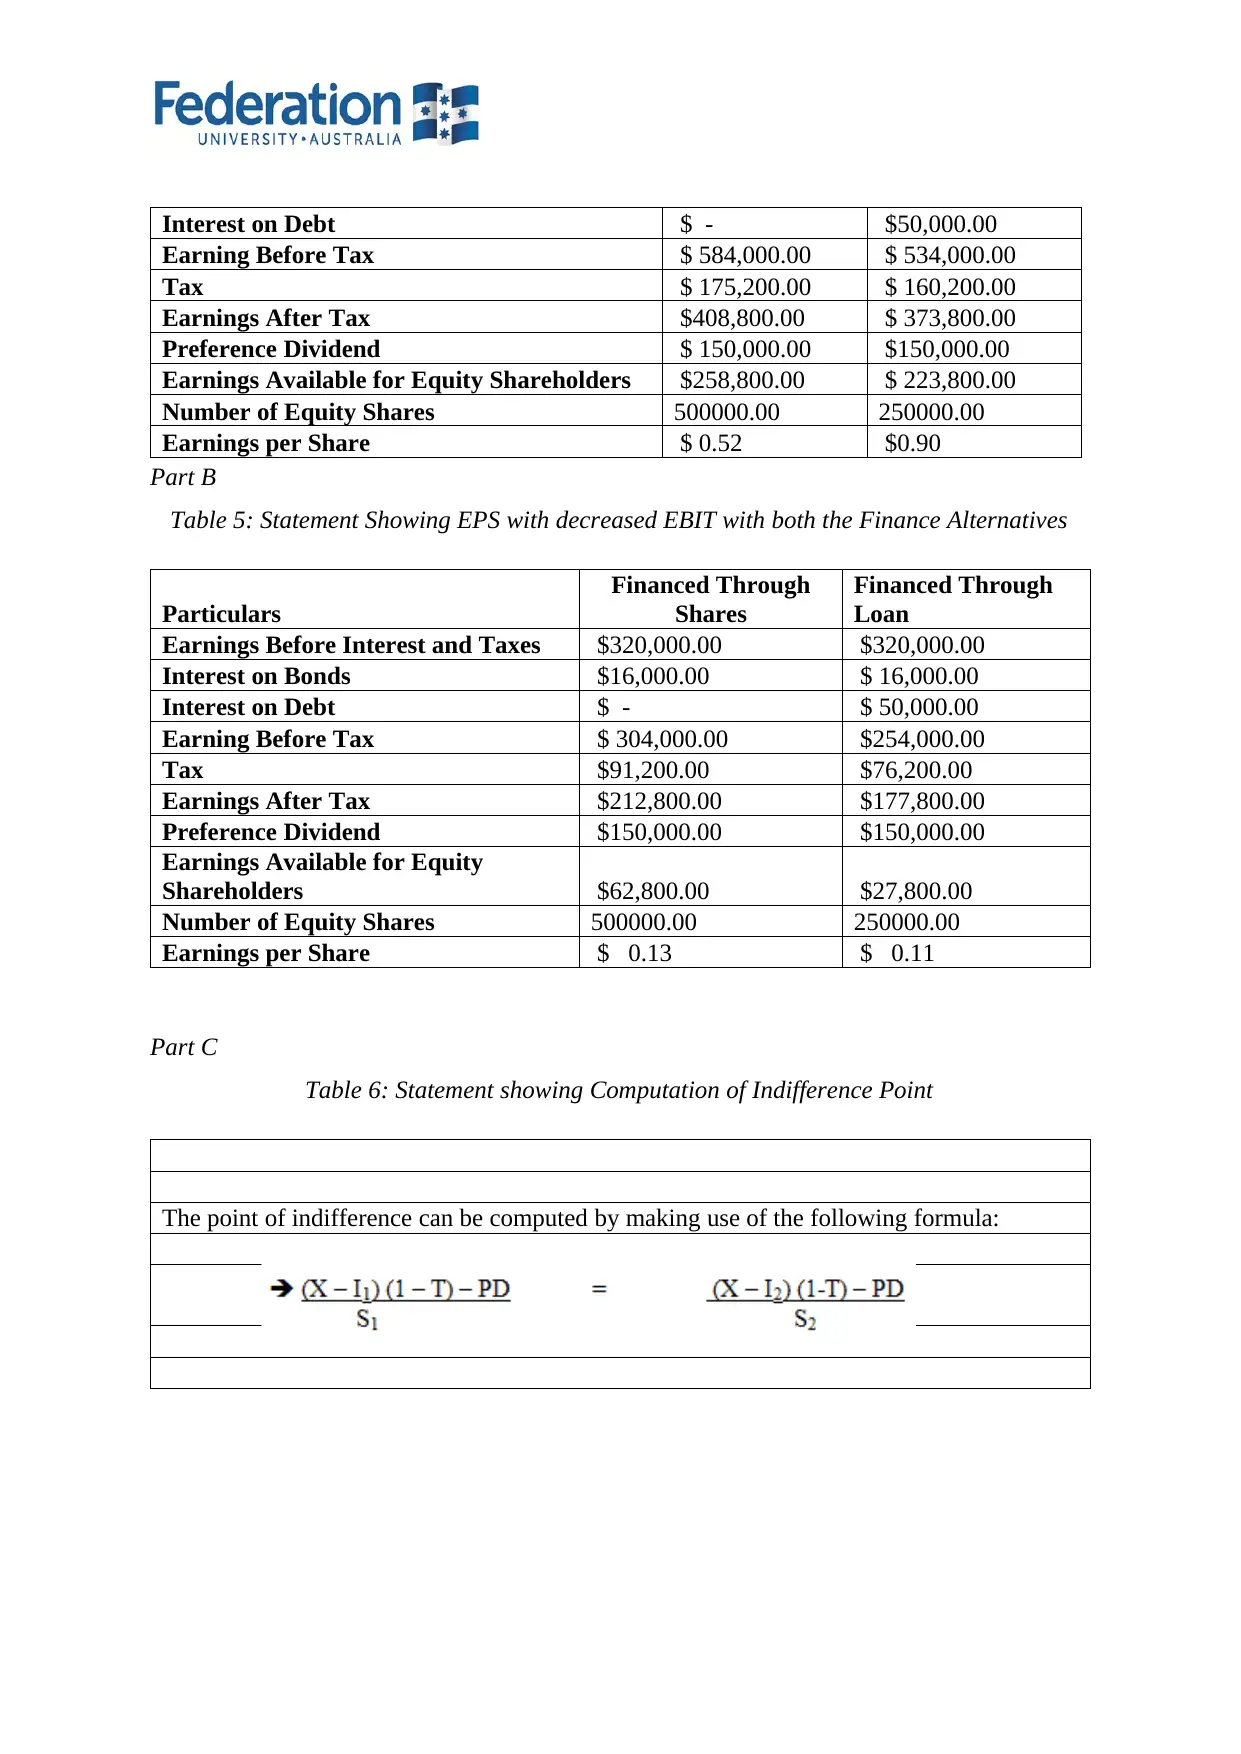
Interest on Debt $ - $50,000.00
Earning Before Tax $ 584,000.00 $ 534,000.00
Tax $ 175,200.00 $ 160,200.00
Earnings After Tax $408,800.00 $ 373,800.00
Preference Dividend $ 150,000.00 $150,000.00
Earnings Available for Equity Shareholders $258,800.00 $ 223,800.00
Number of Equity Shares 500000.00 250000.00
Earnings per Share $ 0.52 $0.90
Part B
Table 5: Statement Showing EPS with decreased EBIT with both the Finance Alternatives
Particulars
Financed Through
Shares
Financed Through
Loan
Earnings Before Interest and Taxes $320,000.00 $320,000.00
Interest on Bonds $16,000.00 $ 16,000.00
Interest on Debt $ - $ 50,000.00
Earning Before Tax $ 304,000.00 $254,000.00
Tax $91,200.00 $76,200.00
Earnings After Tax $212,800.00 $177,800.00
Preference Dividend $150,000.00 $150,000.00
Earnings Available for Equity
Shareholders $62,800.00 $27,800.00
Number of Equity Shares 500000.00 250000.00
Earnings per Share $ 0.13 $ 0.11
Part C
Table 6: Statement showing Computation of Indifference Point
The point of indifference can be computed by making use of the following formula:
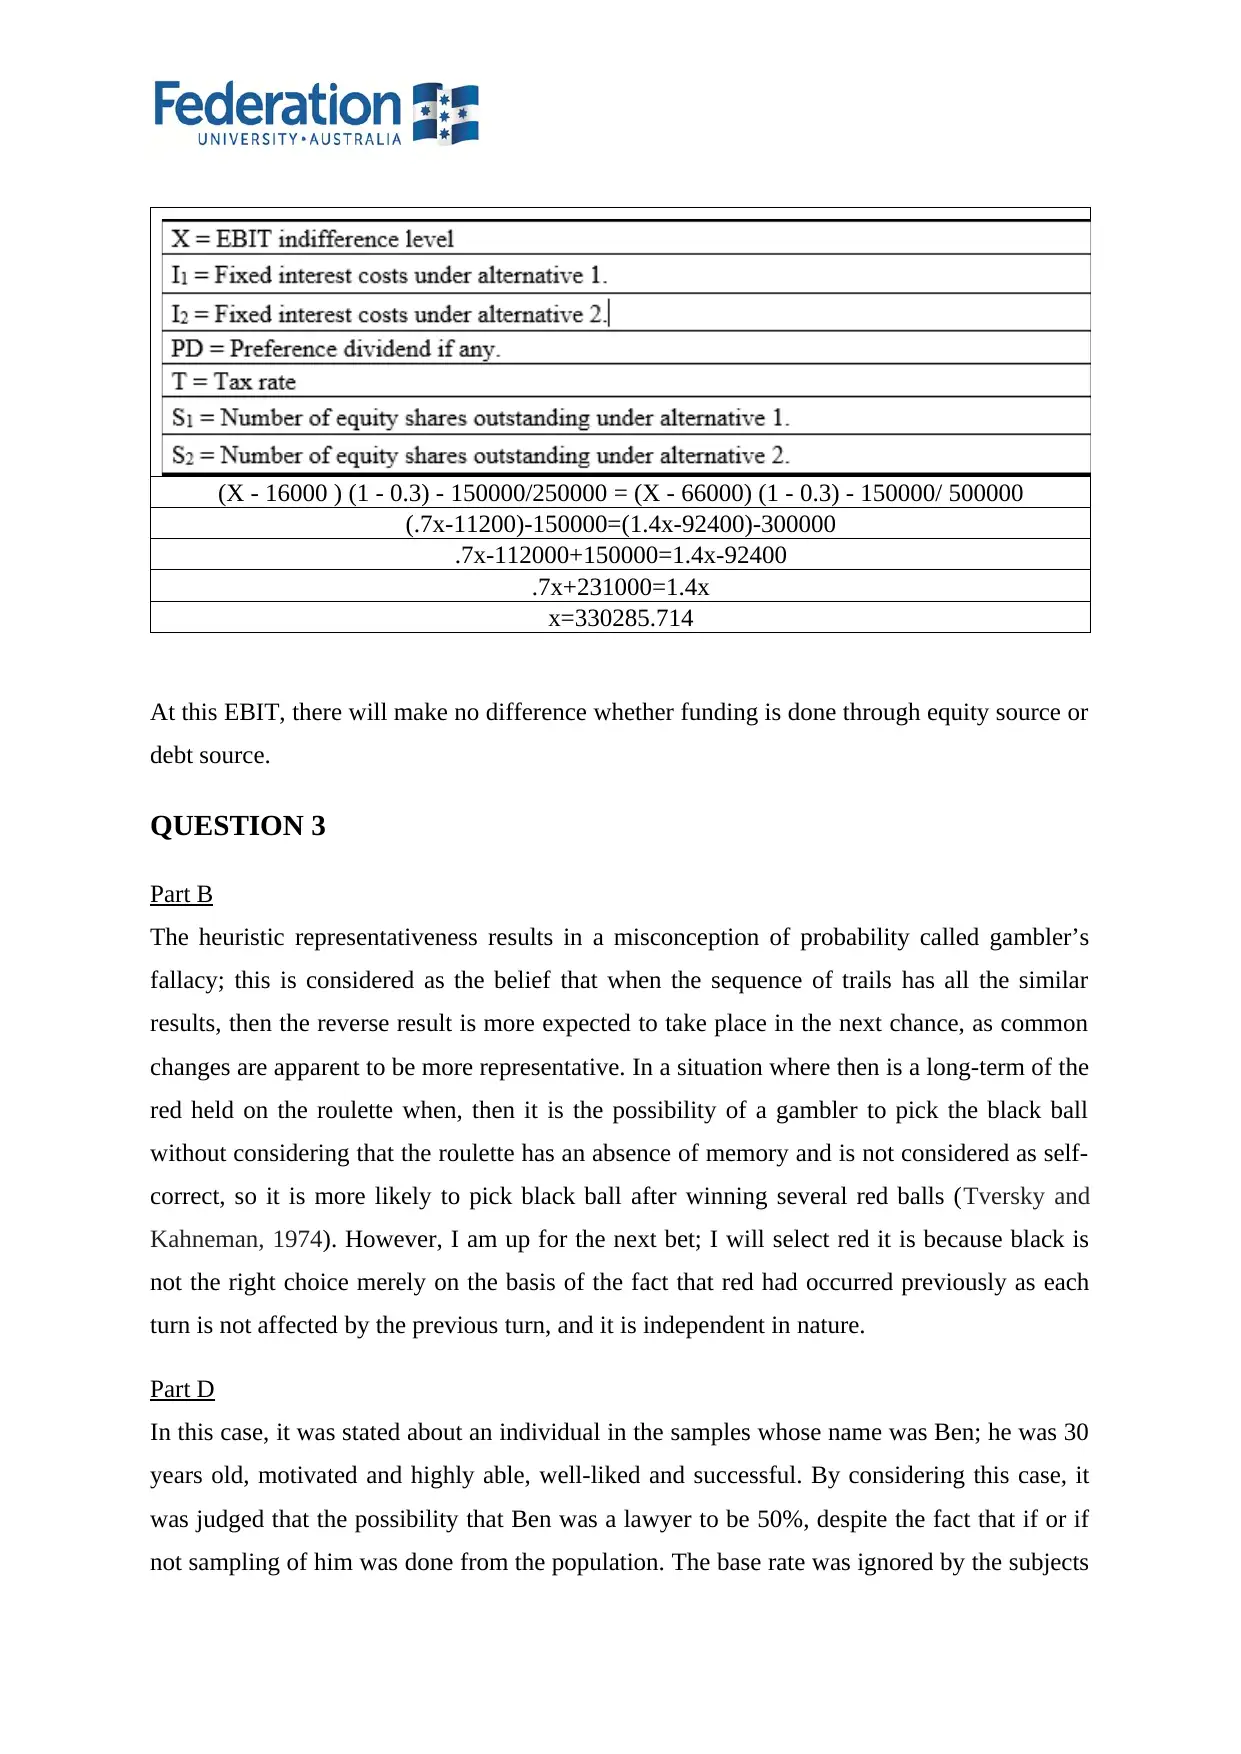
(X - 16000 ) (1 - 0.3) - 150000/250000 = (X - 66000) (1 - 0.3) - 150000/ 500000
(.7x-11200)-150000=(1.4x-92400)-300000
.7x-112000+150000=1.4x-92400
.7x+231000=1.4x
x=330285.714
At this EBIT, there will make no difference whether funding is done through equity source or
debt source.
QUESTION 3
Part B
The heuristic representativeness results in a misconception of probability called gambler’s
fallacy; this is considered as the belief that when the sequence of trails has all the similar
results, then the reverse result is more expected to take place in the next chance, as common
changes are apparent to be more representative. In a situation where then is a long-term of the
red held on the roulette when, then it is the possibility of a gambler to pick the black ball
without considering that the roulette has an absence of memory and is not considered as self-
correct, so it is more likely to pick black ball after winning several red balls (Tversky and
Kahneman, 1974). However, I am up for the next bet; I will select red it is because black is
not the right choice merely on the basis of the fact that red had occurred previously as each
turn is not affected by the previous turn, and it is independent in nature.
Part D
In this case, it was stated about an individual in the samples whose name was Ben; he was 30
years old, motivated and highly able, well-liked and successful. By considering this case, it
was judged that the possibility that Ben was a lawyer to be 50%, despite the fact that if or if
not sampling of him was done from the population. The base rate was ignored by the subjects
⊘ This is a preview!⊘
Do you want full access?
Subscribe today to unlock all pages.
Trusted by 1+ million students worldwide
1 out of 14
Related Documents


Your All-in-One AI-Powered Toolkit for Academic Success.
+13062052269
info@desklib.com
Available 24*7 on WhatsApp / Email
![[object Object]](/_next/static/media/star-bottom.7253800d.svg)
Unlock your academic potential
Copyright © 2020–2026 A2Z Services. All Rights Reserved. Developed and managed by ZUCOL.