BUACC5931: ISO 9000 Adoption and Factors in China's Service Sector
VerifiedAdded on 2023/06/04
|19
|3960
|305
Report
AI Summary
This report investigates the adoption of ISO 9000 and its relationship with various factors in China's service industry. Using data from the National Bureau of Statistics of China, the study reveals that ISO 9000 certified companies demonstrate higher profits and sales compared to their non-certified counterparts. However, the report also highlights that only a small percentage of companies in the study have undergone ISO 9000 certification. Based on these findings, the report recommends a national campaign to promote ISO 9000 certification and stricter government regulations to ensure service quality. The analysis includes descriptive and inferential statistics, hypothesis testing, and managerial advice, while also acknowledging limitations and suggesting directions for future research.
Adoption of ISO9000 and its Relationship with other Factors in
China’s Service Industry
Name:
Date: 4th October 2018
China’s Service Industry
Name:
Date: 4th October 2018
Paraphrase This Document
Need a fresh take? Get an instant paraphrase of this document with our AI Paraphraser
Executive summary
The main aim of this study was to identify the relationship between Adoption of ISO9000 with
other factor players in China’s service industry. Analysis of the data from the National Bureau of
Statistics of China gave the following main results;
The profit made by the ISO9000 certified companies was higher than that of the non-
ISO9000 certified companies
The sales made by the ISO9000 certified companies was higher than that of the non-
ISO9000 certified companies
Only a very small proportion (8%, n = 460) of the companies studied have so far
undergone ISO9000 certification.
Based on the above key findings, the following recommendations are made;
There is need for an intensive national drive and sensitization of various companies to
undergo ISO9000 certification.
The government to put strict and adequate measures for companies being registered to
ensure they are ISO9000 certified so as to ensure quality of service offered to the citizens
Table of Contents
Executive summary.........................................................................................................................2
Introduction......................................................................................................................................4
Literature Review............................................................................................................................5
Motivations for Adoption of ISO Standards................................................................................5
Research Questions..........................................................................................................................6
Research Hypothesis........................................................................................................................7
Description of the methodology......................................................................................................8
Results..............................................................................................................................................8
Descriptive Analysis....................................................................................................................8
Inferential Analysis....................................................................................................................11
Discussion and managerial advises...............................................................................................16
Limitations and directions for future research...............................................................................17
References......................................................................................................................................17
⊘ This is a preview!⊘
Do you want full access?
Subscribe today to unlock all pages.
Trusted by 1+ million students worldwide
Introduction
The ISO 9000 series of quality management systems standard has been widely applied all over
the world since its introduction in 1987. By the end of 2013, ISO 9000 had been adopted by over
1,129,000 facilities in 189 countries. Both academics and practitioners are interested in
understanding the relationship between adoption of ISO 9000, and other factors (Christmann &
Taylor, 2006; Du, Yin, & Zhang, 2016; Fikru, 2014a, 2014b, 2016; Nakamura, Takahashi, &
Vertinsky, 2001; Pekovic, 2010; Wu, Chu, & Liu, 2007).
In 2008, the National Bureau of Statistics of China conducted an Economic Census of the service
firms. The descriptions of variables, the coding are shown in the table. The data is available in
Moodle.
As an indication of universal quality framework, ISO9000 certification has been embraced by an
ever increasing number of business enterprises. In the last few years, there have been over half a
million certified companies in both America and Europe, and China has had an excess of
390,000 certified companies. It has pulled in attention of many scholars as to whether
certification has positive or negative impact on the performance of the companies. This paper
examines the ISO9000 certification impact on company's market performance basing on the
Chinese companies. Considering ISO9000 affirmation as an occasion, a confirmation impact
model will be set up by methods for the occasion ponder strategy, which takes irregular return
rate as a fundamental marker to gauge the ISO9000 accreditation impact on Chinese market
execution in various occasion times.
Paraphrase This Document
Need a fresh take? Get an instant paraphrase of this document with our AI Paraphraser
Literature Review
Motivations for Adoption of ISO Standards
Immediately after introduction of the ISO 9000 series sometime back in 1987, an number of
studies touching on motivational factors related to acquiring of ISO certification have been
published, yet the prevalent research approach has taken a gander at these components from the
alleged double perspective, or at the end of the day from the inward/outer inspirations point of
view. In view of this examination approach, the internal factors include desire to make more
profits, improve productivity, reduce on operation costs, and of course to improve on the quality.
The external factors on the other hand include enhanced image, pressure from the suppliers and
clients
(Santos & Millán, Motivation And Benefits Of Implementation And Certification According ISO
9001–The Portuguese Experience, 2013; Santos, Costa, & Leal, Motivation and benefits of
implementation and certification according ISO 9001: The Portuguese experience, 2014)
In general, the ISO 9000 group of principles has turned into a primary necessity for entering the
worldwide market (Sun, 2000; Abraham, Crawford, Carter, & Mazotta, 2000; Almeida, Caten, &
Gutterres, 2009), subsequently some of the past research takes a shot at the reasons behind
getting ISO certification argue that the external factors are better than the internal factors
(Casadesús & Karapetrovic, 2005; Dongmo & Onojaefe, 2013; Heras-Saizarbitoria, Arana, &
San , 2010).
The instance of Japan gives solid proof to the in advance of specified articulation: in the 90s, ISO
9001 accreditation turned into a necessity for exports to Europe. Henceforth, Japan was
compelled to acquire ISO accreditation keeping in mind the end goal to keep up and proceed
with the development of its piece of the overall industry abroad (Heras-Saizarbitoria, Arana, &
San , 2010; Kostagiolas & Kitsiou, 2008; Kumar & Balakrishnan, 2011).
Absolutely, there are likewise those (Abraham, Crawford, Carter, & Mazotta, 2000; Llopis &
Tarí, 2003) who contend that the appropriation of gauges, for example, the ISO 9000 series is
driven internally. For this situation, as upheld by Heras-Saizarbitoria et al. (2010), the adoption
would regularly rely upon the organization's particular hierarchical assets. For instance, on
account of organizations which go for TQM usage, ISO 9001 certification is a great beginning
towards reducing cost and quality change (Martínez-Costa, Martínez-Lorente, & Choi, 2008). As
Sun (2000) affirms, ISO 9001 accreditation can be helpful in the event that it is viewed as a route
towards TQM. In any case, for ISO execution requires a generous budgetary asset, which can
change from as meagre as ten thousand dollars to as much as three hundred thousand dollars
(Martínez-Lorente & Martínez-Costa, 2004) and on the grounds that the enhancements yielded
by such accreditation are easy to refute (Almeida, Caten, & Gutterres, 2009).
Research Questions
This study sought to answer the following research questions.
1. Is there is significant difference in the profit made by the ISO certified companies and the
non-ISO certified companies?
2. Is there is significant difference in the profit made by the companies with overseas
investment and those without overseas investment?
3. Is there is significant difference in the sales made by the ISO certified companies and the
non-ISO certified companies?
⊘ This is a preview!⊘
Do you want full access?
Subscribe today to unlock all pages.
Trusted by 1+ million students worldwide
4. Is there is significant difference in the sales made by the companies with overseas
investment and those without overseas investment?
5. What factors affect the company profits?
Research Hypothesis
From the above research questions, the following hypothesis were generated and were to be
tested so answer to answer the research questions.
H0: There is no significant difference in the average profit made by the ISO certified companies
and the non-ISO certified companies.
HA: There is no significant difference in the average profit made by the ISO certified companies
and the non-ISO certified companies.
H0: There is no significant difference in the average profit made by the companies with overseas
investment and those without overseas investment.
HA: There is significant difference in the average profit made by the companies with overseas
investment and those without overseas investment.
H0: There is no significant difference in the average sales made by the ISO certified companies
and the non-ISO certified companies.
HA: There is no significant difference in the average sales made by the ISO certified companies
and the non-ISO certified companies.
H0: There is no significant difference in the average sales made by the companies with overseas
investment and those without overseas investment.
HA: There is significant difference in the average sales made by the companies with overseas
investment and those without overseas investment.
H0: There are no factors that significantly affect the profits of a company
Paraphrase This Document
Need a fresh take? Get an instant paraphrase of this document with our AI Paraphraser
HA: There are factors that significantly affect the profits of a company
Description of the methodology
In 2008, the National Bureau of Statistics of China conducted an Economic Census of the service
firms. A total of 5717 companies were selected for this study. The sampling and data collection
was based on the records from the registrar of companies.
For analysis, both descriptive and inferential analysis were employed to analyse the data.
Results
Descriptive Analysis
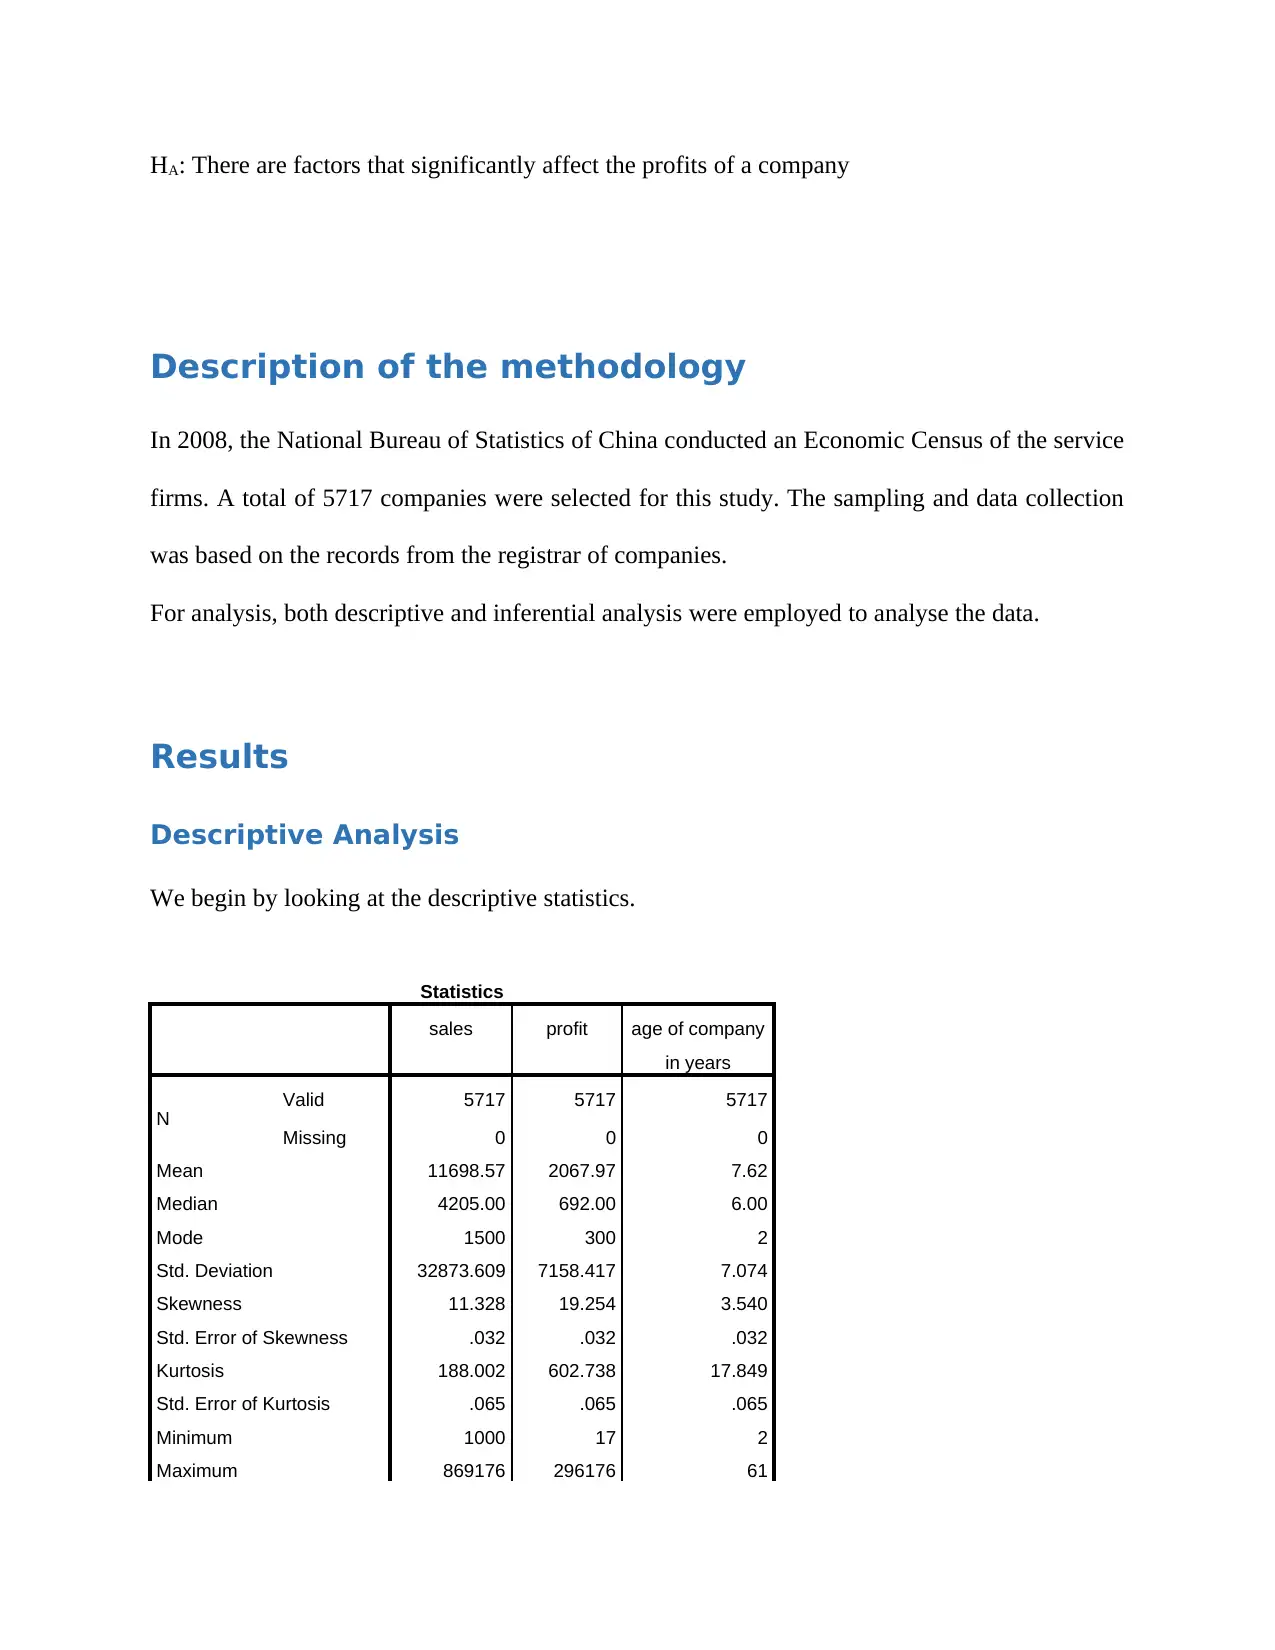
We begin by looking at the descriptive statistics.
Statistics
sales profit age of company
in years
N Valid 5717 5717 5717
Missing 0 0 0
Mean 11698.57 2067.97 7.62
Median 4205.00 692.00 6.00
Mode 1500 300 2
Std. Deviation 32873.609 7158.417 7.074
Skewness 11.328 19.254 3.540
Std. Error of Skewness .032 .032 .032
Kurtosis 188.002 602.738 17.849
Std. Error of Kurtosis .065 .065 .065
Minimum 1000 17 2
Maximum 869176 296176 61
Description of the methodology
In 2008, the National Bureau of Statistics of China conducted an Economic Census of the service
firms. A total of 5717 companies were selected for this study. The sampling and data collection
was based on the records from the registrar of companies.
For analysis, both descriptive and inferential analysis were employed to analyse the data.
Results
Descriptive Analysis
We begin by looking at the descriptive statistics.
Statistics
sales profit age of company
in years
N Valid 5717 5717 5717
Missing 0 0 0
Mean 11698.57 2067.97 7.62
Median 4205.00 692.00 6.00
Mode 1500 300 2
Std. Deviation 32873.609 7158.417 7.074
Skewness 11.328 19.254 3.540
Std. Error of Skewness .032 .032 .032
Kurtosis 188.002 602.738 17.849
Std. Error of Kurtosis .065 .065 .065
Minimum 1000 17 2
Maximum 869176 296176 61
Percentiles
25 2273.50 313.00 3.00
50 4205.00 692.00 6.00
75 8953.50 1542.00 9.00
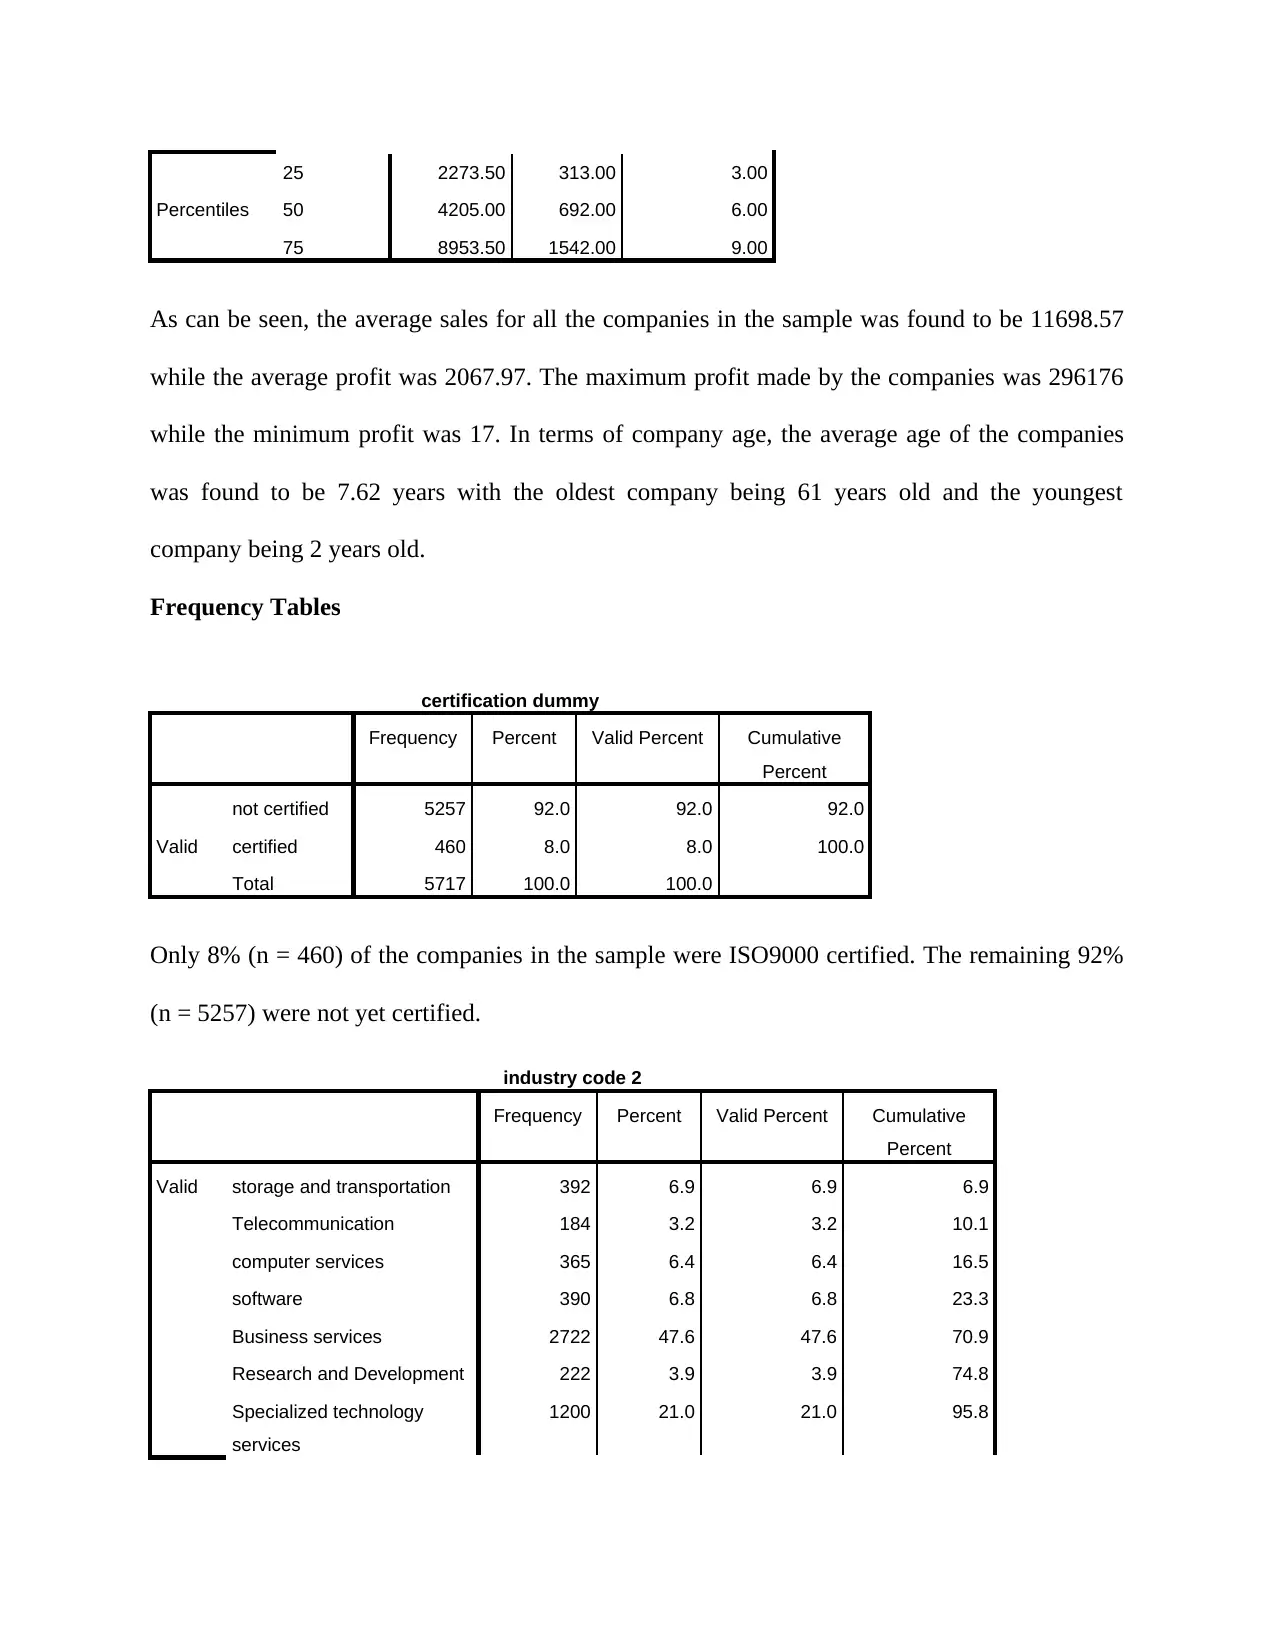
As can be seen, the average sales for all the companies in the sample was found to be 11698.57
while the average profit was 2067.97. The maximum profit made by the companies was 296176
while the minimum profit was 17. In terms of company age, the average age of the companies
was found to be 7.62 years with the oldest company being 61 years old and the youngest
company being 2 years old.
Frequency Tables
certification dummy
Frequency Percent Valid Percent Cumulative
Percent
Valid
not certified 5257 92.0 92.0 92.0
certified 460 8.0 8.0 100.0
Total 5717 100.0 100.0
Only 8% (n = 460) of the companies in the sample were ISO9000 certified. The remaining 92%
(n = 5257) were not yet certified.
industry code 2
Frequency Percent Valid Percent Cumulative
Percent
Valid storage and transportation 392 6.9 6.9 6.9
Telecommunication 184 3.2 3.2 10.1
computer services 365 6.4 6.4 16.5
software 390 6.8 6.8 23.3
Business services 2722 47.6 47.6 70.9
Research and Development 222 3.9 3.9 74.8
Specialized technology
services
1200 21.0 21.0 95.8
25 2273.50 313.00 3.00
50 4205.00 692.00 6.00
75 8953.50 1542.00 9.00
As can be seen, the average sales for all the companies in the sample was found to be 11698.57
while the average profit was 2067.97. The maximum profit made by the companies was 296176
while the minimum profit was 17. In terms of company age, the average age of the companies
was found to be 7.62 years with the oldest company being 61 years old and the youngest
company being 2 years old.
Frequency Tables
certification dummy
Frequency Percent Valid Percent Cumulative
Percent
Valid
not certified 5257 92.0 92.0 92.0
certified 460 8.0 8.0 100.0
Total 5717 100.0 100.0
Only 8% (n = 460) of the companies in the sample were ISO9000 certified. The remaining 92%
(n = 5257) were not yet certified.
industry code 2
Frequency Percent Valid Percent Cumulative
Percent
Valid storage and transportation 392 6.9 6.9 6.9
Telecommunication 184 3.2 3.2 10.1
computer services 365 6.4 6.4 16.5
software 390 6.8 6.8 23.3
Business services 2722 47.6 47.6 70.9
Research and Development 222 3.9 3.9 74.8
Specialized technology
services
1200 21.0 21.0 95.8
⊘ This is a preview!⊘
Do you want full access?
Subscribe today to unlock all pages.
Trusted by 1+ million students worldwide
Technology exchange and
promotion
242 4.2 4.2 100.0
Total 5717 100.0 100.0
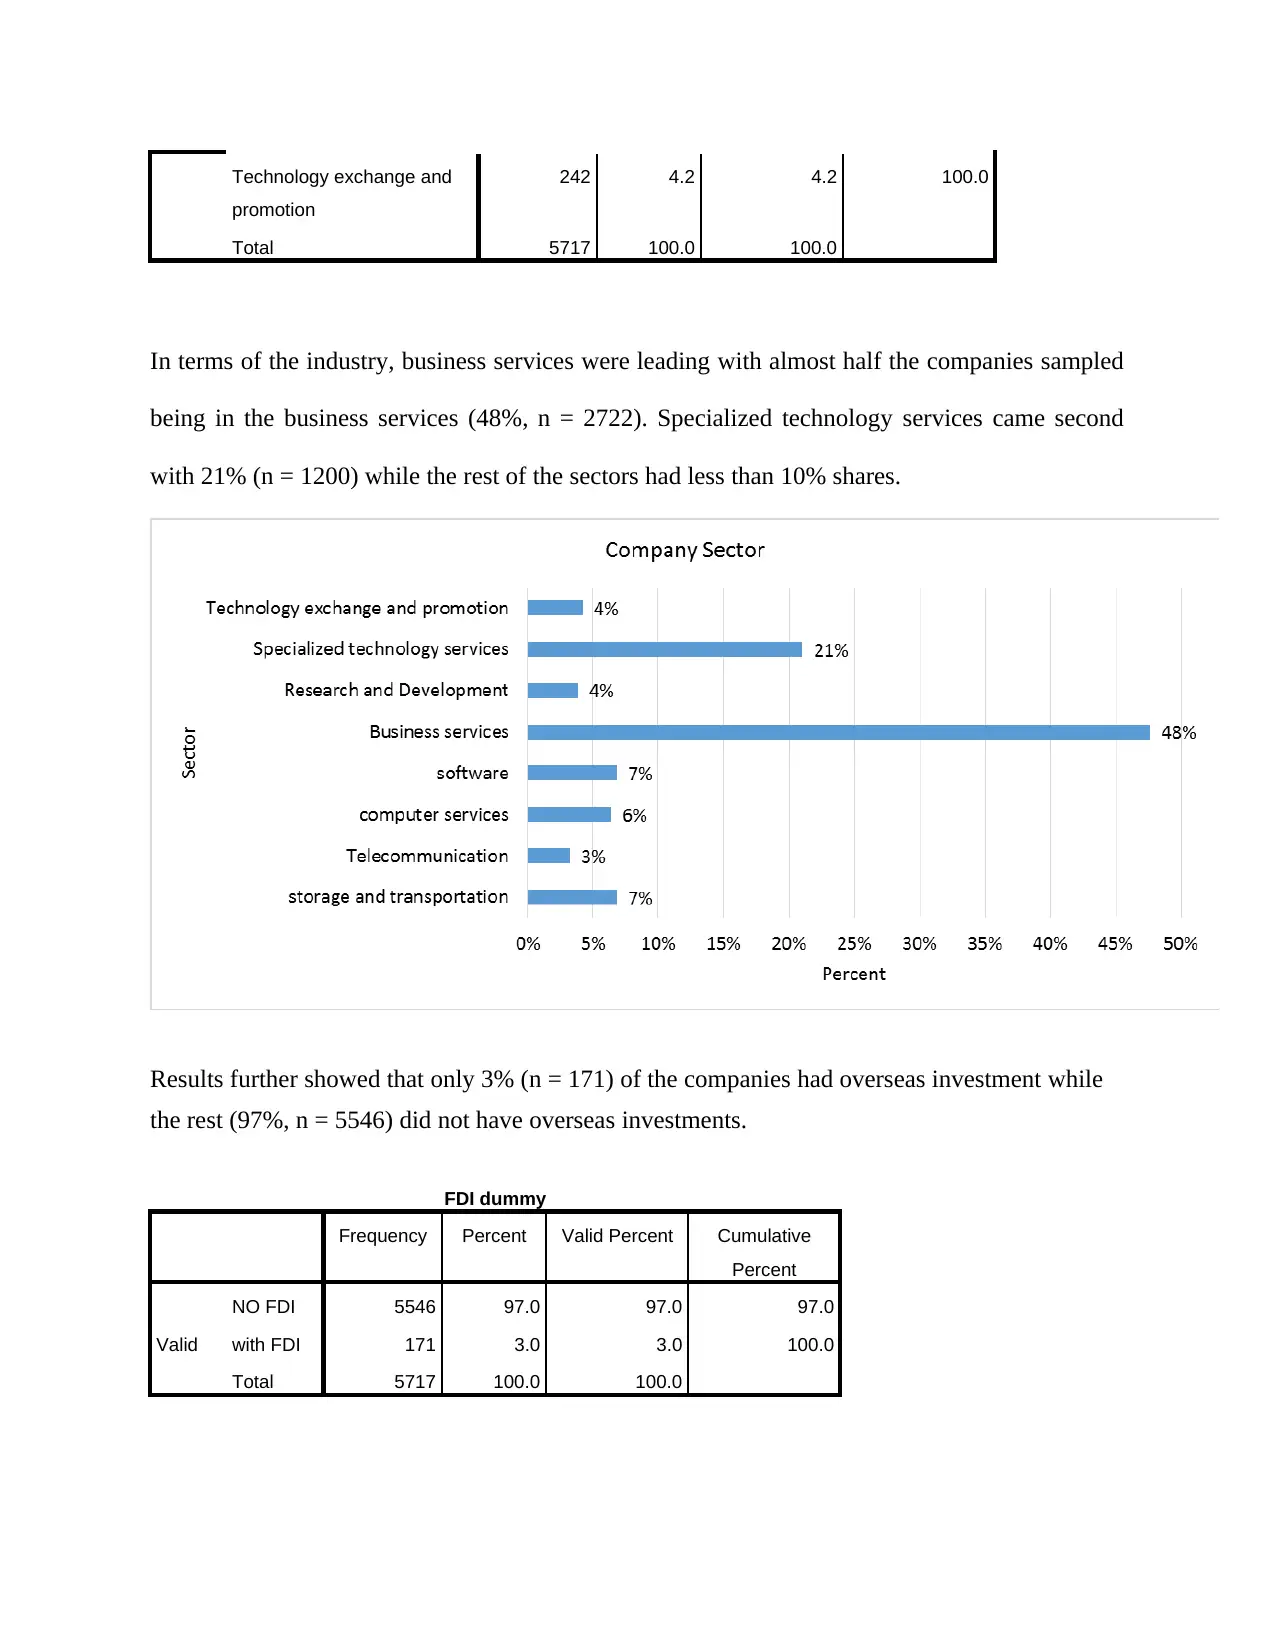
In terms of the industry, business services were leading with almost half the companies sampled
being in the business services (48%, n = 2722). Specialized technology services came second
with 21% (n = 1200) while the rest of the sectors had less than 10% shares.
Results further showed that only 3% (n = 171) of the companies had overseas investment while
the rest (97%, n = 5546) did not have overseas investments.
FDI dummy
Frequency Percent Valid Percent Cumulative
Percent
Valid
NO FDI 5546 97.0 97.0 97.0
with FDI 171 3.0 3.0 100.0
Total 5717 100.0 100.0
promotion
242 4.2 4.2 100.0
Total 5717 100.0 100.0
In terms of the industry, business services were leading with almost half the companies sampled
being in the business services (48%, n = 2722). Specialized technology services came second
with 21% (n = 1200) while the rest of the sectors had less than 10% shares.
Results further showed that only 3% (n = 171) of the companies had overseas investment while
the rest (97%, n = 5546) did not have overseas investments.
FDI dummy
Frequency Percent Valid Percent Cumulative
Percent
Valid
NO FDI 5546 97.0 97.0 97.0
with FDI 171 3.0 3.0 100.0
Total 5717 100.0 100.0
Paraphrase This Document
Need a fresh take? Get an instant paraphrase of this document with our AI Paraphraser
Inferential Analysis
Hypothesis Tests
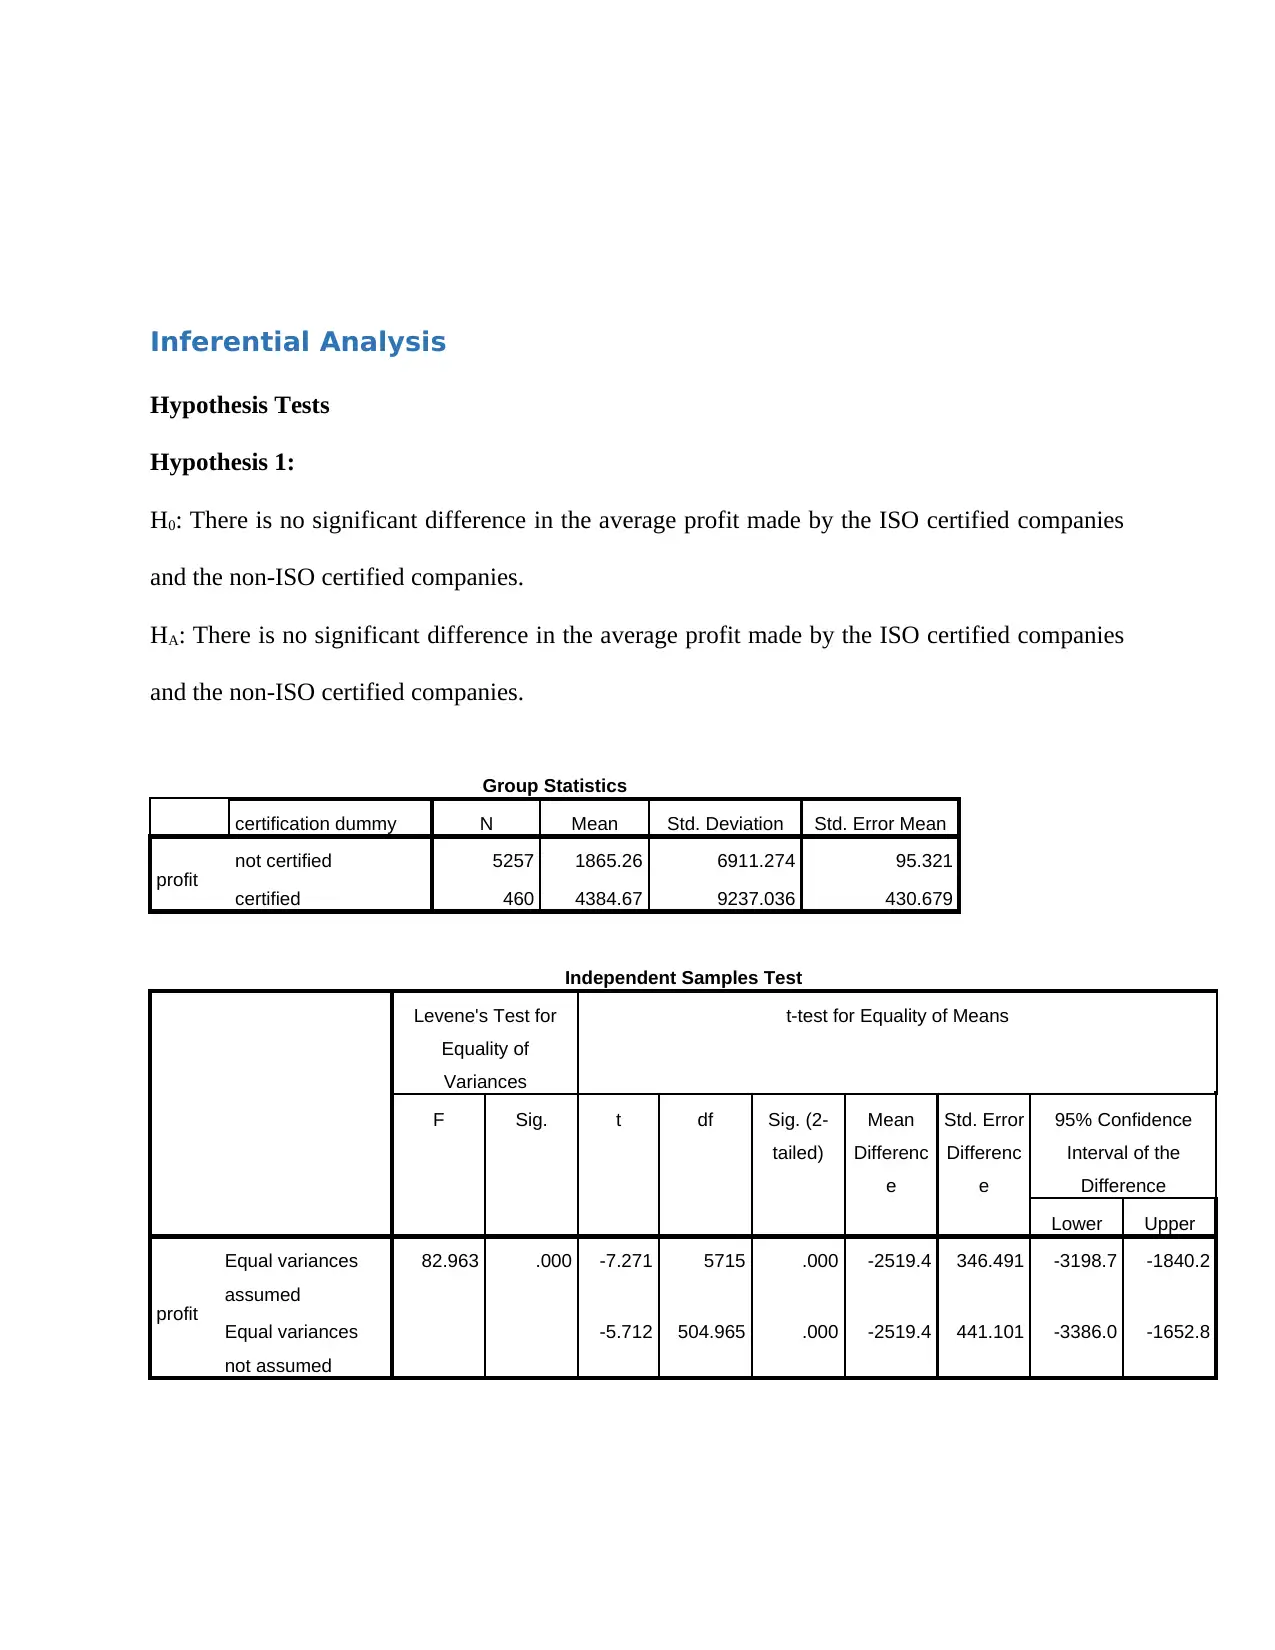
Hypothesis 1:
H0: There is no significant difference in the average profit made by the ISO certified companies
and the non-ISO certified companies.
HA: There is no significant difference in the average profit made by the ISO certified companies
and the non-ISO certified companies.
Group Statistics
certification dummy N Mean Std. Deviation Std. Error Mean
profit not certified 5257 1865.26 6911.274 95.321
certified 460 4384.67 9237.036 430.679
Independent Samples Test
Levene's Test for
Equality of
Variances
t-test for Equality of Means
F Sig. t df Sig. (2-
tailed)
Mean
Differenc
e
Std. Error
Differenc
e
95% Confidence
Interval of the
Difference
Lower Upper
profit
Equal variances
assumed
82.963 .000 -7.271 5715 .000 -2519.4 346.491 -3198.7 -1840.2
Equal variances
not assumed
-5.712 504.965 .000 -2519.4 441.101 -3386.0 -1652.8
Hypothesis Tests
Hypothesis 1:
H0: There is no significant difference in the average profit made by the ISO certified companies
and the non-ISO certified companies.
HA: There is no significant difference in the average profit made by the ISO certified companies
and the non-ISO certified companies.
Group Statistics
certification dummy N Mean Std. Deviation Std. Error Mean
profit not certified 5257 1865.26 6911.274 95.321
certified 460 4384.67 9237.036 430.679
Independent Samples Test
Levene's Test for
Equality of
Variances
t-test for Equality of Means
F Sig. t df Sig. (2-
tailed)
Mean
Differenc
e
Std. Error
Differenc
e
95% Confidence
Interval of the
Difference
Lower Upper
profit
Equal variances
assumed
82.963 .000 -7.271 5715 .000 -2519.4 346.491 -3198.7 -1840.2
Equal variances
not assumed
-5.712 504.965 .000 -2519.4 441.101 -3386.0 -1652.8
We performed an independent t-test in order to compare the average profits for ISO9000
certified companies and non-ISO9000 certified companies. Results showed that the average
profits for ISO9000 certified companies (M = 4384.67, SD = 9237.04, N = 460) was
significantly different from the average profits for the non-ISO9000 certified companies (M =
1865.26, SD = 6911.27, N = 5257), t (5715) = -7.271, p < .05, two-tailed. Essentially the results
showed that the average profits made by the ISO9000 certified companies was significantly
higher than that of the non-ISO9000 certified companies.
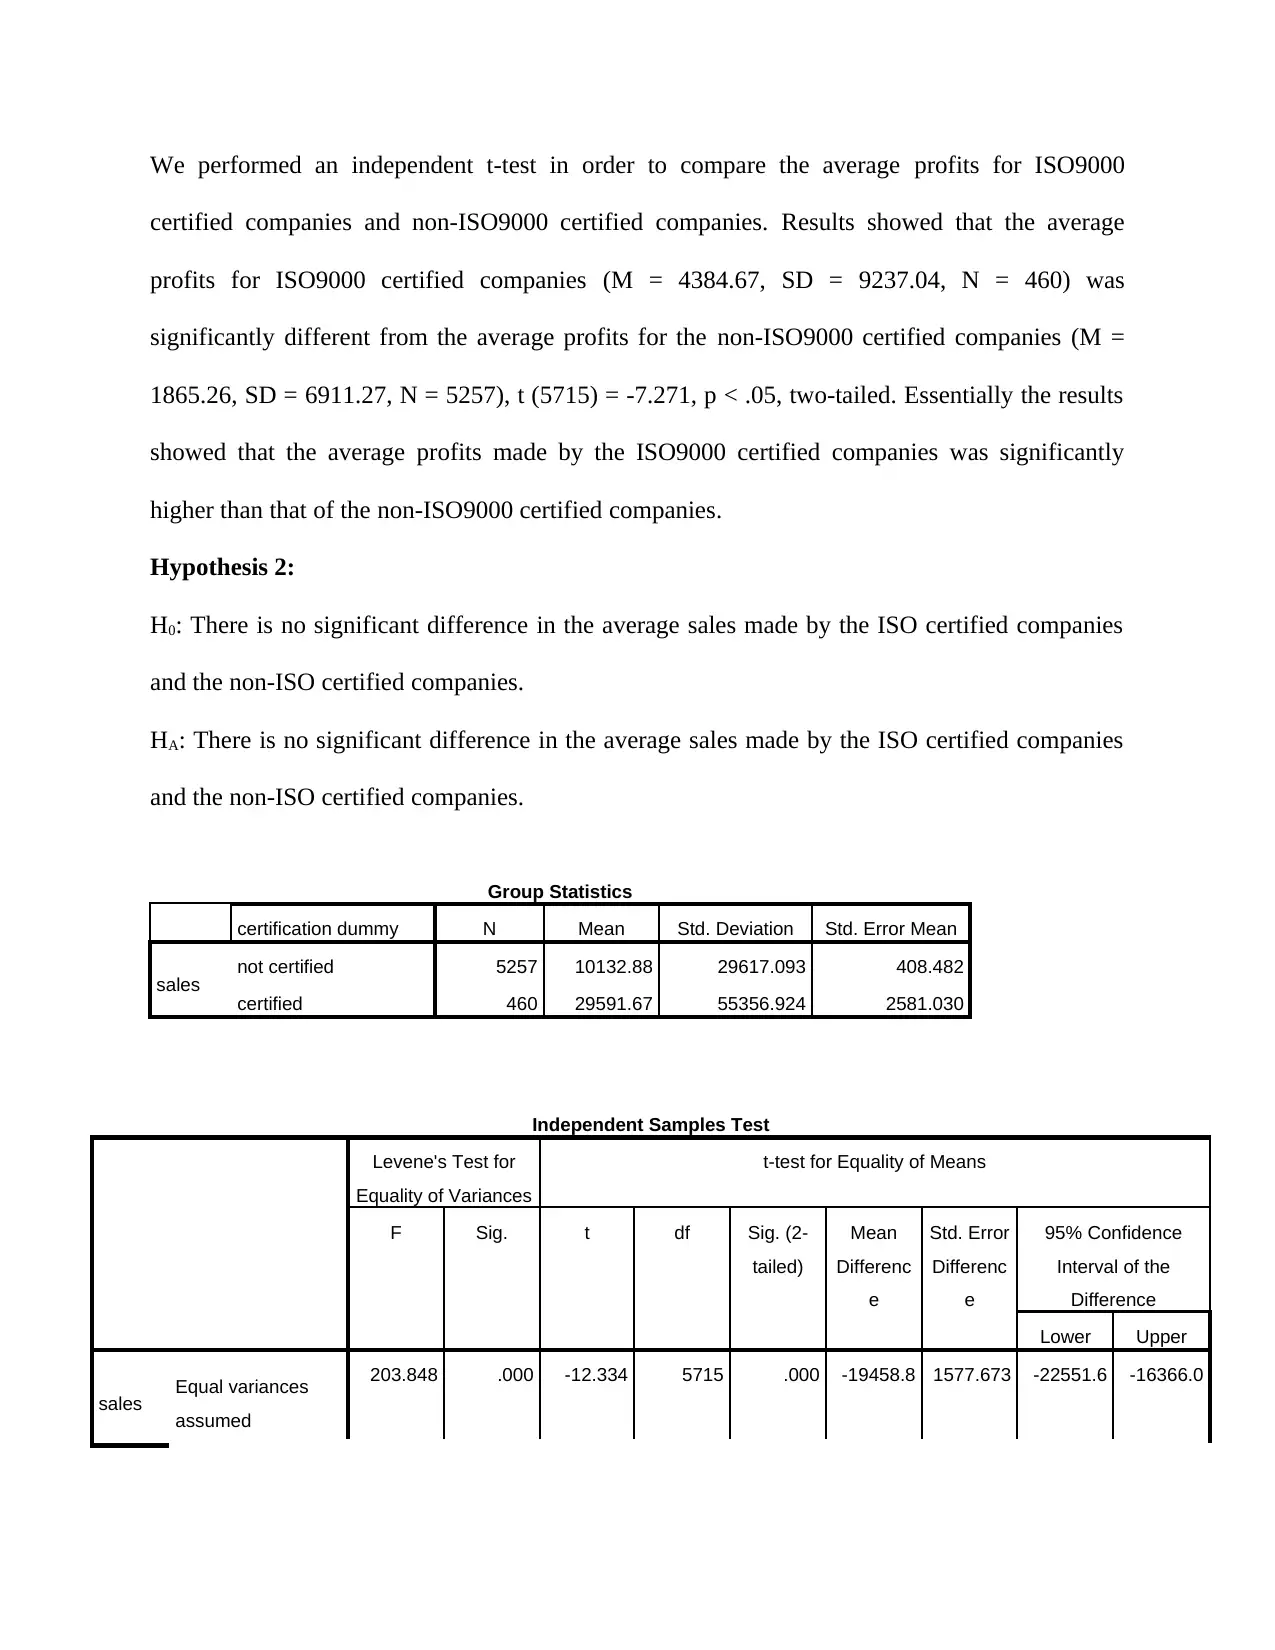
Hypothesis 2:
H0: There is no significant difference in the average sales made by the ISO certified companies
and the non-ISO certified companies.
HA: There is no significant difference in the average sales made by the ISO certified companies
and the non-ISO certified companies.
Group Statistics
certification dummy N Mean Std. Deviation Std. Error Mean
sales not certified 5257 10132.88 29617.093 408.482
certified 460 29591.67 55356.924 2581.030
Independent Samples Test
Levene's Test for
Equality of Variances
t-test for Equality of Means
F Sig. t df Sig. (2-
tailed)
Mean
Differenc
e
Std. Error
Differenc
e
95% Confidence
Interval of the
Difference
Lower Upper
sales Equal variances
assumed
203.848 .000 -12.334 5715 .000 -19458.8 1577.673 -22551.6 -16366.0
certified companies and non-ISO9000 certified companies. Results showed that the average
profits for ISO9000 certified companies (M = 4384.67, SD = 9237.04, N = 460) was
significantly different from the average profits for the non-ISO9000 certified companies (M =
1865.26, SD = 6911.27, N = 5257), t (5715) = -7.271, p < .05, two-tailed. Essentially the results
showed that the average profits made by the ISO9000 certified companies was significantly
higher than that of the non-ISO9000 certified companies.
Hypothesis 2:
H0: There is no significant difference in the average sales made by the ISO certified companies
and the non-ISO certified companies.
HA: There is no significant difference in the average sales made by the ISO certified companies
and the non-ISO certified companies.
Group Statistics
certification dummy N Mean Std. Deviation Std. Error Mean
sales not certified 5257 10132.88 29617.093 408.482
certified 460 29591.67 55356.924 2581.030
Independent Samples Test
Levene's Test for
Equality of Variances
t-test for Equality of Means
F Sig. t df Sig. (2-
tailed)
Mean
Differenc
e
Std. Error
Differenc
e
95% Confidence
Interval of the
Difference
Lower Upper
sales Equal variances
assumed
203.848 .000 -12.334 5715 .000 -19458.8 1577.673 -22551.6 -16366.0
⊘ This is a preview!⊘
Do you want full access?
Subscribe today to unlock all pages.
Trusted by 1+ million students worldwide
1 out of 19
Related Documents


Your All-in-One AI-Powered Toolkit for Academic Success.
+13062052269
info@desklib.com
Available 24*7 on WhatsApp / Email
![[object Object]](/_next/static/media/star-bottom.7253800d.svg)
Unlock your academic potential
Copyright © 2020–2026 A2Z Services. All Rights Reserved. Developed and managed by ZUCOL.