Detailed Budget Analysis Report: Accounting for Decision Making
VerifiedAdded on 2022/08/17
|8
|1092
|15
Report
AI Summary
This report, prepared for the Accounting for Decision Making course, provides a comprehensive analysis of a business's financial budgets. It includes an executive summary, budget tables for cash flow, income statements, sales, cost of sales, and expenses. The analysis highlights negative cash flow and profitability, stemming from high expenses in administration and selling activities. The report examines sales projections, cost of sales, and purchase budgets to assess the company's financial health. The student concludes that the proposed expansion project should not be accepted due to the potential for significant financial losses and negative impacts on cash flow. The report also includes a detailed list of references.
Running head: ACCOUNTING FOR DECISION MAKING
Accounting for Decision Making
Name of the Student:
Name of the University:
Author’s Note:
Course ID:
Accounting for Decision Making
Name of the Student:
Name of the University:
Author’s Note:
Course ID:
Paraphrase This Document
Need a fresh take? Get an instant paraphrase of this document with our AI Paraphraser

1
ACCOUNTING FOR DECISION MAKING
Table of Contents
Executive Summary:........................................................................................................................2
References:......................................................................................................................................7
2
ACCOUNTING FOR DECISION MAKING
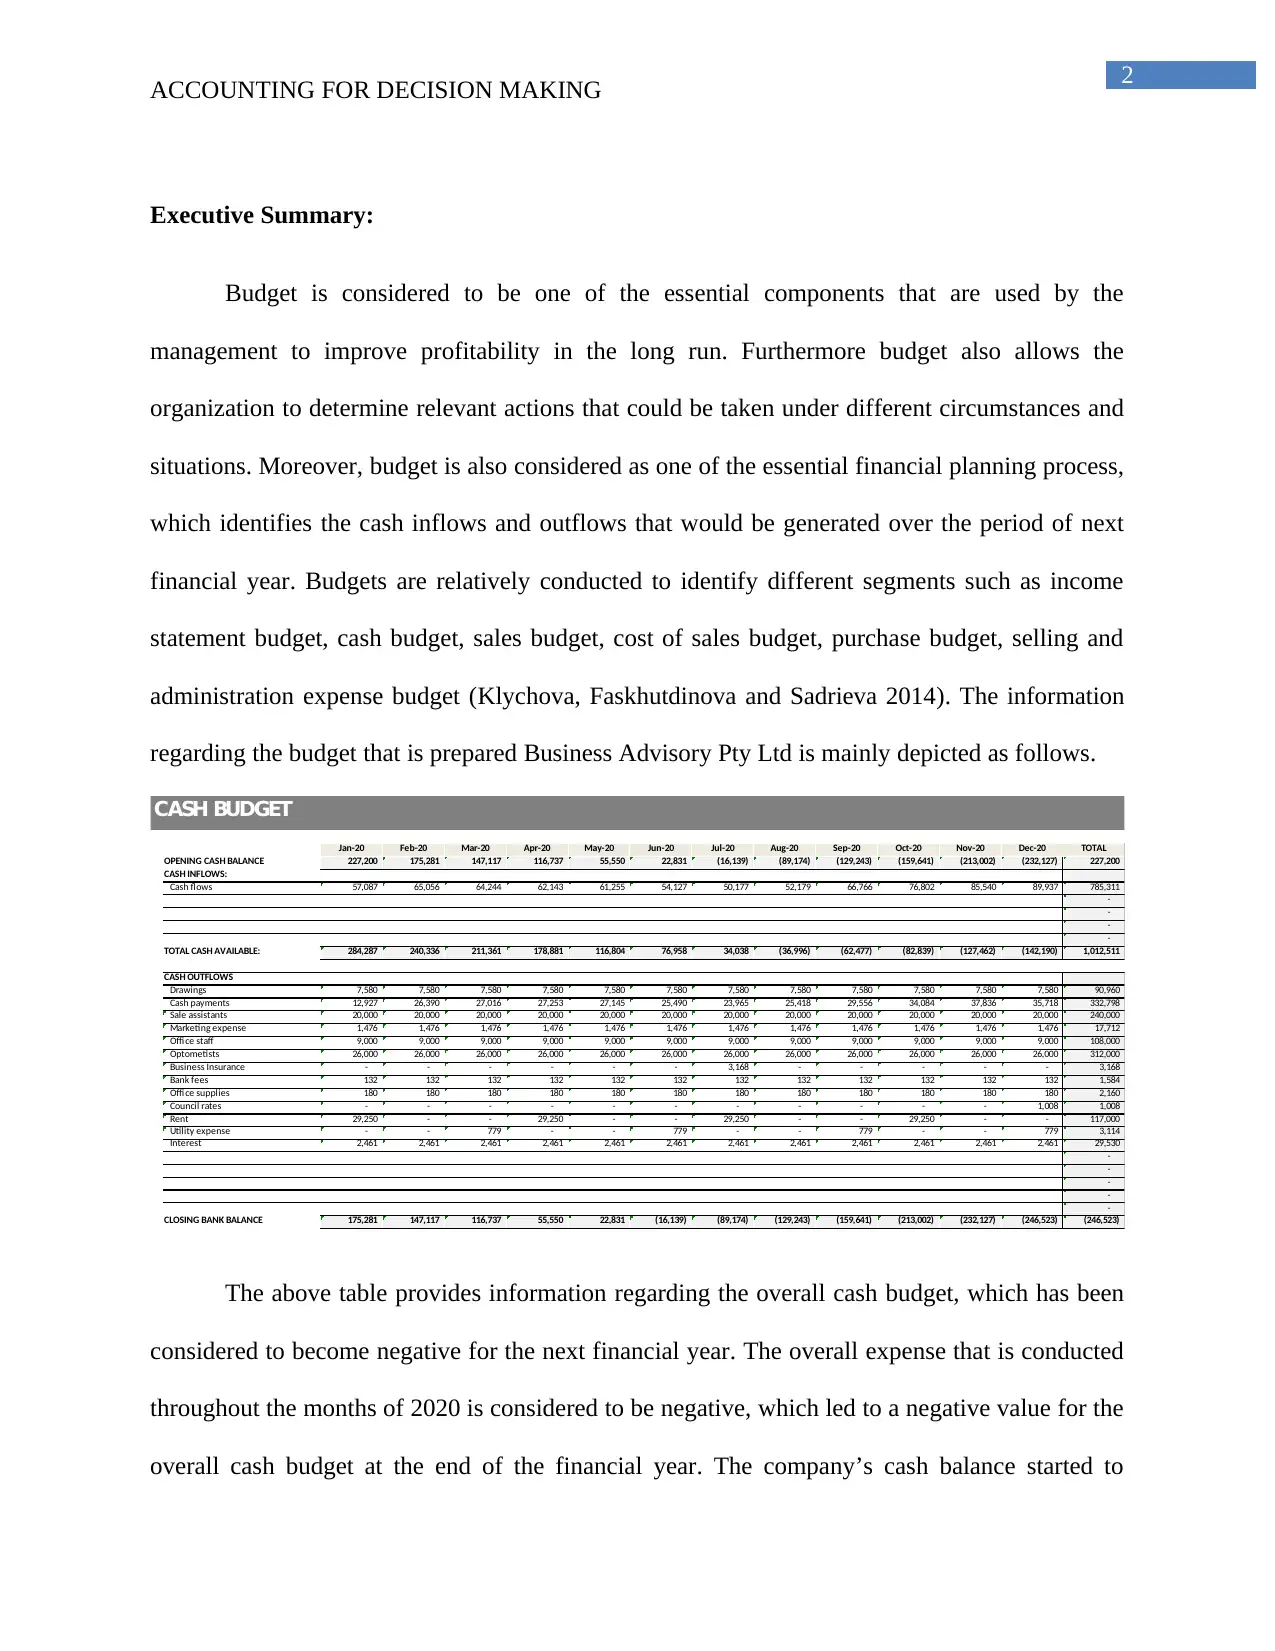
Executive Summary:
Budget is considered to be one of the essential components that are used by the
management to improve profitability in the long run. Furthermore budget also allows the
organization to determine relevant actions that could be taken under different circumstances and
situations. Moreover, budget is also considered as one of the essential financial planning process,
which identifies the cash inflows and outflows that would be generated over the period of next
financial year. Budgets are relatively conducted to identify different segments such as income
statement budget, cash budget, sales budget, cost of sales budget, purchase budget, selling and
administration expense budget (Klychova, Faskhutdinova and Sadrieva 2014). The information
regarding the budget that is prepared Business Advisory Pty Ltd is mainly depicted as follows.
Jan-20 Feb-20 Mar-20 Apr-20 May-20 Jun-20 Jul-20 Aug-20 Sep-20 Oct-20 Nov-20 Dec-20 TOTAL
OPENING CASH BALANCE 227,200 175,281 147,117 116,737 55,550 22,831 (16,139) (89,174) (129,243) (159,641) (213,002) (232,127) 227,200
CASH INFLOWS:
Cash flows 57,087 65,056 64,244 62,143 61,255 54,127 50,177 52,179 66,766 76,802 85,540 89,937 785,311
-
-
-
-
TOTAL CASH AVAILABLE: 284,287 240,336 211,361 178,881 116,804 76,958 34,038 (36,996) (62,477) (82,839) (127,462) (142,190) 1,012,511
CASH OUTFLOWS
Drawings 7,580 7,580 7,580 7,580 7,580 7,580 7,580 7,580 7,580 7,580 7,580 7,580 90,960
Cash payments 12,927 26,390 27,016 27,253 27,145 25,490 23,965 25,418 29,556 34,084 37,836 35,718 332,798
Sale assistants 20,000 20,000 20,000 20,000 20,000 20,000 20,000 20,000 20,000 20,000 20,000 20,000 240,000
Marketing expense 1,476 1,476 1,476 1,476 1,476 1,476 1,476 1,476 1,476 1,476 1,476 1,476 17,712
Offi ce staff 9,000 9,000 9,000 9,000 9,000 9,000 9,000 9,000 9,000 9,000 9,000 9,000 108,000
Optometists 26,000 26,000 26,000 26,000 26,000 26,000 26,000 26,000 26,000 26,000 26,000 26,000 312,000
Business Insurance - - - - - - 3,168 - - - - - 3,168
Bank fees 132 132 132 132 132 132 132 132 132 132 132 132 1,584
Offi ce supplies 180 180 180 180 180 180 180 180 180 180 180 180 2,160
Council rates - - - - - - - - - - - 1,008 1,008
Rent 29,250 - - 29,250 - - 29,250 - - 29,250 - - 117,000
Utility expense - - 779 - - 779 - - 779 - - 779 3,114
Interest 2,461 2,461 2,461 2,461 2,461 2,461 2,461 2,461 2,461 2,461 2,461 2,461 29,530
-
-
-
-
-
CLOSING BANK BALANCE 175,281 147,117 116,737 55,550 22,831 (16,139) (89,174) (129,243) (159,641) (213,002) (232,127) (246,523) (246,523)
CASH BUDGET
The above table provides information regarding the overall cash budget, which has been
considered to become negative for the next financial year. The overall expense that is conducted
throughout the months of 2020 is considered to be negative, which led to a negative value for the
overall cash budget at the end of the financial year. The company’s cash balance started to
ACCOUNTING FOR DECISION MAKING
Executive Summary:
Budget is considered to be one of the essential components that are used by the
management to improve profitability in the long run. Furthermore budget also allows the
organization to determine relevant actions that could be taken under different circumstances and
situations. Moreover, budget is also considered as one of the essential financial planning process,
which identifies the cash inflows and outflows that would be generated over the period of next
financial year. Budgets are relatively conducted to identify different segments such as income
statement budget, cash budget, sales budget, cost of sales budget, purchase budget, selling and
administration expense budget (Klychova, Faskhutdinova and Sadrieva 2014). The information
regarding the budget that is prepared Business Advisory Pty Ltd is mainly depicted as follows.
Jan-20 Feb-20 Mar-20 Apr-20 May-20 Jun-20 Jul-20 Aug-20 Sep-20 Oct-20 Nov-20 Dec-20 TOTAL
OPENING CASH BALANCE 227,200 175,281 147,117 116,737 55,550 22,831 (16,139) (89,174) (129,243) (159,641) (213,002) (232,127) 227,200
CASH INFLOWS:
Cash flows 57,087 65,056 64,244 62,143 61,255 54,127 50,177 52,179 66,766 76,802 85,540 89,937 785,311
-
-
-
-
TOTAL CASH AVAILABLE: 284,287 240,336 211,361 178,881 116,804 76,958 34,038 (36,996) (62,477) (82,839) (127,462) (142,190) 1,012,511
CASH OUTFLOWS
Drawings 7,580 7,580 7,580 7,580 7,580 7,580 7,580 7,580 7,580 7,580 7,580 7,580 90,960
Cash payments 12,927 26,390 27,016 27,253 27,145 25,490 23,965 25,418 29,556 34,084 37,836 35,718 332,798
Sale assistants 20,000 20,000 20,000 20,000 20,000 20,000 20,000 20,000 20,000 20,000 20,000 20,000 240,000
Marketing expense 1,476 1,476 1,476 1,476 1,476 1,476 1,476 1,476 1,476 1,476 1,476 1,476 17,712
Offi ce staff 9,000 9,000 9,000 9,000 9,000 9,000 9,000 9,000 9,000 9,000 9,000 9,000 108,000
Optometists 26,000 26,000 26,000 26,000 26,000 26,000 26,000 26,000 26,000 26,000 26,000 26,000 312,000
Business Insurance - - - - - - 3,168 - - - - - 3,168
Bank fees 132 132 132 132 132 132 132 132 132 132 132 132 1,584
Offi ce supplies 180 180 180 180 180 180 180 180 180 180 180 180 2,160
Council rates - - - - - - - - - - - 1,008 1,008
Rent 29,250 - - 29,250 - - 29,250 - - 29,250 - - 117,000
Utility expense - - 779 - - 779 - - 779 - - 779 3,114
Interest 2,461 2,461 2,461 2,461 2,461 2,461 2,461 2,461 2,461 2,461 2,461 2,461 29,530
-
-
-
-
-
CLOSING BANK BALANCE 175,281 147,117 116,737 55,550 22,831 (16,139) (89,174) (129,243) (159,641) (213,002) (232,127) (246,523) (246,523)
CASH BUDGET
The above table provides information regarding the overall cash budget, which has been
considered to become negative for the next financial year. The overall expense that is conducted
throughout the months of 2020 is considered to be negative, which led to a negative value for the
overall cash budget at the end of the financial year. The company’s cash balance started to
⊘ This is a preview!⊘
Do you want full access?
Subscribe today to unlock all pages.
Trusted by 1+ million students worldwide
3
ACCOUNTING FOR DECISION MAKING
become negative in June, due to the high level of expenses that was conducted during the
previous months on staff salaries and other components.
Jan-20 Feb-20 Mar-20 Apr-20 May-20 Jun-20 Jul-20 Aug-20 Sep-20 Oct-20 Nov-20 Dec-20 TOTAL
TOTAL Sales Revenue ($) 52,305.0 57,695.0 54,340.0 50,985.0 49,775.0 43,560.0 39,847.5 40,687.5 55,020.0 63,840.0 70,612.5 74,287.5 652,955.0$
TOTAL Cost of Sales ($) 19,426 21,428 20,922 20,416 20,284 17,842 16,842 17,829 22,680 25,914 28,791 30,114 262,488.0$
Gross Profit 32,879.0$ 36,267.0$ 33,418.0$ 30,569.0$ 29,491.0$ 25,718.0$ 23,005.5$ 22,858.5$ 32,340.0$ 37,926.0$ 41,821.5$ 44,173.5$ 390,467.0$
Other Income:
TOTAL Service Revenue ($) 7,920.0 8,730.0 9,810.0 10,890.0 11,340.0 10,170.0 9,982.5 11,467.5 12,622.5 13,777.5 15,510.0 16,005.0 138,225.0$
Operating Expenses:
Selling Expenses:
Sale assistants 20,000.0 20,000.0 20,000.0 20,000.0 20,000.0 20,000.0 20,000.0 20,000.0 20,000.0 20,000.0 20,000.0 20,000.0 240,000.0$
Marketing expense 1,476.0 1,476.0 1,476.0 1,476.0 1,476.0 1,476.0 1,476.0 1,476.0 1,476.0 1,476.0 1,476.0 1,476.0 17,712.0$
-$
-$
-$
-$
-$
-$
-$
-$
-$
-$
-$
General & Administrative Expenses:
Offi ce staff 9,000.0 9,000.0 9,000.0 9,000.0 9,000.0 9,000.0 9,000.0 9,000.0 9,000.0 9,000.0 9,000.0 9,000.0 108,000.0$
Optometists 26,000.0 26,000.0 26,000.0 26,000.0 26,000.0 26,000.0 26,000.0 26,000.0 26,000.0 26,000.0 26,000.0 26,000.0 312,000.0$
Business Insurance - - - - - - 3,168.0 - - - - - 3,168.0$
Bank fees 132.0 132.0 132.0 132.0 132.0 132.0 132.0 132.0 132.0 132.0 132.0 132.0 1,584.0$
Offi ce supplies 180.0 180.0 180.0 180.0 180.0 180.0 180.0 180.0 180.0 180.0 180.0 180.0 2,160.0$
Council rates - - - - - - - - - - - 1,008.0 1,008.0$
Rent 29,250.0 - - 29,250.0 - - 29,250.0 - - 29,250.0 - - 117,000.0$
Utility expense - - 778.5 - - 778.5 - - 778.5 - - 778.5 3,114.0$
Dep-optometry 230.0 230.0 230.0 230.0 230.0 230.0 230.0 230.0 230.0 230.0 230.0 230.0 2,760.0$
Dep-Other offi ce equipment 512.0 512.0 512.0 512.0 512.0 512.0 512.0 512.0 512.0 512.0 512.0 512.0 6,144.0$
Dep-Shop-fittings 547.0 547.0 547.0 547.0 547.0 547.0 547.0 547.0 547.0 547.0 547.0 547.0 6,564.0$
Interest 2,460.8 2,460.8 2,460.8 2,460.8 2,460.8 2,460.8 2,460.8 2,460.8 2,460.8 2,460.8 2,460.8 2,460.8 29,529.8$
-$
Total Operating Expense 89,787.8$ 60,537.8$ 61,316.3$ 89,787.8$ 60,537.8$ 61,316.3$ 92,955.8$ 60,537.8$ 61,316.3$ 89,787.8$ 60,537.8$ 62,324.3$ 850,743.8$
Net Operating Profit 48,988.8-$ 15,540.8-$ 18,088.3-$ 48,328.8-$ 19,706.8-$ 25,428.3-$ 59,967.8-$ 26,211.8-$ 16,353.8-$ 38,084.3-$ 3,206.3-$ 2,145.8-$ 322,051.8-$
Non-Operating Income and Expenses
Profit (Loss) before income tax 48,989-$ 15,541-$ 18,088-$ 48,329-$ 19,707-$ 25,428-$ 59,968-$ 26,212-$ 16,354-$ 38,084-$ 3,206-$ 2,146-$ 322,052-$
BUDGETED INCOME STATEMENT
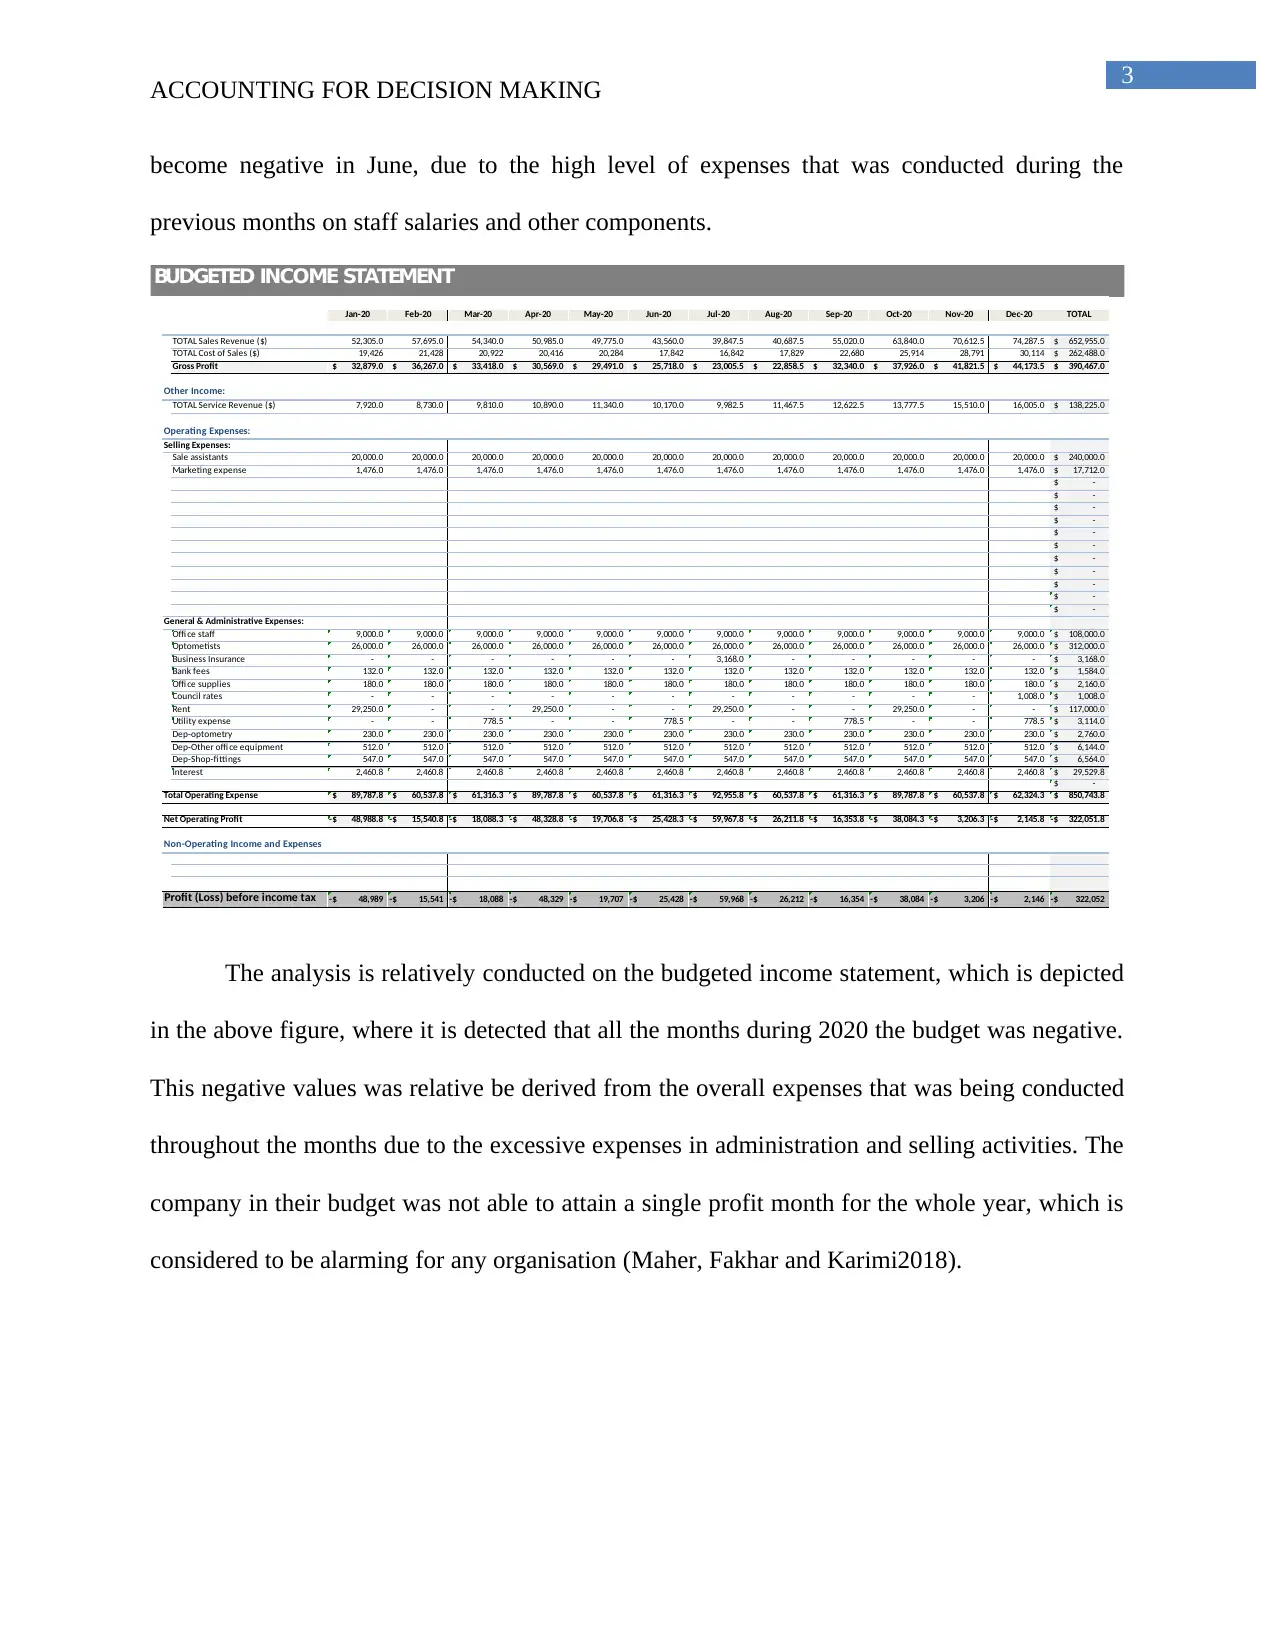
The analysis is relatively conducted on the budgeted income statement, which is depicted
in the above figure, where it is detected that all the months during 2020 the budget was negative.
This negative values was relative be derived from the overall expenses that was being conducted
throughout the months due to the excessive expenses in administration and selling activities. The
company in their budget was not able to attain a single profit month for the whole year, which is
considered to be alarming for any organisation (Maher, Fakhar and Karimi2018).
ACCOUNTING FOR DECISION MAKING
become negative in June, due to the high level of expenses that was conducted during the
previous months on staff salaries and other components.
Jan-20 Feb-20 Mar-20 Apr-20 May-20 Jun-20 Jul-20 Aug-20 Sep-20 Oct-20 Nov-20 Dec-20 TOTAL
TOTAL Sales Revenue ($) 52,305.0 57,695.0 54,340.0 50,985.0 49,775.0 43,560.0 39,847.5 40,687.5 55,020.0 63,840.0 70,612.5 74,287.5 652,955.0$
TOTAL Cost of Sales ($) 19,426 21,428 20,922 20,416 20,284 17,842 16,842 17,829 22,680 25,914 28,791 30,114 262,488.0$
Gross Profit 32,879.0$ 36,267.0$ 33,418.0$ 30,569.0$ 29,491.0$ 25,718.0$ 23,005.5$ 22,858.5$ 32,340.0$ 37,926.0$ 41,821.5$ 44,173.5$ 390,467.0$
Other Income:
TOTAL Service Revenue ($) 7,920.0 8,730.0 9,810.0 10,890.0 11,340.0 10,170.0 9,982.5 11,467.5 12,622.5 13,777.5 15,510.0 16,005.0 138,225.0$
Operating Expenses:
Selling Expenses:
Sale assistants 20,000.0 20,000.0 20,000.0 20,000.0 20,000.0 20,000.0 20,000.0 20,000.0 20,000.0 20,000.0 20,000.0 20,000.0 240,000.0$
Marketing expense 1,476.0 1,476.0 1,476.0 1,476.0 1,476.0 1,476.0 1,476.0 1,476.0 1,476.0 1,476.0 1,476.0 1,476.0 17,712.0$
-$
-$
-$
-$
-$
-$
-$
-$
-$
-$
-$
General & Administrative Expenses:
Offi ce staff 9,000.0 9,000.0 9,000.0 9,000.0 9,000.0 9,000.0 9,000.0 9,000.0 9,000.0 9,000.0 9,000.0 9,000.0 108,000.0$
Optometists 26,000.0 26,000.0 26,000.0 26,000.0 26,000.0 26,000.0 26,000.0 26,000.0 26,000.0 26,000.0 26,000.0 26,000.0 312,000.0$
Business Insurance - - - - - - 3,168.0 - - - - - 3,168.0$
Bank fees 132.0 132.0 132.0 132.0 132.0 132.0 132.0 132.0 132.0 132.0 132.0 132.0 1,584.0$
Offi ce supplies 180.0 180.0 180.0 180.0 180.0 180.0 180.0 180.0 180.0 180.0 180.0 180.0 2,160.0$
Council rates - - - - - - - - - - - 1,008.0 1,008.0$
Rent 29,250.0 - - 29,250.0 - - 29,250.0 - - 29,250.0 - - 117,000.0$
Utility expense - - 778.5 - - 778.5 - - 778.5 - - 778.5 3,114.0$
Dep-optometry 230.0 230.0 230.0 230.0 230.0 230.0 230.0 230.0 230.0 230.0 230.0 230.0 2,760.0$
Dep-Other offi ce equipment 512.0 512.0 512.0 512.0 512.0 512.0 512.0 512.0 512.0 512.0 512.0 512.0 6,144.0$
Dep-Shop-fittings 547.0 547.0 547.0 547.0 547.0 547.0 547.0 547.0 547.0 547.0 547.0 547.0 6,564.0$
Interest 2,460.8 2,460.8 2,460.8 2,460.8 2,460.8 2,460.8 2,460.8 2,460.8 2,460.8 2,460.8 2,460.8 2,460.8 29,529.8$
-$
Total Operating Expense 89,787.8$ 60,537.8$ 61,316.3$ 89,787.8$ 60,537.8$ 61,316.3$ 92,955.8$ 60,537.8$ 61,316.3$ 89,787.8$ 60,537.8$ 62,324.3$ 850,743.8$
Net Operating Profit 48,988.8-$ 15,540.8-$ 18,088.3-$ 48,328.8-$ 19,706.8-$ 25,428.3-$ 59,967.8-$ 26,211.8-$ 16,353.8-$ 38,084.3-$ 3,206.3-$ 2,145.8-$ 322,051.8-$
Non-Operating Income and Expenses
Profit (Loss) before income tax 48,989-$ 15,541-$ 18,088-$ 48,329-$ 19,707-$ 25,428-$ 59,968-$ 26,212-$ 16,354-$ 38,084-$ 3,206-$ 2,146-$ 322,052-$
BUDGETED INCOME STATEMENT
The analysis is relatively conducted on the budgeted income statement, which is depicted
in the above figure, where it is detected that all the months during 2020 the budget was negative.
This negative values was relative be derived from the overall expenses that was being conducted
throughout the months due to the excessive expenses in administration and selling activities. The
company in their budget was not able to attain a single profit month for the whole year, which is
considered to be alarming for any organisation (Maher, Fakhar and Karimi2018).
Paraphrase This Document
Need a fresh take? Get an instant paraphrase of this document with our AI Paraphraser
4
ACCOUNTING FOR DECISION MAKING
Jan-20 Feb-20 Mar-20 Apr-20 May-20 Jun-20 Jul-20 Aug-20 Sep-20 Oct-20 Nov-20 Dec-20 TOTAL
Expected Sales 182 200 173 145 134 116 95 83 143 174 190 204 1838
x Selling Price per Unit 200.00$ 200.00$ 200.00$ 200.00$ 200.00$ 200.00$ 200.00$ 200.00$ 200.00$ 200.00$ 200.00$ 200.00$
Sales Revenue ($) 36,300.00$ 40,040.00$ 34,540.00$ 29,040.00$ 26,840.00$ 23,100.00$ 18,900.00$ 16,590.00$ 28,560.00$ 34,860.00$ 38,010.00$ 40,740.00$ 367,520.00$
Expected Sales 107 118 132 146 153 136 140 161 176 193 217 224 1903
x Selling Price per Unit 150.00$ 150.00$ 150.00$ 150.00$ 150.00$ 150.00$ 150.00$ 150.00$ 150.00$ 150.00$ 150.00$ 150.00$
Sales Revenue ($) 16,005.00$ 17,655.00$ 19,800.00$ 21,945.00$ 22,935.00$ 20,460.00$ 20,947.50$ 24,097.50$ 26,460.00$ 28,980.00$ 32,602.50$ 33,547.50$ 285,435.00$
TOTAL Sales Revenue ($) 52,305.00$ 57,695.00$ 54,340.00$ 50,985.00$ 49,775.00$ 43,560.00$ 39,847.50$ 40,687.50$ 55,020.00$ 63,840.00$ 70,612.50$ 74,287.50$ 652,955.00$
Expected Sales 106 116 131 145 151 136 133 153 168 184 207 213 1843
x Selling Price per Unit 75.00$ 75.00$ 75.00$ 75.00$ 75.00$ 75.00$ 75.00$ 75.00$ 75.00$ 75.00$ 75.00$ 75.00$
TOTAL Service Revenue ($) 7,920.00$ 8,730.00$ 9,810.00$ 10,890.00$ 11,340.00$ 10,170.00$ 9,982.50$ 11,467.50$ 12,622.50$ 13,777.50$ 15,510.00$ 16,005.00$ 138,225.00$
Sales Budget
Sunglasses
Prescription
Glasses
Eye-Tests
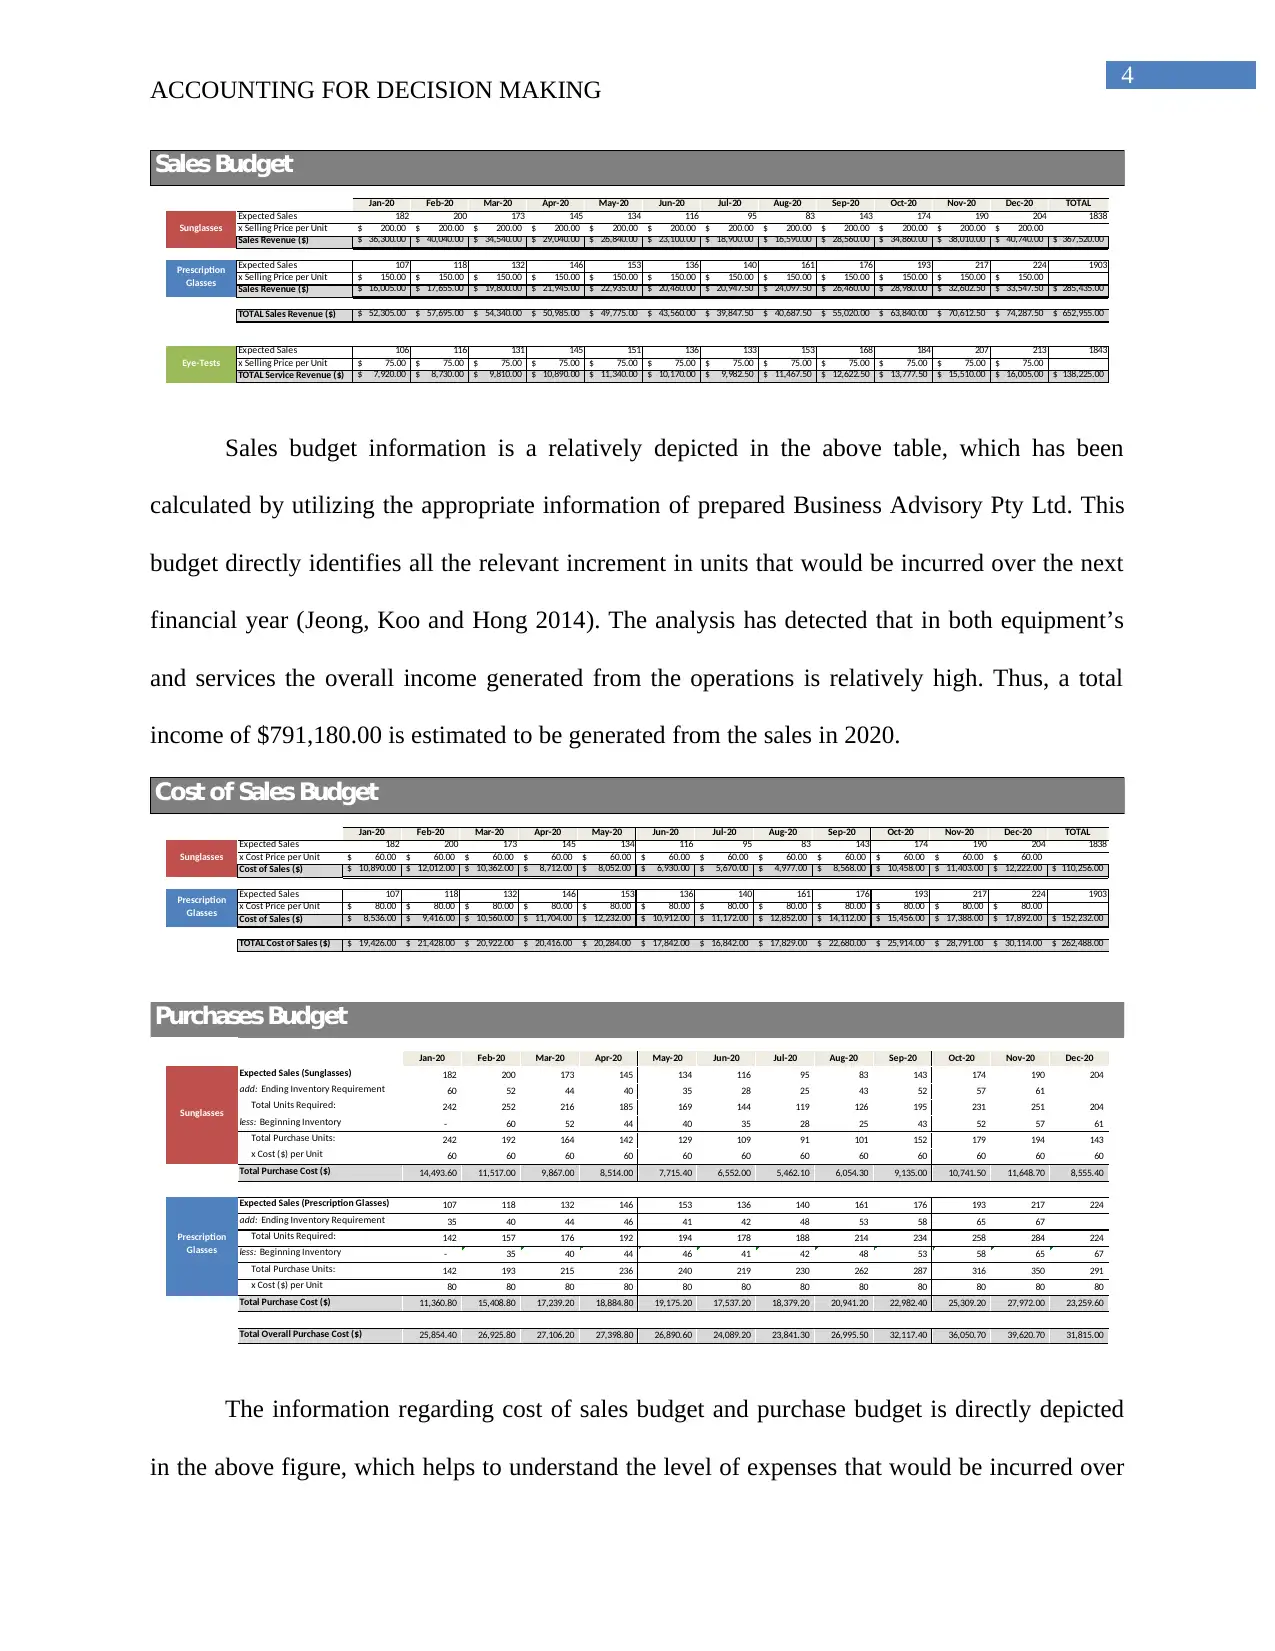
Sales budget information is a relatively depicted in the above table, which has been
calculated by utilizing the appropriate information of prepared Business Advisory Pty Ltd. This
budget directly identifies all the relevant increment in units that would be incurred over the next
financial year (Jeong, Koo and Hong 2014). The analysis has detected that in both equipment’s
and services the overall income generated from the operations is relatively high. Thus, a total
income of $791,180.00 is estimated to be generated from the sales in 2020.
Jan-20 Feb-20 Mar-20 Apr-20 May-20 Jun-20 Jul-20 Aug-20 Sep-20 Oct-20 Nov-20 Dec-20 TOTAL
Expected Sales 182 200 173 145 134 116 95 83 143 174 190 204 1838
x Cost Price per Unit 60.00$ 60.00$ 60.00$ 60.00$ 60.00$ 60.00$ 60.00$ 60.00$ 60.00$ 60.00$ 60.00$ 60.00$
Cost of Sales ($) 10,890.00$ 12,012.00$ 10,362.00$ 8,712.00$ 8,052.00$ 6,930.00$ 5,670.00$ 4,977.00$ 8,568.00$ 10,458.00$ 11,403.00$ 12,222.00$ 110,256.00$
Expected Sales 107 118 132 146 153 136 140 161 176 193 217 224 1903
x Cost Price per Unit 80.00$ 80.00$ 80.00$ 80.00$ 80.00$ 80.00$ 80.00$ 80.00$ 80.00$ 80.00$ 80.00$ 80.00$
Cost of Sales ($) 8,536.00$ 9,416.00$ 10,560.00$ 11,704.00$ 12,232.00$ 10,912.00$ 11,172.00$ 12,852.00$ 14,112.00$ 15,456.00$ 17,388.00$ 17,892.00$ 152,232.00$
TOTAL Cost of Sales ($) 19,426.00$ 21,428.00$ 20,922.00$ 20,416.00$ 20,284.00$ 17,842.00$ 16,842.00$ 17,829.00$ 22,680.00$ 25,914.00$ 28,791.00$ 30,114.00$ 262,488.00$
Cost of Sales Budget
Sunglasses
Prescription
Glasses
Jan-20 Feb-20 Mar-20 Apr-20 May-20 Jun-20 Jul-20 Aug-20 Sep-20 Oct-20 Nov-20 Dec-20
Expected Sales (Sunglasses) 182 200 173 145 134 116 95 83 143 174 190 204
add: Ending Inventory Requirement 60 52 44 40 35 28 25 43 52 57 61
Total Units Required: 242 252 216 185 169 144 119 126 195 231 251 204
less: Beginning Inventory - 60 52 44 40 35 28 25 43 52 57 61
Total Purchase Units: 242 192 164 142 129 109 91 101 152 179 194 143
x Cost ($) per Unit 60 60 60 60 60 60 60 60 60 60 60 60
Total Purchase Cost ($) 14,493.60 11,517.00 9,867.00 8,514.00 7,715.40 6,552.00 5,462.10 6,054.30 9,135.00 10,741.50 11,648.70 8,555.40
Expected Sales (Prescription Glasses) 107 118 132 146 153 136 140 161 176 193 217 224
add: Ending Inventory Requirement 35 40 44 46 41 42 48 53 58 65 67
Total Units Required: 142 157 176 192 194 178 188 214 234 258 284 224
less: Beginning Inventory - 35 40 44 46 41 42 48 53 58 65 67
Total Purchase Units: 142 193 215 236 240 219 230 262 287 316 350 291
x Cost ($) per Unit 80 80 80 80 80 80 80 80 80 80 80 80
Total Purchase Cost ($) 11,360.80 15,408.80 17,239.20 18,884.80 19,175.20 17,537.20 18,379.20 20,941.20 22,982.40 25,309.20 27,972.00 23,259.60
Total Overall Purchase Cost ($) 25,854.40 26,925.80 27,106.20 27,398.80 26,890.60 24,089.20 23,841.30 26,995.50 32,117.40 36,050.70 39,620.70 31,815.00
Sunglasses
Prescription
Glasses
Purchases Budget
The information regarding cost of sales budget and purchase budget is directly depicted
in the above figure, which helps to understand the level of expenses that would be incurred over
ACCOUNTING FOR DECISION MAKING
Jan-20 Feb-20 Mar-20 Apr-20 May-20 Jun-20 Jul-20 Aug-20 Sep-20 Oct-20 Nov-20 Dec-20 TOTAL
Expected Sales 182 200 173 145 134 116 95 83 143 174 190 204 1838
x Selling Price per Unit 200.00$ 200.00$ 200.00$ 200.00$ 200.00$ 200.00$ 200.00$ 200.00$ 200.00$ 200.00$ 200.00$ 200.00$
Sales Revenue ($) 36,300.00$ 40,040.00$ 34,540.00$ 29,040.00$ 26,840.00$ 23,100.00$ 18,900.00$ 16,590.00$ 28,560.00$ 34,860.00$ 38,010.00$ 40,740.00$ 367,520.00$
Expected Sales 107 118 132 146 153 136 140 161 176 193 217 224 1903
x Selling Price per Unit 150.00$ 150.00$ 150.00$ 150.00$ 150.00$ 150.00$ 150.00$ 150.00$ 150.00$ 150.00$ 150.00$ 150.00$
Sales Revenue ($) 16,005.00$ 17,655.00$ 19,800.00$ 21,945.00$ 22,935.00$ 20,460.00$ 20,947.50$ 24,097.50$ 26,460.00$ 28,980.00$ 32,602.50$ 33,547.50$ 285,435.00$
TOTAL Sales Revenue ($) 52,305.00$ 57,695.00$ 54,340.00$ 50,985.00$ 49,775.00$ 43,560.00$ 39,847.50$ 40,687.50$ 55,020.00$ 63,840.00$ 70,612.50$ 74,287.50$ 652,955.00$
Expected Sales 106 116 131 145 151 136 133 153 168 184 207 213 1843
x Selling Price per Unit 75.00$ 75.00$ 75.00$ 75.00$ 75.00$ 75.00$ 75.00$ 75.00$ 75.00$ 75.00$ 75.00$ 75.00$
TOTAL Service Revenue ($) 7,920.00$ 8,730.00$ 9,810.00$ 10,890.00$ 11,340.00$ 10,170.00$ 9,982.50$ 11,467.50$ 12,622.50$ 13,777.50$ 15,510.00$ 16,005.00$ 138,225.00$
Sales Budget
Sunglasses
Prescription
Glasses
Eye-Tests
Sales budget information is a relatively depicted in the above table, which has been
calculated by utilizing the appropriate information of prepared Business Advisory Pty Ltd. This
budget directly identifies all the relevant increment in units that would be incurred over the next
financial year (Jeong, Koo and Hong 2014). The analysis has detected that in both equipment’s
and services the overall income generated from the operations is relatively high. Thus, a total
income of $791,180.00 is estimated to be generated from the sales in 2020.
Jan-20 Feb-20 Mar-20 Apr-20 May-20 Jun-20 Jul-20 Aug-20 Sep-20 Oct-20 Nov-20 Dec-20 TOTAL
Expected Sales 182 200 173 145 134 116 95 83 143 174 190 204 1838
x Cost Price per Unit 60.00$ 60.00$ 60.00$ 60.00$ 60.00$ 60.00$ 60.00$ 60.00$ 60.00$ 60.00$ 60.00$ 60.00$
Cost of Sales ($) 10,890.00$ 12,012.00$ 10,362.00$ 8,712.00$ 8,052.00$ 6,930.00$ 5,670.00$ 4,977.00$ 8,568.00$ 10,458.00$ 11,403.00$ 12,222.00$ 110,256.00$
Expected Sales 107 118 132 146 153 136 140 161 176 193 217 224 1903
x Cost Price per Unit 80.00$ 80.00$ 80.00$ 80.00$ 80.00$ 80.00$ 80.00$ 80.00$ 80.00$ 80.00$ 80.00$ 80.00$
Cost of Sales ($) 8,536.00$ 9,416.00$ 10,560.00$ 11,704.00$ 12,232.00$ 10,912.00$ 11,172.00$ 12,852.00$ 14,112.00$ 15,456.00$ 17,388.00$ 17,892.00$ 152,232.00$
TOTAL Cost of Sales ($) 19,426.00$ 21,428.00$ 20,922.00$ 20,416.00$ 20,284.00$ 17,842.00$ 16,842.00$ 17,829.00$ 22,680.00$ 25,914.00$ 28,791.00$ 30,114.00$ 262,488.00$
Cost of Sales Budget
Sunglasses
Prescription
Glasses
Jan-20 Feb-20 Mar-20 Apr-20 May-20 Jun-20 Jul-20 Aug-20 Sep-20 Oct-20 Nov-20 Dec-20
Expected Sales (Sunglasses) 182 200 173 145 134 116 95 83 143 174 190 204
add: Ending Inventory Requirement 60 52 44 40 35 28 25 43 52 57 61
Total Units Required: 242 252 216 185 169 144 119 126 195 231 251 204
less: Beginning Inventory - 60 52 44 40 35 28 25 43 52 57 61
Total Purchase Units: 242 192 164 142 129 109 91 101 152 179 194 143
x Cost ($) per Unit 60 60 60 60 60 60 60 60 60 60 60 60
Total Purchase Cost ($) 14,493.60 11,517.00 9,867.00 8,514.00 7,715.40 6,552.00 5,462.10 6,054.30 9,135.00 10,741.50 11,648.70 8,555.40
Expected Sales (Prescription Glasses) 107 118 132 146 153 136 140 161 176 193 217 224
add: Ending Inventory Requirement 35 40 44 46 41 42 48 53 58 65 67
Total Units Required: 142 157 176 192 194 178 188 214 234 258 284 224
less: Beginning Inventory - 35 40 44 46 41 42 48 53 58 65 67
Total Purchase Units: 142 193 215 236 240 219 230 262 287 316 350 291
x Cost ($) per Unit 80 80 80 80 80 80 80 80 80 80 80 80
Total Purchase Cost ($) 11,360.80 15,408.80 17,239.20 18,884.80 19,175.20 17,537.20 18,379.20 20,941.20 22,982.40 25,309.20 27,972.00 23,259.60
Total Overall Purchase Cost ($) 25,854.40 26,925.80 27,106.20 27,398.80 26,890.60 24,089.20 23,841.30 26,995.50 32,117.40 36,050.70 39,620.70 31,815.00
Sunglasses
Prescription
Glasses
Purchases Budget
The information regarding cost of sales budget and purchase budget is directly depicted
in the above figure, which helps to understand the level of expenses that would be incurred over
5
ACCOUNTING FOR DECISION MAKING
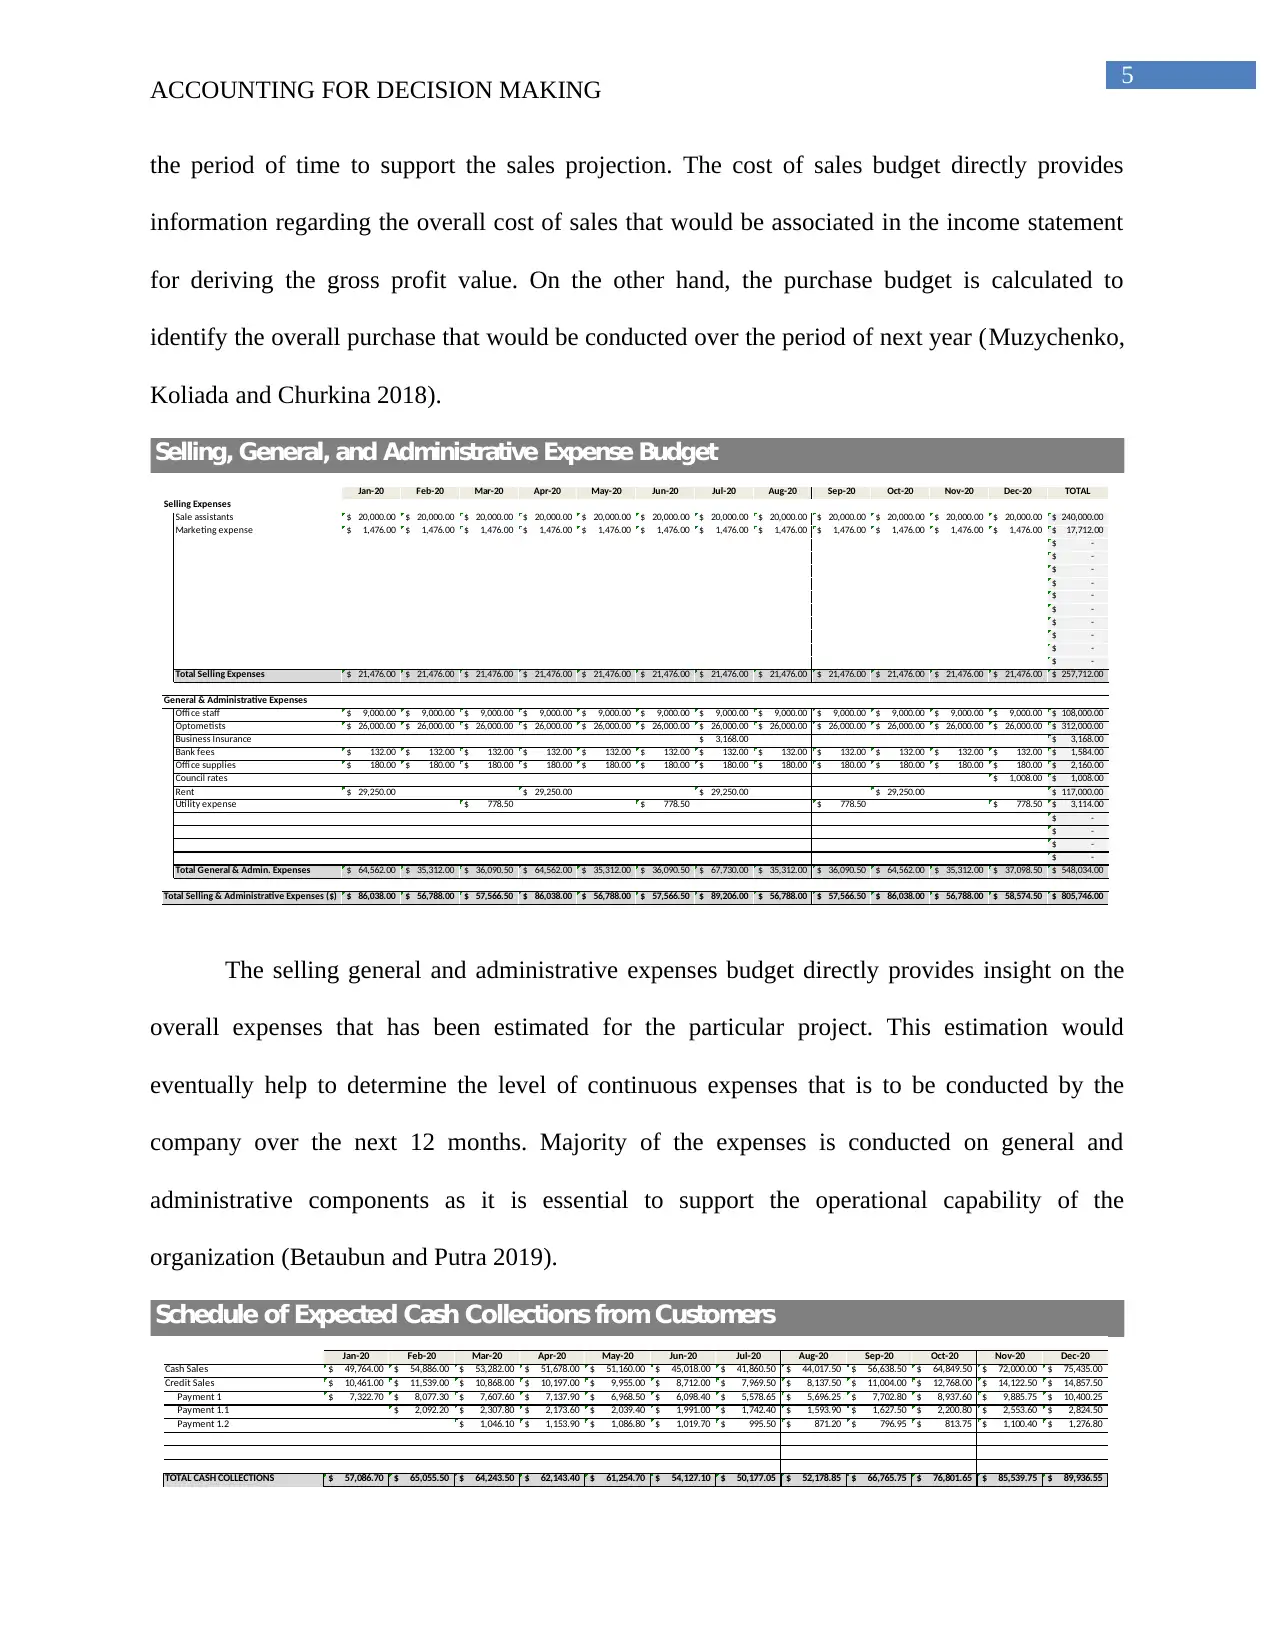
the period of time to support the sales projection. The cost of sales budget directly provides
information regarding the overall cost of sales that would be associated in the income statement
for deriving the gross profit value. On the other hand, the purchase budget is calculated to
identify the overall purchase that would be conducted over the period of next year (Muzychenko,
Koliada and Churkina 2018).
Jan-20 Feb-20 Mar-20 Apr-20 May-20 Jun-20 Jul-20 Aug-20 Sep-20 Oct-20 Nov-20 Dec-20 TOTAL
Sale assistants 20,000.00$ 20,000.00$ 20,000.00$ 20,000.00$ 20,000.00$ 20,000.00$ 20,000.00$ 20,000.00$ 20,000.00$ 20,000.00$ 20,000.00$ 20,000.00$ 240,000.00$
Marketing expense 1,476.00$ 1,476.00$ 1,476.00$ 1,476.00$ 1,476.00$ 1,476.00$ 1,476.00$ 1,476.00$ 1,476.00$ 1,476.00$ 1,476.00$ 1,476.00$ 17,712.00$
-$
-$
-$
-$
-$
-$
-$
-$
-$
-$
Total Selling Expenses 21,476.00$ 21,476.00$ 21,476.00$ 21,476.00$ 21,476.00$ 21,476.00$ 21,476.00$ 21,476.00$ 21,476.00$ 21,476.00$ 21,476.00$ 21,476.00$ 257,712.00$
Offi ce staff 9,000.00$ 9,000.00$ 9,000.00$ 9,000.00$ 9,000.00$ 9,000.00$ 9,000.00$ 9,000.00$ 9,000.00$ 9,000.00$ 9,000.00$ 9,000.00$ 108,000.00$
Optometists 26,000.00$ 26,000.00$ 26,000.00$ 26,000.00$ 26,000.00$ 26,000.00$ 26,000.00$ 26,000.00$ 26,000.00$ 26,000.00$ 26,000.00$ 26,000.00$ 312,000.00$
Business Insurance 3,168.00$ 3,168.00$
Bank fees 132.00$ 132.00$ 132.00$ 132.00$ 132.00$ 132.00$ 132.00$ 132.00$ 132.00$ 132.00$ 132.00$ 132.00$ 1,584.00$
Offi ce supplies 180.00$ 180.00$ 180.00$ 180.00$ 180.00$ 180.00$ 180.00$ 180.00$ 180.00$ 180.00$ 180.00$ 180.00$ 2,160.00$
Council rates 1,008.00$ 1,008.00$
Rent 29,250.00$ 29,250.00$ 29,250.00$ 29,250.00$ 117,000.00$
Utility expense 778.50$ 778.50$ 778.50$ 778.50$ 3,114.00$
-$
-$
-$
-$
Total General & Admin. Expenses 64,562.00$ 35,312.00$ 36,090.50$ 64,562.00$ 35,312.00$ 36,090.50$ 67,730.00$ 35,312.00$ 36,090.50$ 64,562.00$ 35,312.00$ 37,098.50$ 548,034.00$
Total Selling & Administrative Expenses ($) 86,038.00$ 56,788.00$ 57,566.50$ 86,038.00$ 56,788.00$ 57,566.50$ 89,206.00$ 56,788.00$ 57,566.50$ 86,038.00$ 56,788.00$ 58,574.50$ 805,746.00$
Selling Expenses
General & Administrative Expenses
Selling, General, and Administrative Expense Budget
The selling general and administrative expenses budget directly provides insight on the
overall expenses that has been estimated for the particular project. This estimation would
eventually help to determine the level of continuous expenses that is to be conducted by the
company over the next 12 months. Majority of the expenses is conducted on general and
administrative components as it is essential to support the operational capability of the
organization (Betaubun and Putra 2019).
Jan-20 Feb-20 Mar-20 Apr-20 May-20 Jun-20 Jul-20 Aug-20 Sep-20 Oct-20 Nov-20 Dec-20
Cash Sales 49,764.00$ 54,886.00$ 53,282.00$ 51,678.00$ 51,160.00$ 45,018.00$ 41,860.50$ 44,017.50$ 56,638.50$ 64,849.50$ 72,000.00$ 75,435.00$
Credit Sales 10,461.00$ 11,539.00$ 10,868.00$ 10,197.00$ 9,955.00$ 8,712.00$ 7,969.50$ 8,137.50$ 11,004.00$ 12,768.00$ 14,122.50$ 14,857.50$
Payment 1 7,322.70$ 8,077.30$ 7,607.60$ 7,137.90$ 6,968.50$ 6,098.40$ 5,578.65$ 5,696.25$ 7,702.80$ 8,937.60$ 9,885.75$ 10,400.25$
Payment 1.1 2,092.20$ 2,307.80$ 2,173.60$ 2,039.40$ 1,991.00$ 1,742.40$ 1,593.90$ 1,627.50$ 2,200.80$ 2,553.60$ 2,824.50$
Payment 1.2 1,046.10$ 1,153.90$ 1,086.80$ 1,019.70$ 995.50$ 871.20$ 796.95$ 813.75$ 1,100.40$ 1,276.80$
TOTAL CASH COLLECTIONS 57,086.70$ 65,055.50$ 64,243.50$ 62,143.40$ 61,254.70$ 54,127.10$ 50,177.05$ 52,178.85$ 66,765.75$ 76,801.65$ 85,539.75$ 89,936.55$
Schedule of Expected Cash Collections from Customers
ACCOUNTING FOR DECISION MAKING
the period of time to support the sales projection. The cost of sales budget directly provides
information regarding the overall cost of sales that would be associated in the income statement
for deriving the gross profit value. On the other hand, the purchase budget is calculated to
identify the overall purchase that would be conducted over the period of next year (Muzychenko,
Koliada and Churkina 2018).
Jan-20 Feb-20 Mar-20 Apr-20 May-20 Jun-20 Jul-20 Aug-20 Sep-20 Oct-20 Nov-20 Dec-20 TOTAL
Sale assistants 20,000.00$ 20,000.00$ 20,000.00$ 20,000.00$ 20,000.00$ 20,000.00$ 20,000.00$ 20,000.00$ 20,000.00$ 20,000.00$ 20,000.00$ 20,000.00$ 240,000.00$
Marketing expense 1,476.00$ 1,476.00$ 1,476.00$ 1,476.00$ 1,476.00$ 1,476.00$ 1,476.00$ 1,476.00$ 1,476.00$ 1,476.00$ 1,476.00$ 1,476.00$ 17,712.00$
-$
-$
-$
-$
-$
-$
-$
-$
-$
-$
Total Selling Expenses 21,476.00$ 21,476.00$ 21,476.00$ 21,476.00$ 21,476.00$ 21,476.00$ 21,476.00$ 21,476.00$ 21,476.00$ 21,476.00$ 21,476.00$ 21,476.00$ 257,712.00$
Offi ce staff 9,000.00$ 9,000.00$ 9,000.00$ 9,000.00$ 9,000.00$ 9,000.00$ 9,000.00$ 9,000.00$ 9,000.00$ 9,000.00$ 9,000.00$ 9,000.00$ 108,000.00$
Optometists 26,000.00$ 26,000.00$ 26,000.00$ 26,000.00$ 26,000.00$ 26,000.00$ 26,000.00$ 26,000.00$ 26,000.00$ 26,000.00$ 26,000.00$ 26,000.00$ 312,000.00$
Business Insurance 3,168.00$ 3,168.00$
Bank fees 132.00$ 132.00$ 132.00$ 132.00$ 132.00$ 132.00$ 132.00$ 132.00$ 132.00$ 132.00$ 132.00$ 132.00$ 1,584.00$
Offi ce supplies 180.00$ 180.00$ 180.00$ 180.00$ 180.00$ 180.00$ 180.00$ 180.00$ 180.00$ 180.00$ 180.00$ 180.00$ 2,160.00$
Council rates 1,008.00$ 1,008.00$
Rent 29,250.00$ 29,250.00$ 29,250.00$ 29,250.00$ 117,000.00$
Utility expense 778.50$ 778.50$ 778.50$ 778.50$ 3,114.00$
-$
-$
-$
-$
Total General & Admin. Expenses 64,562.00$ 35,312.00$ 36,090.50$ 64,562.00$ 35,312.00$ 36,090.50$ 67,730.00$ 35,312.00$ 36,090.50$ 64,562.00$ 35,312.00$ 37,098.50$ 548,034.00$
Total Selling & Administrative Expenses ($) 86,038.00$ 56,788.00$ 57,566.50$ 86,038.00$ 56,788.00$ 57,566.50$ 89,206.00$ 56,788.00$ 57,566.50$ 86,038.00$ 56,788.00$ 58,574.50$ 805,746.00$
Selling Expenses
General & Administrative Expenses
Selling, General, and Administrative Expense Budget
The selling general and administrative expenses budget directly provides insight on the
overall expenses that has been estimated for the particular project. This estimation would
eventually help to determine the level of continuous expenses that is to be conducted by the
company over the next 12 months. Majority of the expenses is conducted on general and
administrative components as it is essential to support the operational capability of the
organization (Betaubun and Putra 2019).
Jan-20 Feb-20 Mar-20 Apr-20 May-20 Jun-20 Jul-20 Aug-20 Sep-20 Oct-20 Nov-20 Dec-20
Cash Sales 49,764.00$ 54,886.00$ 53,282.00$ 51,678.00$ 51,160.00$ 45,018.00$ 41,860.50$ 44,017.50$ 56,638.50$ 64,849.50$ 72,000.00$ 75,435.00$
Credit Sales 10,461.00$ 11,539.00$ 10,868.00$ 10,197.00$ 9,955.00$ 8,712.00$ 7,969.50$ 8,137.50$ 11,004.00$ 12,768.00$ 14,122.50$ 14,857.50$
Payment 1 7,322.70$ 8,077.30$ 7,607.60$ 7,137.90$ 6,968.50$ 6,098.40$ 5,578.65$ 5,696.25$ 7,702.80$ 8,937.60$ 9,885.75$ 10,400.25$
Payment 1.1 2,092.20$ 2,307.80$ 2,173.60$ 2,039.40$ 1,991.00$ 1,742.40$ 1,593.90$ 1,627.50$ 2,200.80$ 2,553.60$ 2,824.50$
Payment 1.2 1,046.10$ 1,153.90$ 1,086.80$ 1,019.70$ 995.50$ 871.20$ 796.95$ 813.75$ 1,100.40$ 1,276.80$
TOTAL CASH COLLECTIONS 57,086.70$ 65,055.50$ 64,243.50$ 62,143.40$ 61,254.70$ 54,127.10$ 50,177.05$ 52,178.85$ 66,765.75$ 76,801.65$ 85,539.75$ 89,936.55$
Schedule of Expected Cash Collections from Customers
⊘ This is a preview!⊘
Do you want full access?
Subscribe today to unlock all pages.
Trusted by 1+ million students worldwide
6
ACCOUNTING FOR DECISION MAKING
Jan-20 Feb-20 Mar-20 Apr-20 May-20 Jun-20 Jul-20 Aug-20 Sep-20 Oct-20 Nov-20 Dec-20
Cash Purchases 12,927.20$ 13,462.90$ 13,553.10$ 13,699.40$ 13,445.30$ 12,044.60$ 11,920.65$ 13,497.75$ 16,058.70$ 18,025.35$ 19,810.35$ 15,907.50$
Credit Purchases 12,927.20$ 13,462.90$ 13,553.10$ 13,699.40$ 13,445.30$ 12,044.60$ 11,920.65$ 13,497.75$ 16,058.70$ 18,025.35$ 19,810.35$
TOTAL CASH PAYMENTS 12,927.20$ 26,390.10$ 27,016.00$ 27,252.50$ 27,144.70$ 25,489.90$ 23,965.25$ 25,418.40$ 29,556.45$ 34,084.05$ 37,835.70$ 35,717.85$
Schedule of Expected Payments to Suppliers
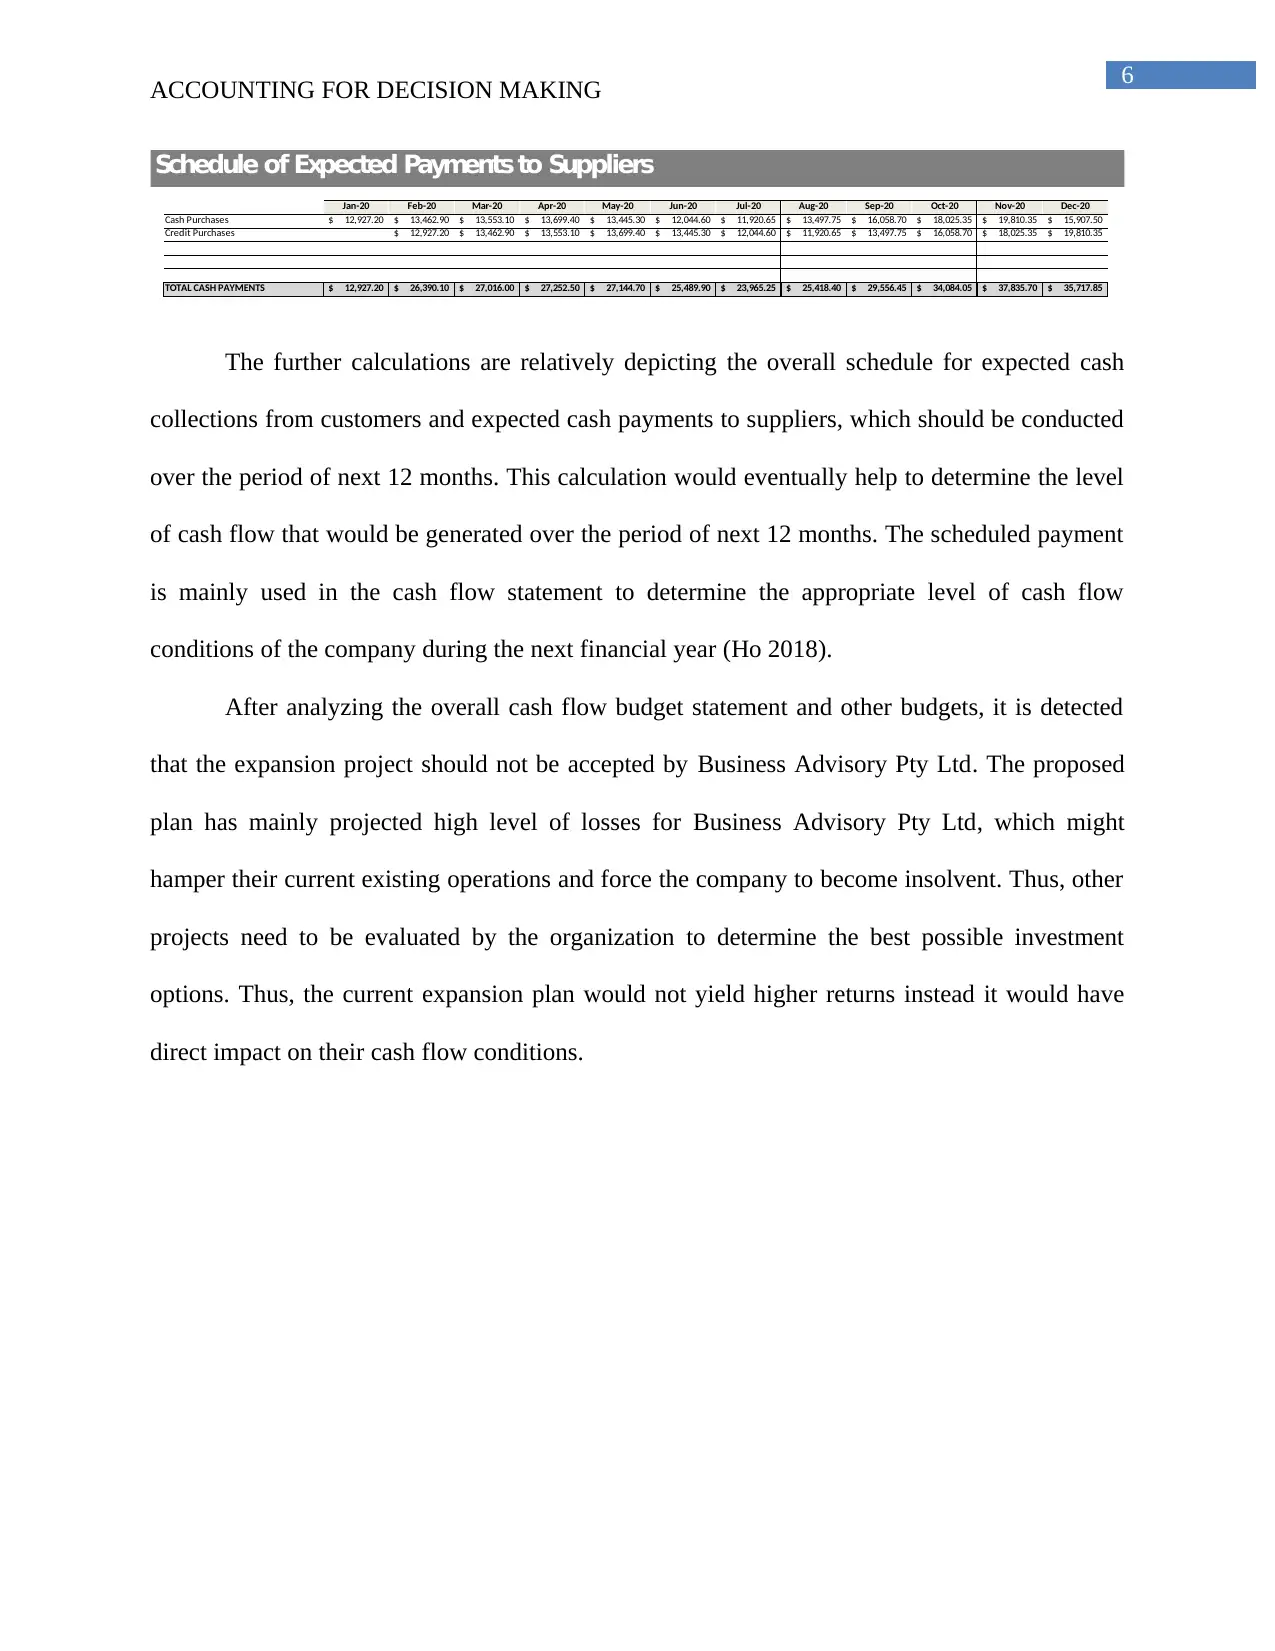
The further calculations are relatively depicting the overall schedule for expected cash
collections from customers and expected cash payments to suppliers, which should be conducted
over the period of next 12 months. This calculation would eventually help to determine the level
of cash flow that would be generated over the period of next 12 months. The scheduled payment
is mainly used in the cash flow statement to determine the appropriate level of cash flow
conditions of the company during the next financial year (Ho 2018).
After analyzing the overall cash flow budget statement and other budgets, it is detected
that the expansion project should not be accepted by Business Advisory Pty Ltd. The proposed
plan has mainly projected high level of losses for Business Advisory Pty Ltd, which might
hamper their current existing operations and force the company to become insolvent. Thus, other
projects need to be evaluated by the organization to determine the best possible investment
options. Thus, the current expansion plan would not yield higher returns instead it would have
direct impact on their cash flow conditions.
ACCOUNTING FOR DECISION MAKING
Jan-20 Feb-20 Mar-20 Apr-20 May-20 Jun-20 Jul-20 Aug-20 Sep-20 Oct-20 Nov-20 Dec-20
Cash Purchases 12,927.20$ 13,462.90$ 13,553.10$ 13,699.40$ 13,445.30$ 12,044.60$ 11,920.65$ 13,497.75$ 16,058.70$ 18,025.35$ 19,810.35$ 15,907.50$
Credit Purchases 12,927.20$ 13,462.90$ 13,553.10$ 13,699.40$ 13,445.30$ 12,044.60$ 11,920.65$ 13,497.75$ 16,058.70$ 18,025.35$ 19,810.35$
TOTAL CASH PAYMENTS 12,927.20$ 26,390.10$ 27,016.00$ 27,252.50$ 27,144.70$ 25,489.90$ 23,965.25$ 25,418.40$ 29,556.45$ 34,084.05$ 37,835.70$ 35,717.85$
Schedule of Expected Payments to Suppliers
The further calculations are relatively depicting the overall schedule for expected cash
collections from customers and expected cash payments to suppliers, which should be conducted
over the period of next 12 months. This calculation would eventually help to determine the level
of cash flow that would be generated over the period of next 12 months. The scheduled payment
is mainly used in the cash flow statement to determine the appropriate level of cash flow
conditions of the company during the next financial year (Ho 2018).
After analyzing the overall cash flow budget statement and other budgets, it is detected
that the expansion project should not be accepted by Business Advisory Pty Ltd. The proposed
plan has mainly projected high level of losses for Business Advisory Pty Ltd, which might
hamper their current existing operations and force the company to become insolvent. Thus, other
projects need to be evaluated by the organization to determine the best possible investment
options. Thus, the current expansion plan would not yield higher returns instead it would have
direct impact on their cash flow conditions.
Paraphrase This Document
Need a fresh take? Get an instant paraphrase of this document with our AI Paraphraser
7
ACCOUNTING FOR DECISION MAKING
References:
Betaubun, P. and Putra, N.P., 2019. Budget Planning Information System for Simple Housing in
Merauke District. International Journal of Civil Engineering and Technology, 10(2), pp.783-
792.
Ho, A.T.K., 2018. From performance budgeting to performance budget management: Theory
and practice. Public Administration Review, 78(5), pp.748-758.
Jeong, K., Koo, C. and Hong, T., 2014. An estimation model for determining the annual energy
cost budget in educational facilities using SARIMA (seasonal autoregressive integrated moving
average) and ANN (artificial neural network). Energy, 71, pp.71-79.
Klychova, G.S., Faskhutdinova, М.S. and Sadrieva, E.R., 2014. Budget efficiency for cost
control purposes in management accounting system. Mediterranean journal of social
sciences, 5(24), p.79.
Maher, M.H., Fakhar, M.S. and Karimi, Z., 2018. The relationship between budget emphasis,
budget planning models and performance. Journal of Health Management & Informatics, 5(1),
pp.16-20.
Muzychenko, G., Koliada, T. and Churkina, I., 2018. Impact of European integration processes
on the necessity of long-term budget planning introduction in Ukraine. Baltic Journal of
Economic Studies, 3(5), pp.329-333.
1 out of 8
Related Documents


Your All-in-One AI-Powered Toolkit for Academic Success.
+13062052269
info@desklib.com
Available 24*7 on WhatsApp / Email
![[object Object]](/_next/static/media/star-bottom.7253800d.svg)
Unlock your academic potential
Copyright © 2020–2026 A2Z Services. All Rights Reserved. Developed and managed by ZUCOL.