Understanding Budget Discrepancies in Management Approaches
VerifiedAdded on 2020/05/03
|15
|3290
|157
AI Summary
The document examines two distinct budgeting approaches: imposed and participative. An imposed approach is characterized by a top-down communication flow where decisions are made independently by senior management without input from lower-level staff. This method allows for swift decision-making but may lead to disengagement among employees, who feel less responsible for the outcomes. Conversely, a participative budgetary approach involves all organizational levels in the budgeting process, fostering inclusivity and motivation. This bottom-up communication flow encourages detailed analysis and error reduction due to collective input. However, it can be time-consuming. The analysis highlights how these approaches influence an employee's response to budget discrepancies. In an imposed system, employees like Paulo might address issues without urgency, whereas in a participative environment, they are more likely to proactively seek solutions due to their involvement in the process.
Running head: AN EVALUATION OF BUDGETS
An Evaluation of Budgets
Student’s Name:
University Name:
Author Note
An Evaluation of Budgets
Student’s Name:
University Name:
Author Note
Paraphrase This Document
Need a fresh take? Get an instant paraphrase of this document with our AI Paraphraser
1AN EVALUATION OF BUDGETS
Table of Contents
Part A.........................................................................................................................................2
Answer to Part a.....................................................................................................................2
Answer to Part b.....................................................................................................................2
Answer to Part c.....................................................................................................................2
Answer to Part d.....................................................................................................................3
Answer to Part e.....................................................................................................................3
Answer to Part f.....................................................................................................................4
Answer to Part g.....................................................................................................................5
Answer to Part h.....................................................................................................................5
Answer to Part i......................................................................................................................6
Workings................................................................................................................................7
Part B..........................................................................................................................................8
Part C..........................................................................................................................................9
Part D.......................................................................................................................................12
References................................................................................................................................15
2AN EVALUATION OF BUDGETS
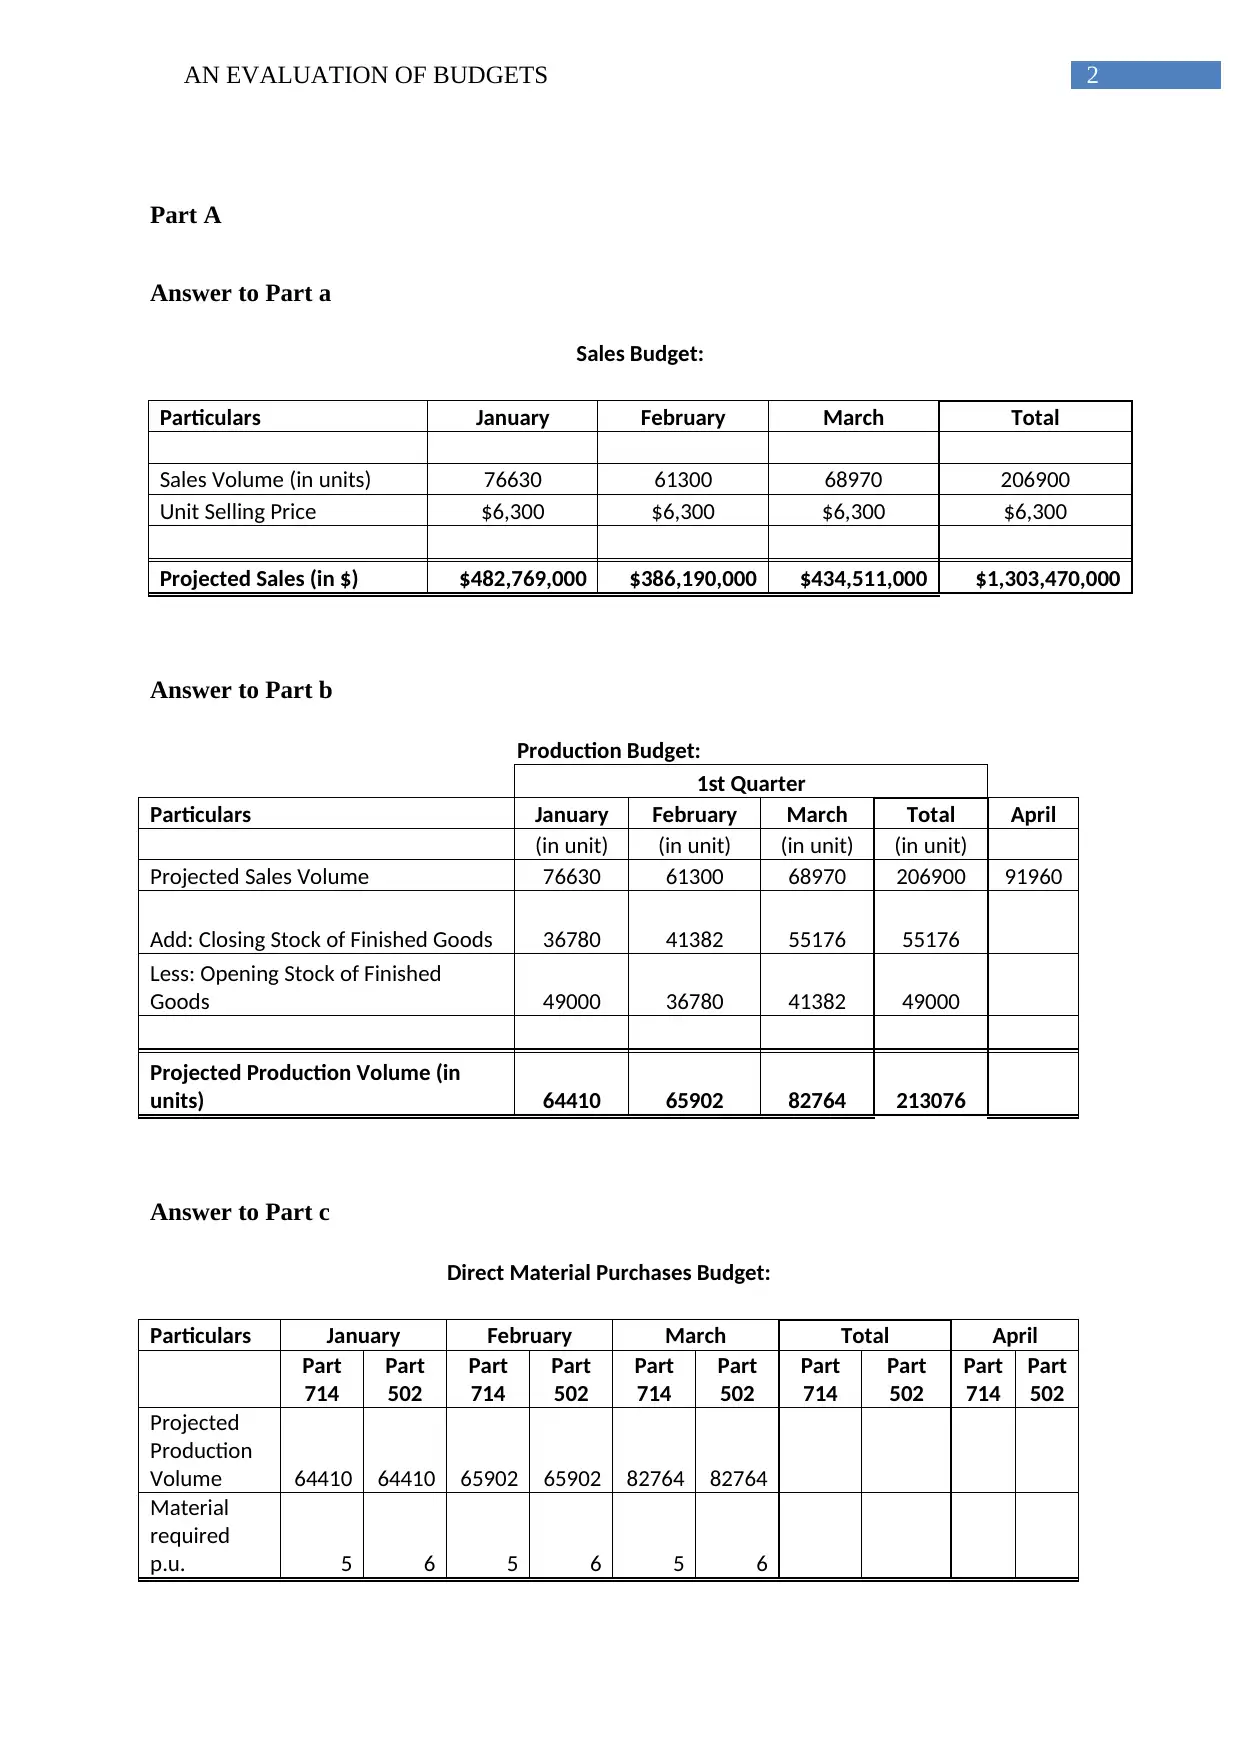
Part A
Answer to Part a
Sales Budget:
Particulars January February March Total
Sales Volume (in units) 76630 61300 68970 206900
Unit Selling Price $6,300 $6,300 $6,300 $6,300
Projected Sales (in $) $482,769,000 $386,190,000 $434,511,000 $1,303,470,000
Answer to Part b
Production Budget:
1st Quarter
Particulars January February March Total April
(in unit) (in unit) (in unit) (in unit)
Projected Sales Volume 76630 61300 68970 206900 91960
Add: Closing Stock of Finished Goods 36780 41382 55176 55176
Less: Opening Stock of Finished
Goods 49000 36780 41382 49000
Projected Production Volume (in
units) 64410 65902 82764 213076
Answer to Part c
Direct Material Purchases Budget:
Particulars January February March Total April
Part
714
Part
502
Part
714
Part
502
Part
714
Part
502
Part
714
Part
502
Part
714
Part
502
Projected
Production
Volume 64410 64410 65902 65902 82764 82764
Material
required
p.u. 5 6 5 6 5 6
⊘ This is a preview!⊘
Do you want full access?
Subscribe today to unlock all pages.
Trusted by 1+ million students worldwide
3AN EVALUATION OF BUDGETS
Total
Material
Required
32205
0
38646
0
32951
0
39541
2
41382
0
49658
4
10653
80
12784
56
Add: Closing
Stock of
Raw
Materials 61300 73560 68970 82764 91960
11035
2 91960
11035
2
Less:
Opening
Stock of
Raw
Material 76630 91956 61300 73560 68970 82764 76630 91956
Direct
Material
Purchased
(in units)
30672
0
36806
4
33718
0
40461
6
43681
0
52417
2
10807
10
12968
52
Material
Cost p.u. $92 $123 $92 $123 $92 $123 $92 $123
Projected
Direct
Material
Purchased
$28,2
18,24
0
$45,2
71,87
2
$31,0
20,56
0
$49,7
67,76
8
$40,1
86,52
0
$64,4
73,15
6
$99,4
25,32
0
$159,5
12,796
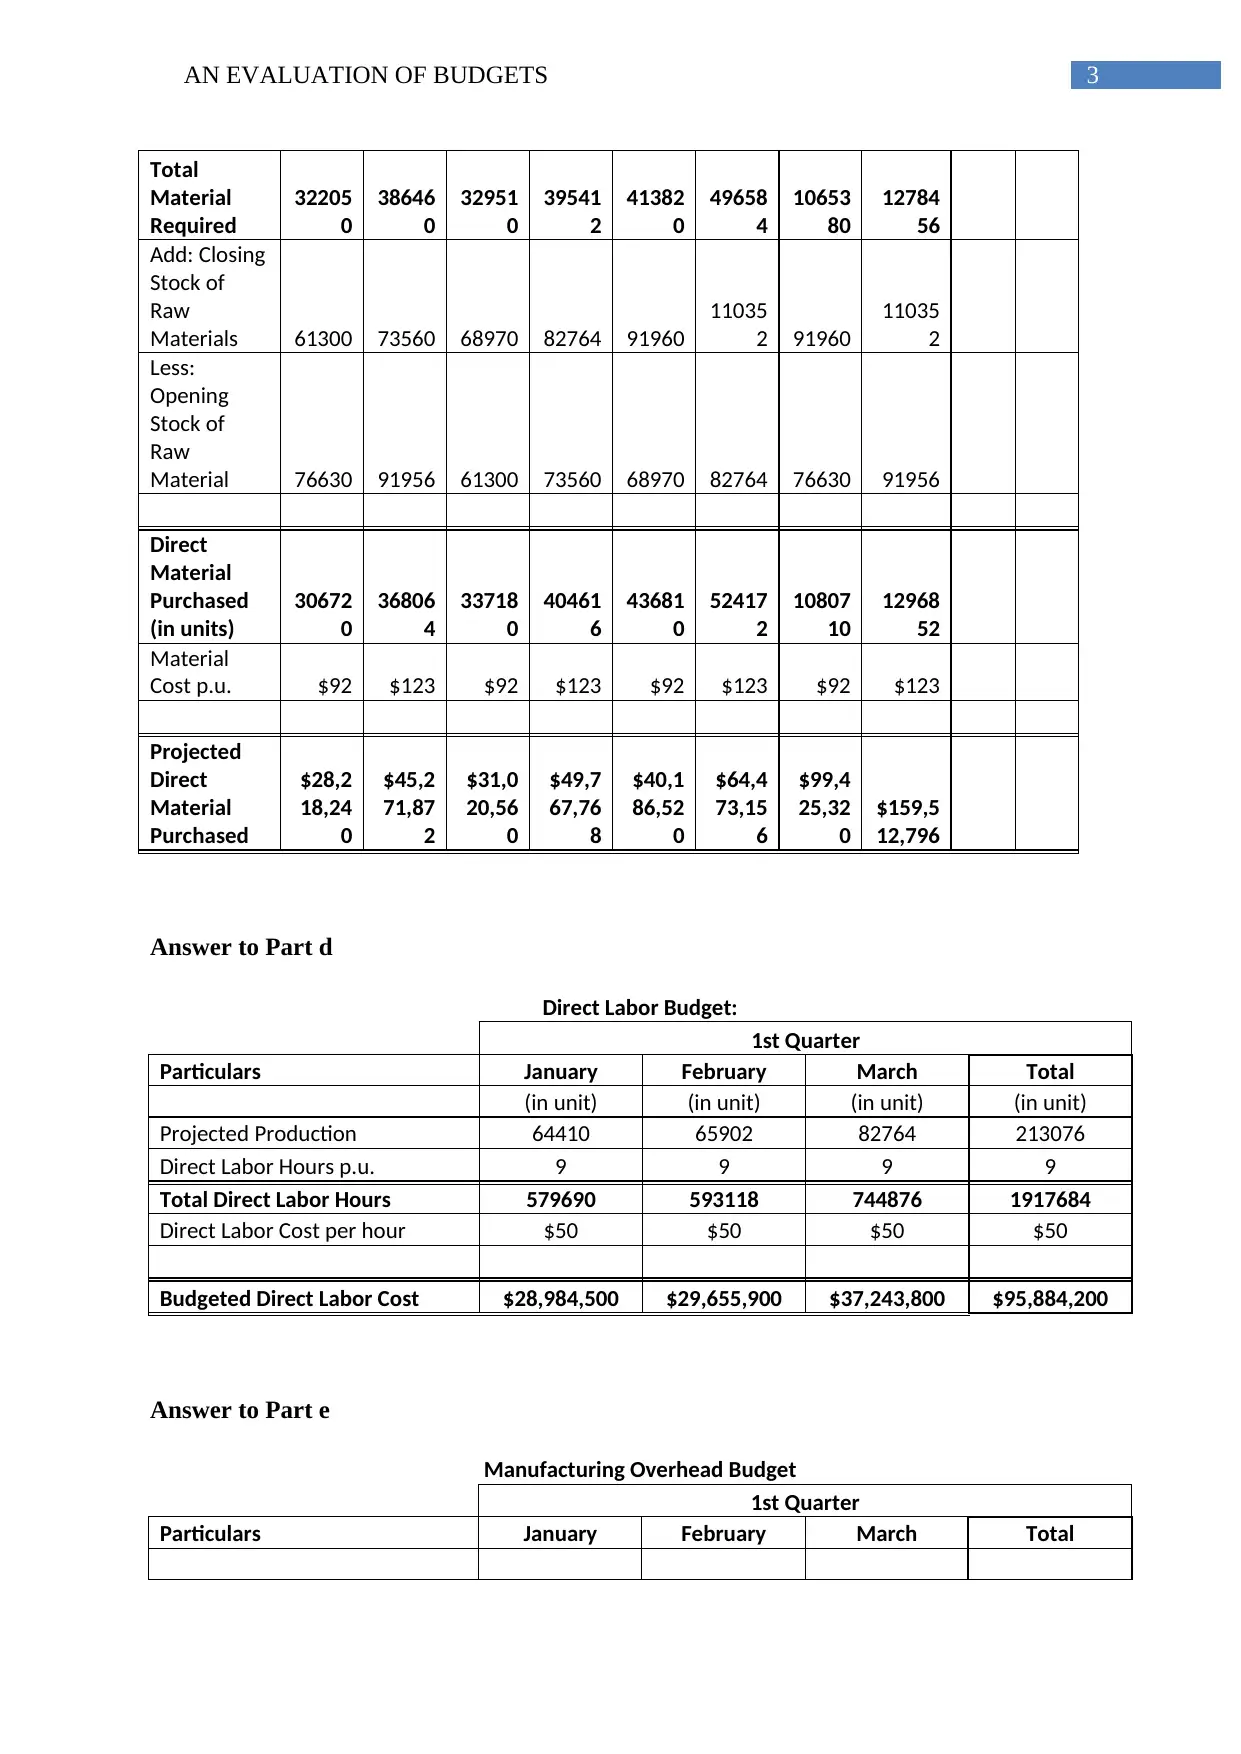
Answer to Part d
Direct Labor Budget:
1st Quarter
Particulars January February March Total
(in unit) (in unit) (in unit) (in unit)
Projected Production 64410 65902 82764 213076
Direct Labor Hours p.u. 9 9 9 9
Total Direct Labor Hours 579690 593118 744876 1917684
Direct Labor Cost per hour $50 $50 $50 $50
Budgeted Direct Labor Cost $28,984,500 $29,655,900 $37,243,800 $95,884,200
Answer to Part e
Manufacturing Overhead Budget
1st Quarter
Particulars January February March Total
Total
Material
Required
32205
0
38646
0
32951
0
39541
2
41382
0
49658
4
10653
80
12784
56
Add: Closing
Stock of
Raw
Materials 61300 73560 68970 82764 91960
11035
2 91960
11035
2
Less:
Opening
Stock of
Raw
Material 76630 91956 61300 73560 68970 82764 76630 91956
Direct
Material
Purchased
(in units)
30672
0
36806
4
33718
0
40461
6
43681
0
52417
2
10807
10
12968
52
Material
Cost p.u. $92 $123 $92 $123 $92 $123 $92 $123
Projected
Direct
Material
Purchased
$28,2
18,24
0
$45,2
71,87
2
$31,0
20,56
0
$49,7
67,76
8
$40,1
86,52
0
$64,4
73,15
6
$99,4
25,32
0
$159,5
12,796
Answer to Part d
Direct Labor Budget:
1st Quarter
Particulars January February March Total
(in unit) (in unit) (in unit) (in unit)
Projected Production 64410 65902 82764 213076
Direct Labor Hours p.u. 9 9 9 9
Total Direct Labor Hours 579690 593118 744876 1917684
Direct Labor Cost per hour $50 $50 $50 $50
Budgeted Direct Labor Cost $28,984,500 $29,655,900 $37,243,800 $95,884,200
Answer to Part e
Manufacturing Overhead Budget
1st Quarter
Particulars January February March Total
Paraphrase This Document
Need a fresh take? Get an instant paraphrase of this document with our AI Paraphraser
4AN EVALUATION OF BUDGETS
Total Direct Labor Hours 579690 593118 744876 1917684
Variable Overhead per labor
hour:
Indirect Labor $64.37 $64.37 $64.37 $64.37
Power $6.13 $6.13 $6.13 $6.13
Maintenance $37.78 $37.78 $37.78 $37.78
Other Manufacturing Cost $45.98 $45.98 $45.98 $45.98
Total Variable Manufacturing
Cost $89,420,332 $91,491,674 $114,901,169 $295,813,175
Fixed Overhead:
Supervision $42,912,800 $42,912,800 $42,912,800 $128,738,400
Depreciation $3,831,500 $3,831,500 $3,831,500 $11,494,500
Rates & utilities $3,166,400 $3,166,400 $3,166,400 $9,499,200
Maintenance $34,861,121 $34,861,121 $34,861,121 $104,583,362
Other Fixed Overhead $15,326,000 $15,326,000 $15,326,000 $45,978,000
Total Fixed Manufacturing
Overhead $100,097,821 $100,097,821 $100,097,821 $300,293,462
Budgeted Manufacturing
Overhead $189,518,152 $191,589,494 $214,998,990 $596,106,636
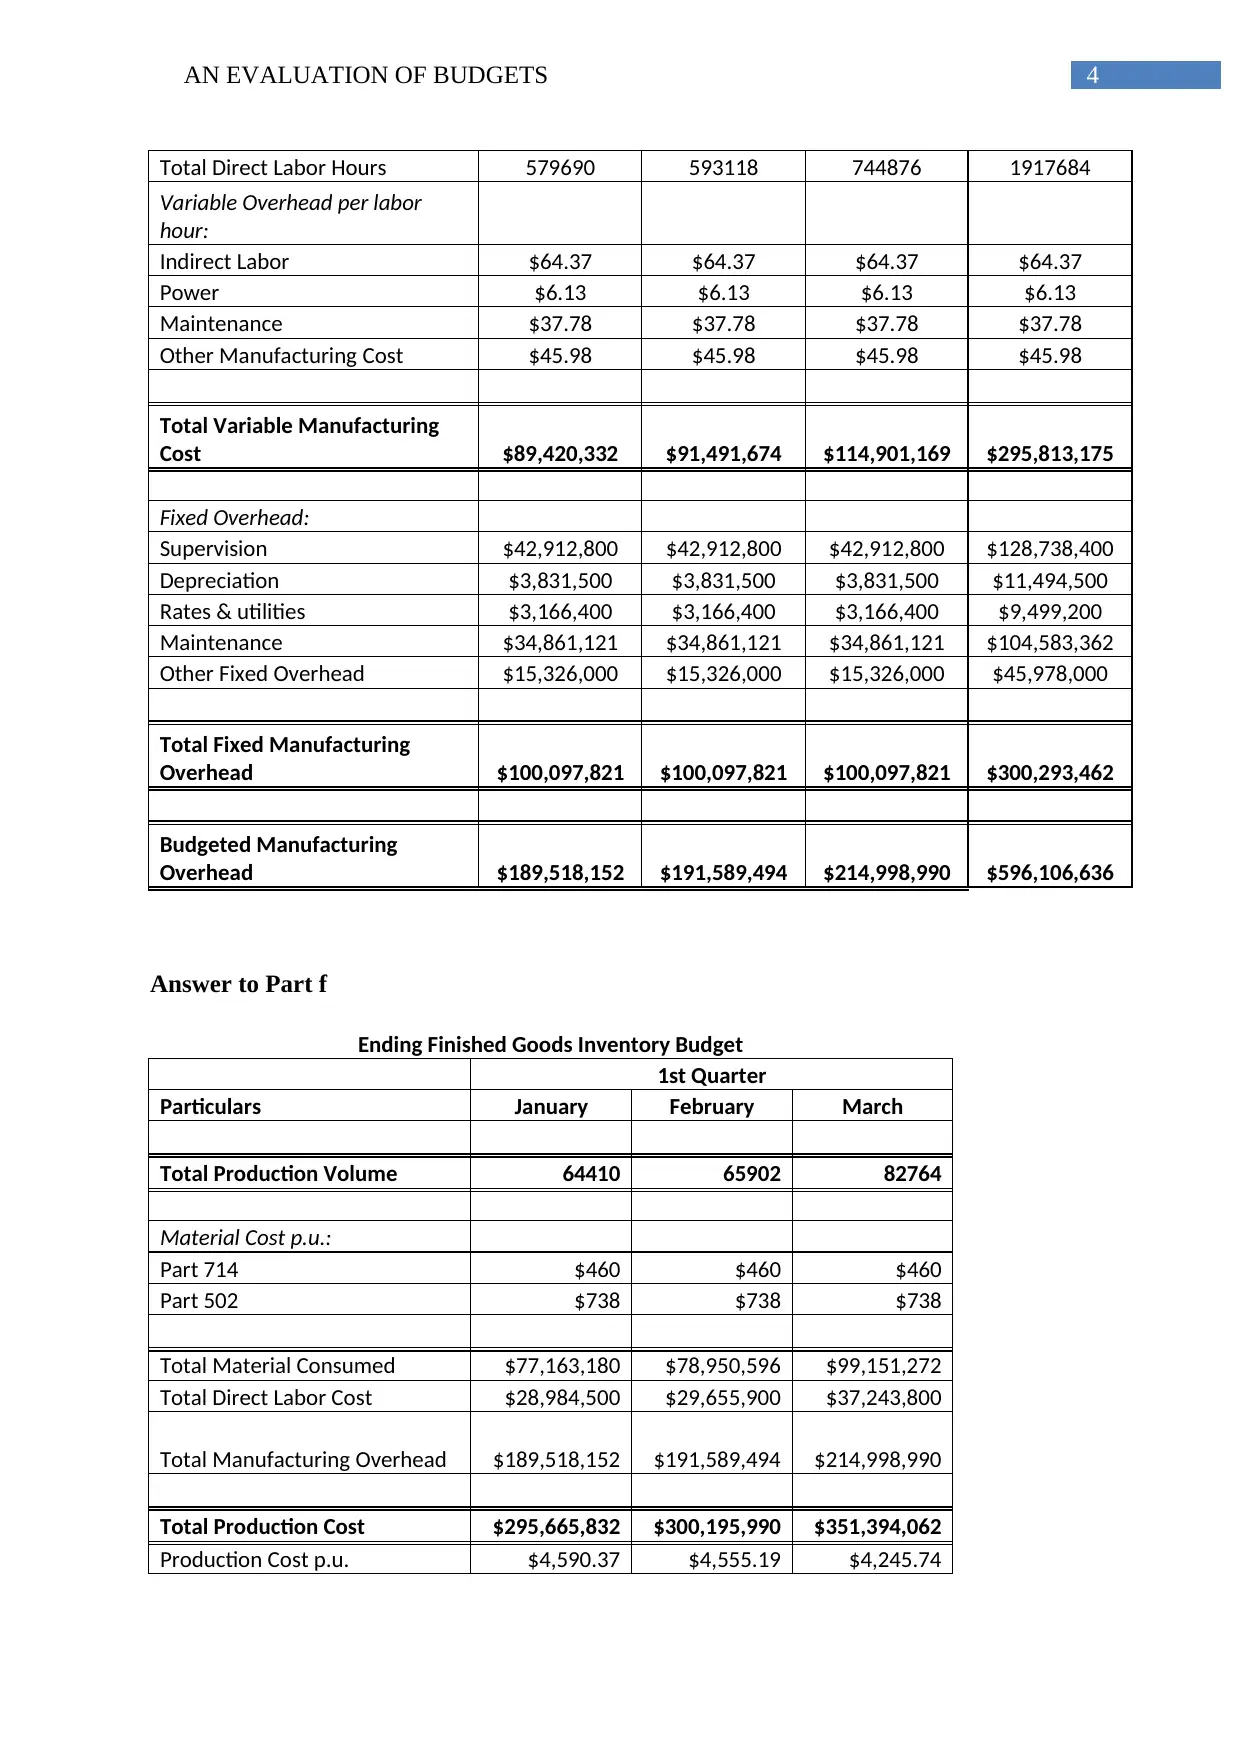
Answer to Part f
Ending Finished Goods Inventory Budget
1st Quarter
Particulars January February March
Total Production Volume 64410 65902 82764
Material Cost p.u.:
Part 714 $460 $460 $460
Part 502 $738 $738 $738
Total Material Consumed $77,163,180 $78,950,596 $99,151,272
Total Direct Labor Cost $28,984,500 $29,655,900 $37,243,800
Total Manufacturing Overhead $189,518,152 $191,589,494 $214,998,990
Total Production Cost $295,665,832 $300,195,990 $351,394,062
Production Cost p.u. $4,590.37 $4,555.19 $4,245.74
Total Direct Labor Hours 579690 593118 744876 1917684
Variable Overhead per labor
hour:
Indirect Labor $64.37 $64.37 $64.37 $64.37
Power $6.13 $6.13 $6.13 $6.13
Maintenance $37.78 $37.78 $37.78 $37.78
Other Manufacturing Cost $45.98 $45.98 $45.98 $45.98
Total Variable Manufacturing
Cost $89,420,332 $91,491,674 $114,901,169 $295,813,175
Fixed Overhead:
Supervision $42,912,800 $42,912,800 $42,912,800 $128,738,400
Depreciation $3,831,500 $3,831,500 $3,831,500 $11,494,500
Rates & utilities $3,166,400 $3,166,400 $3,166,400 $9,499,200
Maintenance $34,861,121 $34,861,121 $34,861,121 $104,583,362
Other Fixed Overhead $15,326,000 $15,326,000 $15,326,000 $45,978,000
Total Fixed Manufacturing
Overhead $100,097,821 $100,097,821 $100,097,821 $300,293,462
Budgeted Manufacturing
Overhead $189,518,152 $191,589,494 $214,998,990 $596,106,636
Answer to Part f
Ending Finished Goods Inventory Budget
1st Quarter
Particulars January February March
Total Production Volume 64410 65902 82764
Material Cost p.u.:
Part 714 $460 $460 $460
Part 502 $738 $738 $738
Total Material Consumed $77,163,180 $78,950,596 $99,151,272
Total Direct Labor Cost $28,984,500 $29,655,900 $37,243,800
Total Manufacturing Overhead $189,518,152 $191,589,494 $214,998,990
Total Production Cost $295,665,832 $300,195,990 $351,394,062
Production Cost p.u. $4,590.37 $4,555.19 $4,245.74
5AN EVALUATION OF BUDGETS
Ending Finished Goods
Inventory 36780 41382 55176
Budgeted Finished Goods
Inventory $168,833,866 $188,502,784 $234,262,708
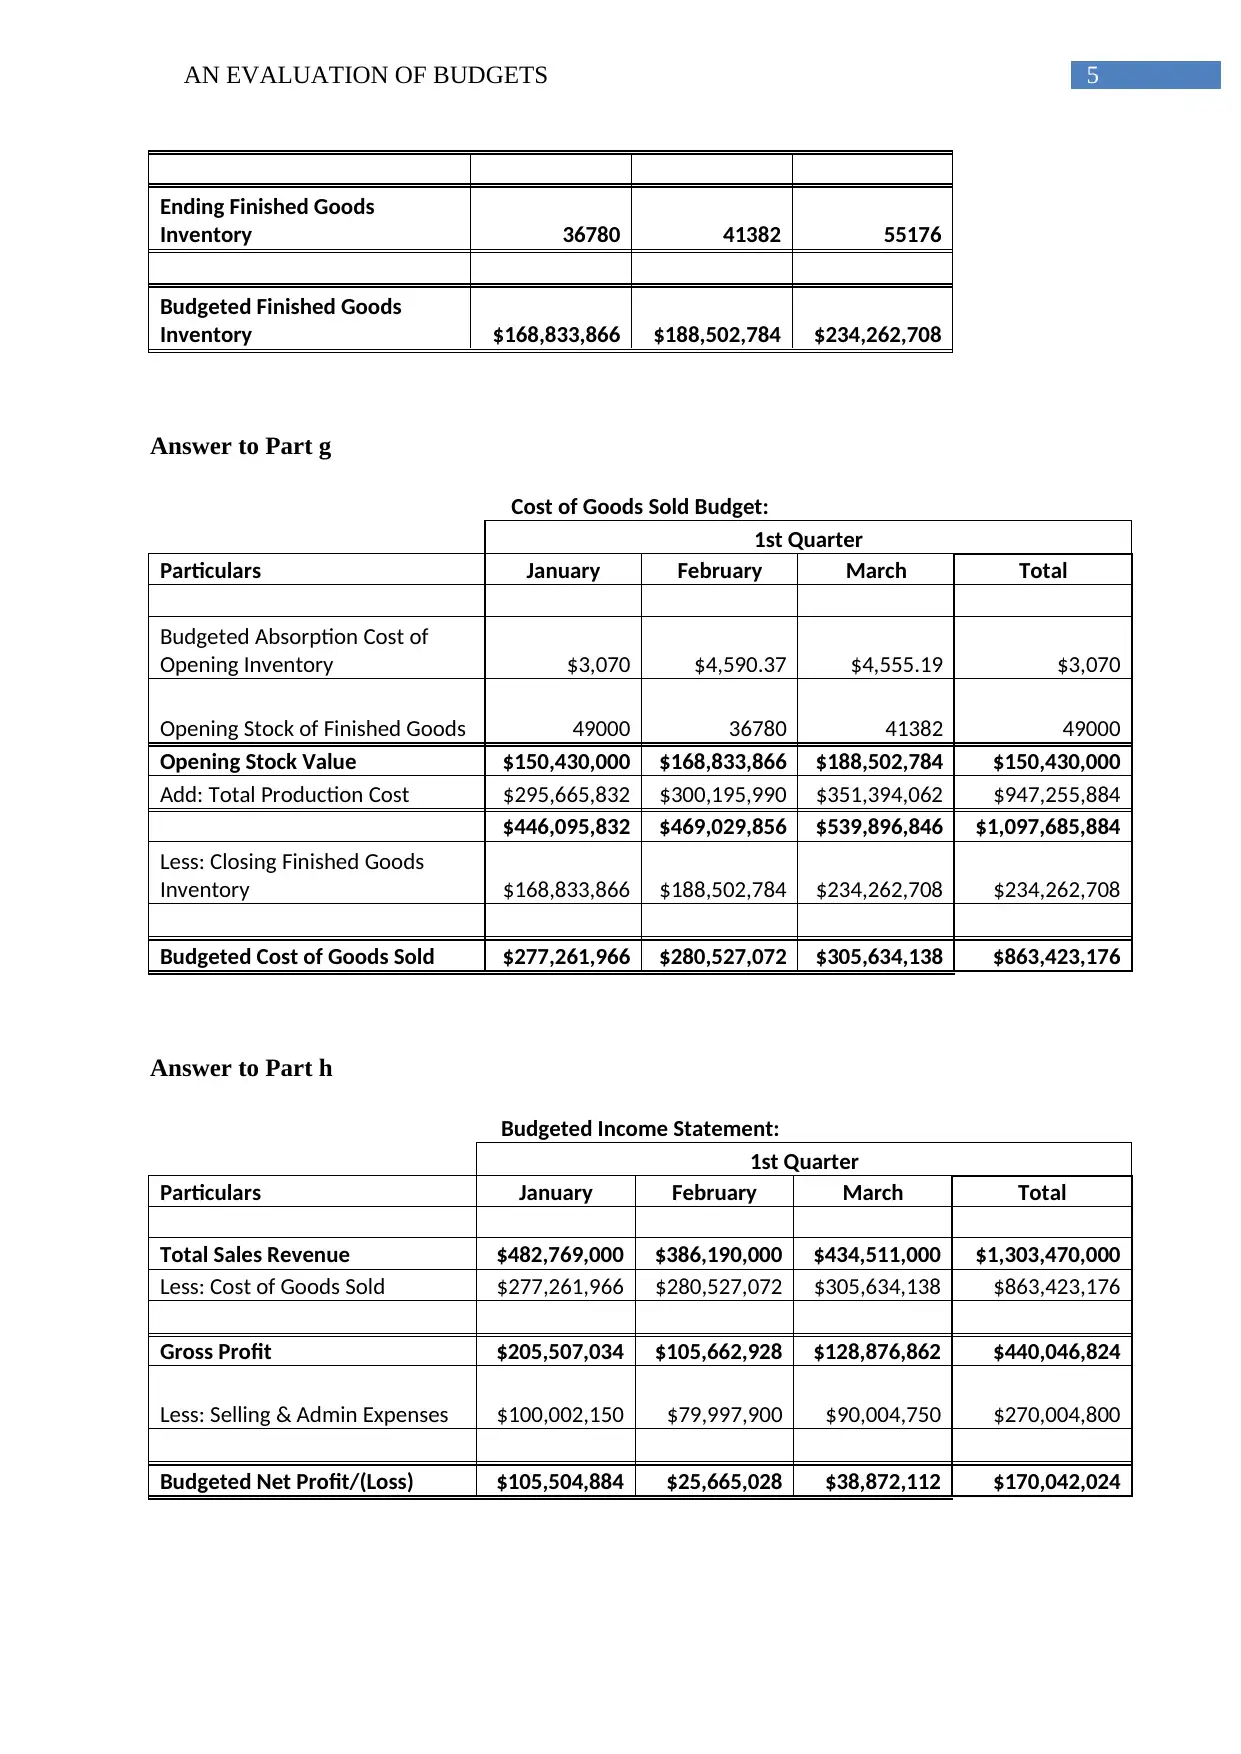
Answer to Part g
Cost of Goods Sold Budget:
1st Quarter
Particulars January February March Total
Budgeted Absorption Cost of
Opening Inventory $3,070 $4,590.37 $4,555.19 $3,070
Opening Stock of Finished Goods 49000 36780 41382 49000
Opening Stock Value $150,430,000 $168,833,866 $188,502,784 $150,430,000
Add: Total Production Cost $295,665,832 $300,195,990 $351,394,062 $947,255,884
$446,095,832 $469,029,856 $539,896,846 $1,097,685,884
Less: Closing Finished Goods
Inventory $168,833,866 $188,502,784 $234,262,708 $234,262,708
Budgeted Cost of Goods Sold $277,261,966 $280,527,072 $305,634,138 $863,423,176
Answer to Part h
Budgeted Income Statement:
1st Quarter
Particulars January February March Total
Total Sales Revenue $482,769,000 $386,190,000 $434,511,000 $1,303,470,000
Less: Cost of Goods Sold $277,261,966 $280,527,072 $305,634,138 $863,423,176
Gross Profit $205,507,034 $105,662,928 $128,876,862 $440,046,824
Less: Selling & Admin Expenses $100,002,150 $79,997,900 $90,004,750 $270,004,800
Budgeted Net Profit/(Loss) $105,504,884 $25,665,028 $38,872,112 $170,042,024
Ending Finished Goods
Inventory 36780 41382 55176
Budgeted Finished Goods
Inventory $168,833,866 $188,502,784 $234,262,708
Answer to Part g
Cost of Goods Sold Budget:
1st Quarter
Particulars January February March Total
Budgeted Absorption Cost of
Opening Inventory $3,070 $4,590.37 $4,555.19 $3,070
Opening Stock of Finished Goods 49000 36780 41382 49000
Opening Stock Value $150,430,000 $168,833,866 $188,502,784 $150,430,000
Add: Total Production Cost $295,665,832 $300,195,990 $351,394,062 $947,255,884
$446,095,832 $469,029,856 $539,896,846 $1,097,685,884
Less: Closing Finished Goods
Inventory $168,833,866 $188,502,784 $234,262,708 $234,262,708
Budgeted Cost of Goods Sold $277,261,966 $280,527,072 $305,634,138 $863,423,176
Answer to Part h
Budgeted Income Statement:
1st Quarter
Particulars January February March Total
Total Sales Revenue $482,769,000 $386,190,000 $434,511,000 $1,303,470,000
Less: Cost of Goods Sold $277,261,966 $280,527,072 $305,634,138 $863,423,176
Gross Profit $205,507,034 $105,662,928 $128,876,862 $440,046,824
Less: Selling & Admin Expenses $100,002,150 $79,997,900 $90,004,750 $270,004,800
Budgeted Net Profit/(Loss) $105,504,884 $25,665,028 $38,872,112 $170,042,024
⊘ This is a preview!⊘
Do you want full access?
Subscribe today to unlock all pages.
Trusted by 1+ million students worldwide
6AN EVALUATION OF BUDGETS
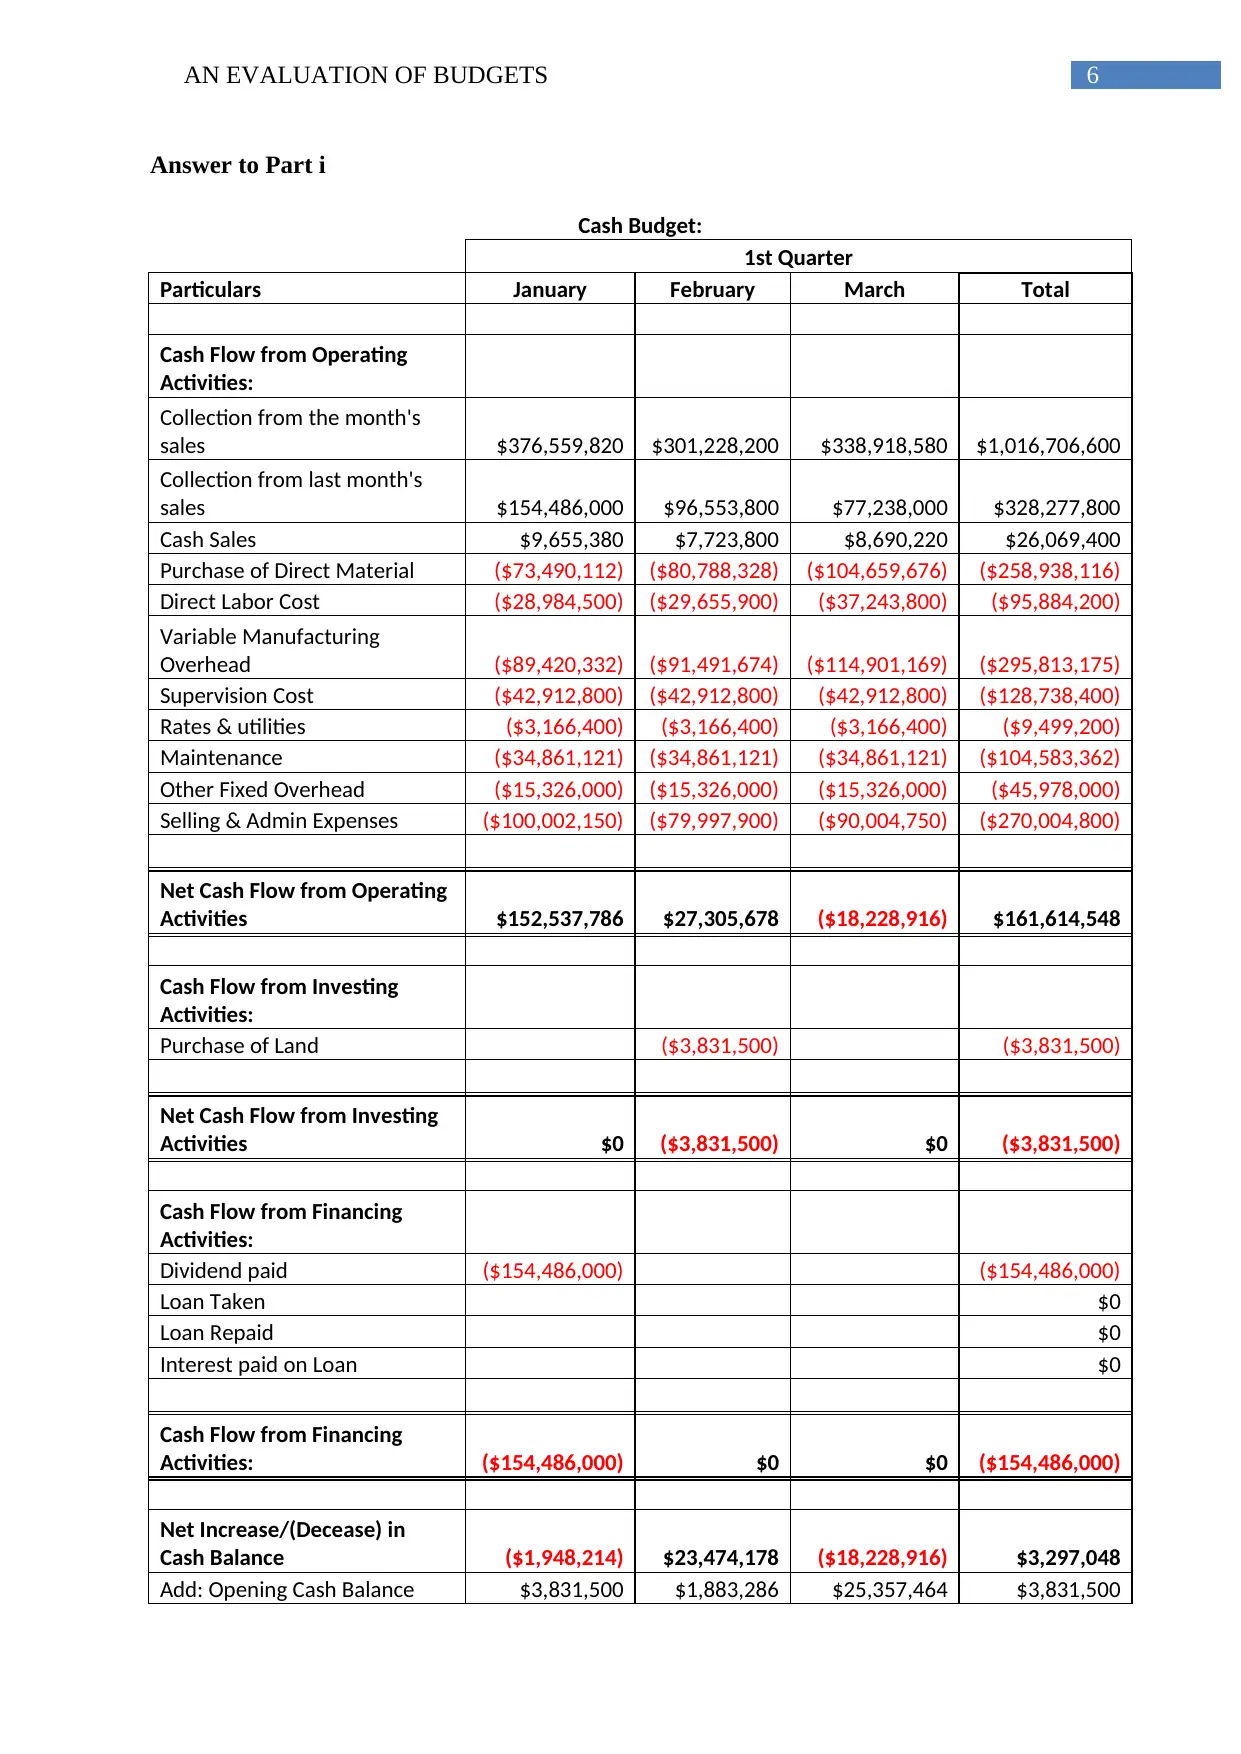
Answer to Part i
Cash Budget:
1st Quarter
Particulars January February March Total
Cash Flow from Operating
Activities:
Collection from the month's
sales $376,559,820 $301,228,200 $338,918,580 $1,016,706,600
Collection from last month's
sales $154,486,000 $96,553,800 $77,238,000 $328,277,800
Cash Sales $9,655,380 $7,723,800 $8,690,220 $26,069,400
Purchase of Direct Material ($73,490,112) ($80,788,328) ($104,659,676) ($258,938,116)
Direct Labor Cost ($28,984,500) ($29,655,900) ($37,243,800) ($95,884,200)
Variable Manufacturing
Overhead ($89,420,332) ($91,491,674) ($114,901,169) ($295,813,175)
Supervision Cost ($42,912,800) ($42,912,800) ($42,912,800) ($128,738,400)
Rates & utilities ($3,166,400) ($3,166,400) ($3,166,400) ($9,499,200)
Maintenance ($34,861,121) ($34,861,121) ($34,861,121) ($104,583,362)
Other Fixed Overhead ($15,326,000) ($15,326,000) ($15,326,000) ($45,978,000)
Selling & Admin Expenses ($100,002,150) ($79,997,900) ($90,004,750) ($270,004,800)
Net Cash Flow from Operating
Activities $152,537,786 $27,305,678 ($18,228,916) $161,614,548
Cash Flow from Investing
Activities:
Purchase of Land ($3,831,500) ($3,831,500)
Net Cash Flow from Investing
Activities $0 ($3,831,500) $0 ($3,831,500)
Cash Flow from Financing
Activities:
Dividend paid ($154,486,000) ($154,486,000)
Loan Taken $0
Loan Repaid $0
Interest paid on Loan $0
Cash Flow from Financing
Activities: ($154,486,000) $0 $0 ($154,486,000)
Net Increase/(Decease) in
Cash Balance ($1,948,214) $23,474,178 ($18,228,916) $3,297,048
Add: Opening Cash Balance $3,831,500 $1,883,286 $25,357,464 $3,831,500
Paraphrase This Document
Need a fresh take? Get an instant paraphrase of this document with our AI Paraphraser
7AN EVALUATION OF BUDGETS
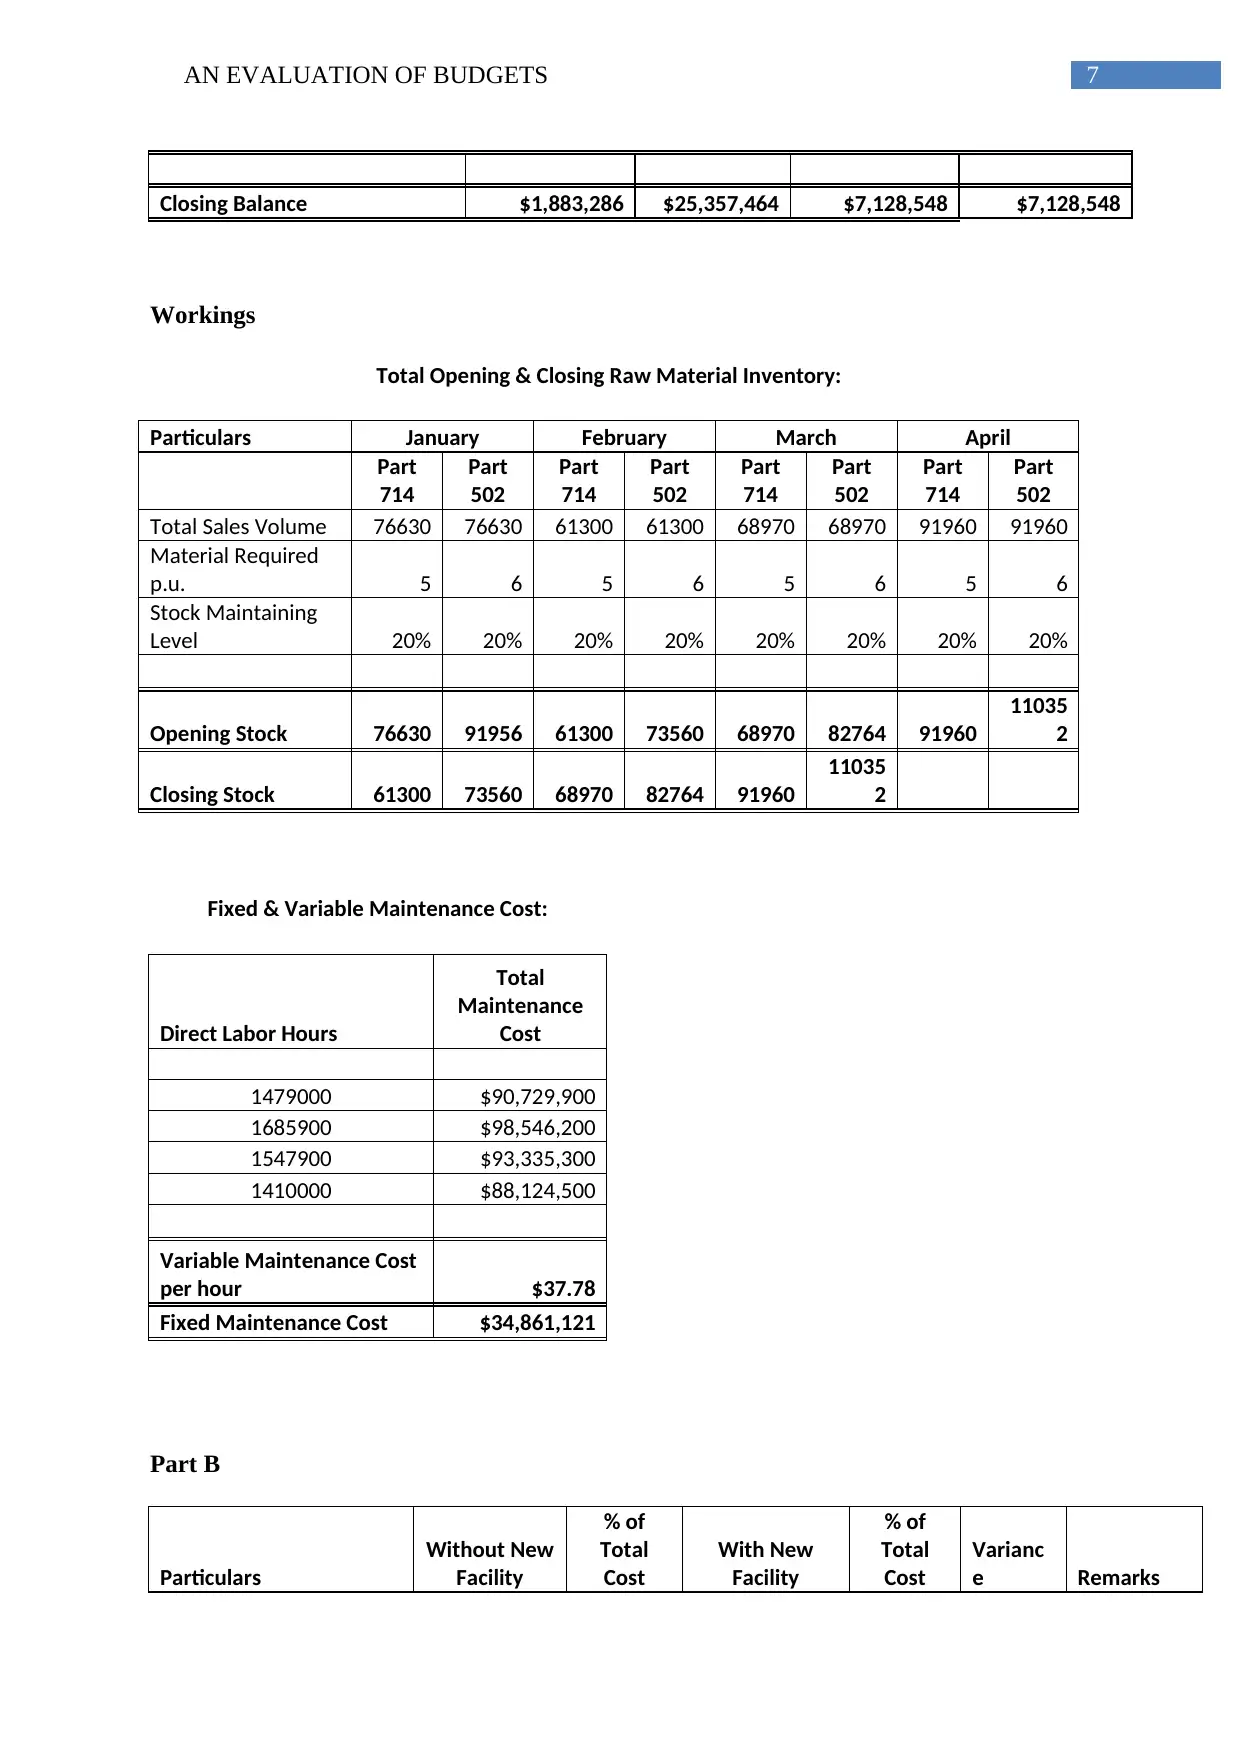
Closing Balance $1,883,286 $25,357,464 $7,128,548 $7,128,548
Workings
Total Opening & Closing Raw Material Inventory:
Particulars January February March April
Part
714
Part
502
Part
714
Part
502
Part
714
Part
502
Part
714
Part
502
Total Sales Volume 76630 76630 61300 61300 68970 68970 91960 91960
Material Required
p.u. 5 6 5 6 5 6 5 6
Stock Maintaining
Level 20% 20% 20% 20% 20% 20% 20% 20%
Opening Stock 76630 91956 61300 73560 68970 82764 91960
11035
2
Closing Stock 61300 73560 68970 82764 91960
11035
2
Fixed & Variable Maintenance Cost:
Direct Labor Hours
Total
Maintenance
Cost
1479000 $90,729,900
1685900 $98,546,200
1547900 $93,335,300
1410000 $88,124,500
Variable Maintenance Cost
per hour $37.78
Fixed Maintenance Cost $34,861,121
Part B
Particulars
Without New
Facility
% of
Total
Cost
With New
Facility
% of
Total
Cost
Varianc
e Remarks
8AN EVALUATION OF BUDGETS
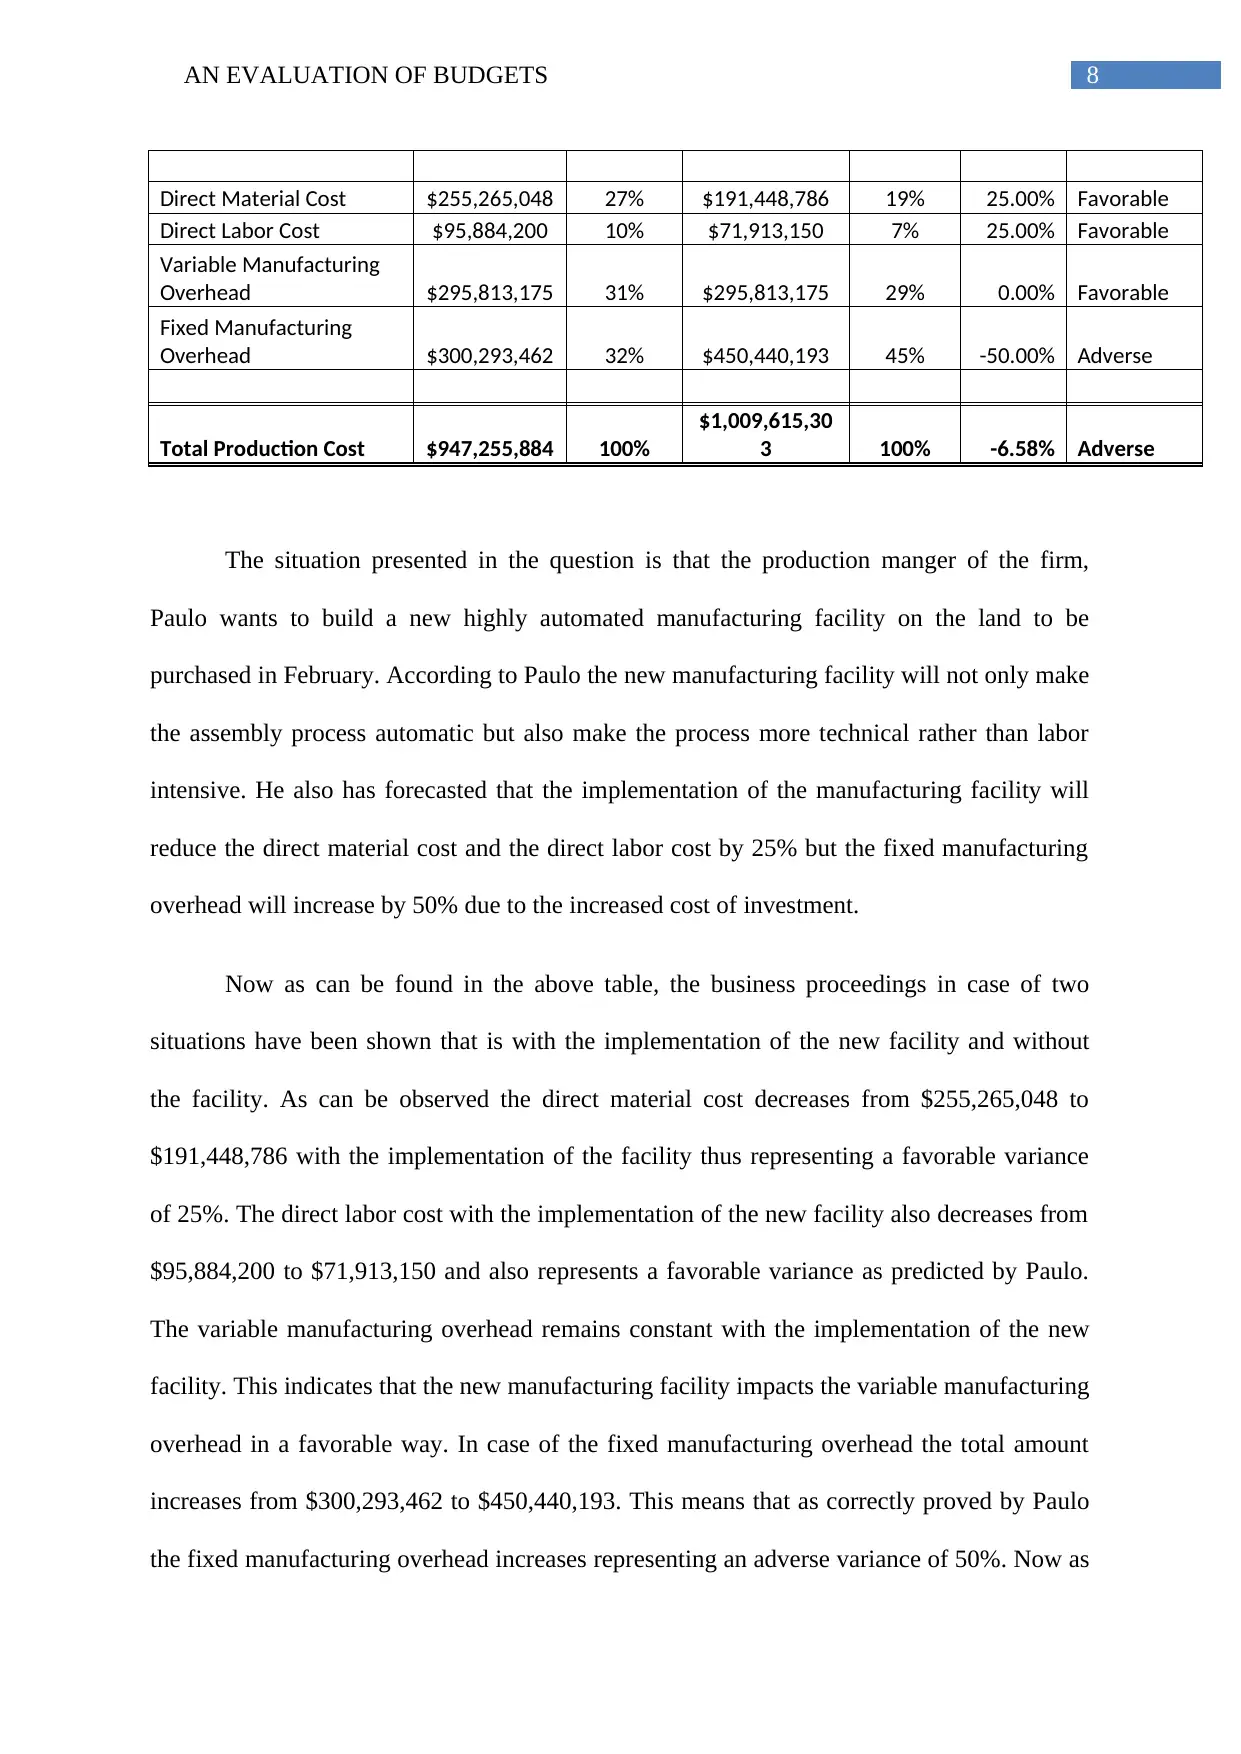
Direct Material Cost $255,265,048 27% $191,448,786 19% 25.00% Favorable
Direct Labor Cost $95,884,200 10% $71,913,150 7% 25.00% Favorable
Variable Manufacturing
Overhead $295,813,175 31% $295,813,175 29% 0.00% Favorable
Fixed Manufacturing
Overhead $300,293,462 32% $450,440,193 45% -50.00% Adverse
Total Production Cost $947,255,884 100%
$1,009,615,30
3 100% -6.58% Adverse
The situation presented in the question is that the production manger of the firm,
Paulo wants to build a new highly automated manufacturing facility on the land to be
purchased in February. According to Paulo the new manufacturing facility will not only make
the assembly process automatic but also make the process more technical rather than labor
intensive. He also has forecasted that the implementation of the manufacturing facility will
reduce the direct material cost and the direct labor cost by 25% but the fixed manufacturing
overhead will increase by 50% due to the increased cost of investment.
Now as can be found in the above table, the business proceedings in case of two
situations have been shown that is with the implementation of the new facility and without
the facility. As can be observed the direct material cost decreases from $255,265,048 to
$191,448,786 with the implementation of the facility thus representing a favorable variance
of 25%. The direct labor cost with the implementation of the new facility also decreases from
$95,884,200 to $71,913,150 and also represents a favorable variance as predicted by Paulo.
The variable manufacturing overhead remains constant with the implementation of the new
facility. This indicates that the new manufacturing facility impacts the variable manufacturing
overhead in a favorable way. In case of the fixed manufacturing overhead the total amount
increases from $300,293,462 to $450,440,193. This means that as correctly proved by Paulo
the fixed manufacturing overhead increases representing an adverse variance of 50%. Now as
⊘ This is a preview!⊘
Do you want full access?
Subscribe today to unlock all pages.
Trusted by 1+ million students worldwide
9AN EVALUATION OF BUDGETS
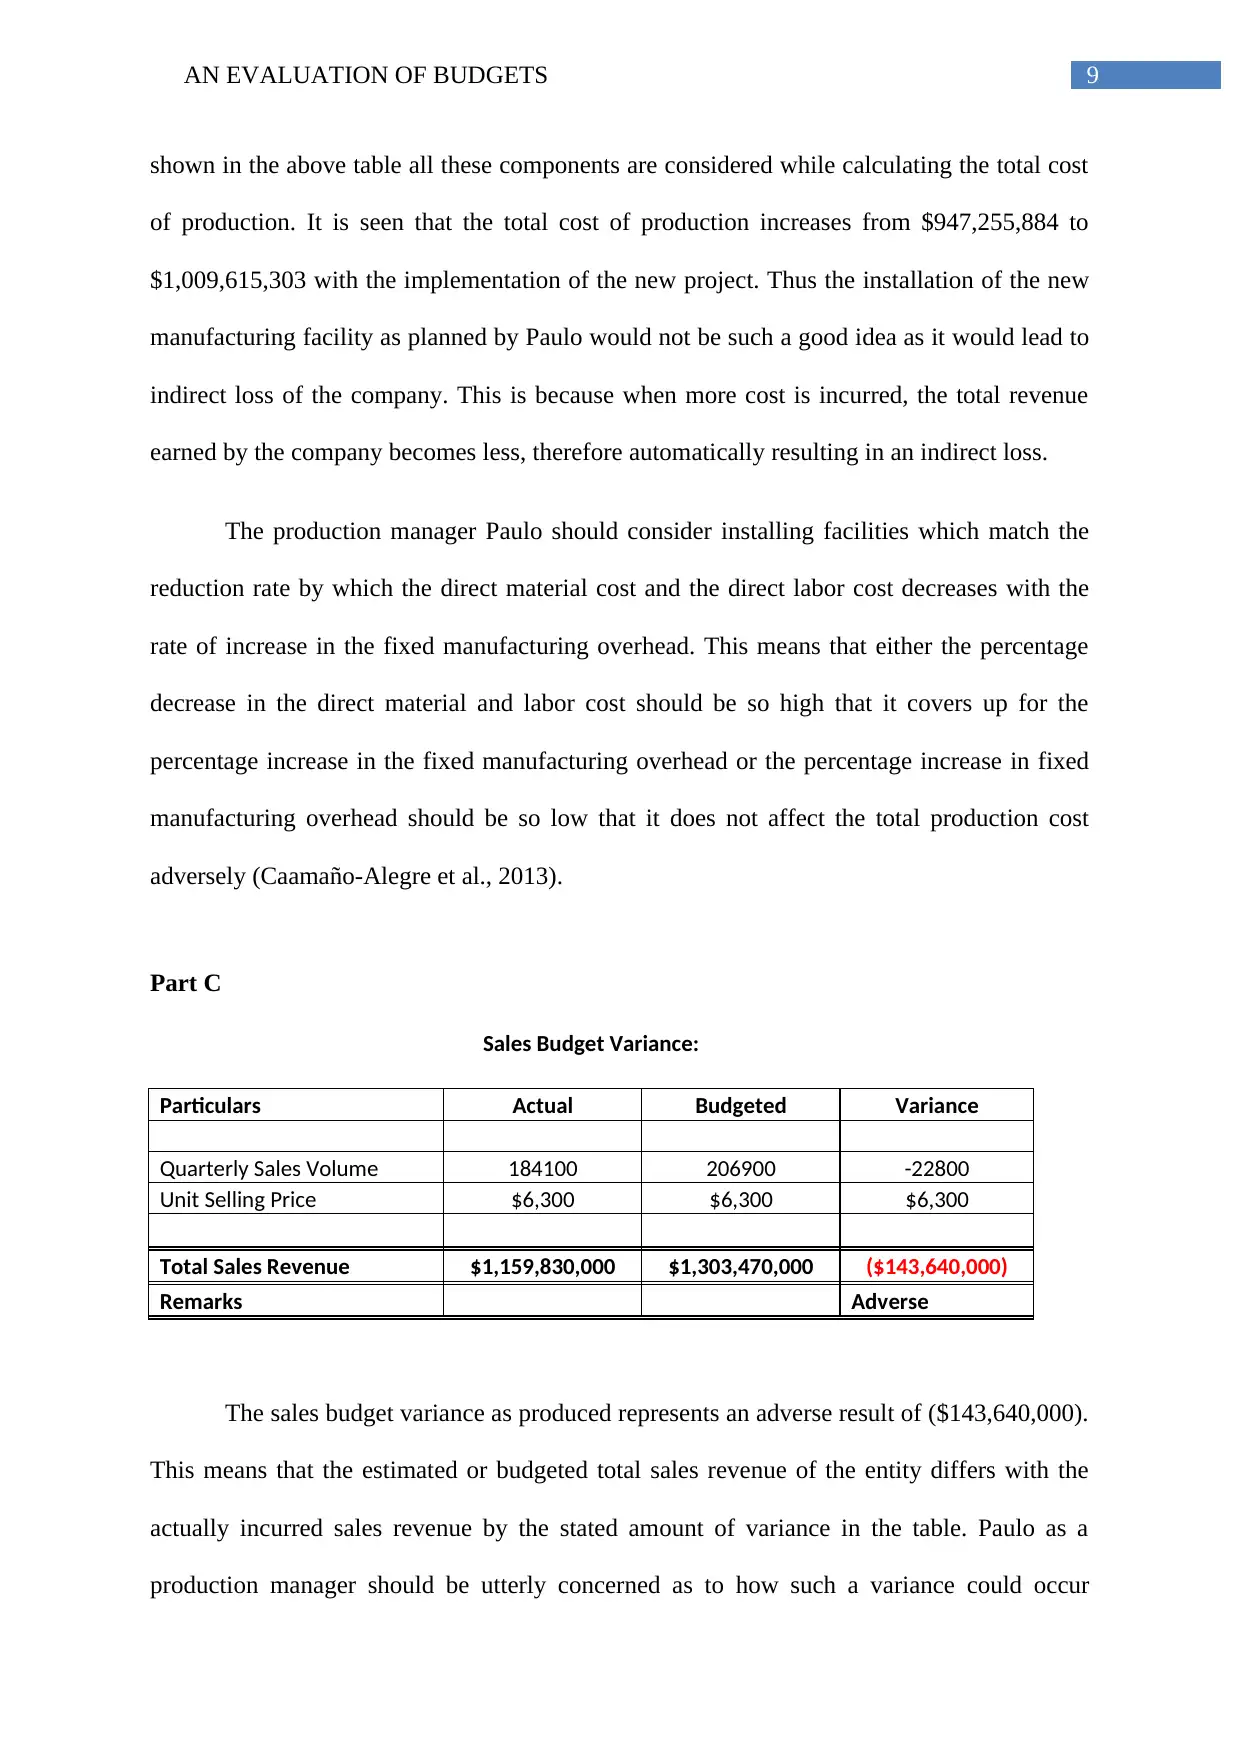
shown in the above table all these components are considered while calculating the total cost
of production. It is seen that the total cost of production increases from $947,255,884 to
$1,009,615,303 with the implementation of the new project. Thus the installation of the new
manufacturing facility as planned by Paulo would not be such a good idea as it would lead to
indirect loss of the company. This is because when more cost is incurred, the total revenue
earned by the company becomes less, therefore automatically resulting in an indirect loss.
The production manager Paulo should consider installing facilities which match the
reduction rate by which the direct material cost and the direct labor cost decreases with the
rate of increase in the fixed manufacturing overhead. This means that either the percentage
decrease in the direct material and labor cost should be so high that it covers up for the
percentage increase in the fixed manufacturing overhead or the percentage increase in fixed
manufacturing overhead should be so low that it does not affect the total production cost
adversely (Caamaño-Alegre et al., 2013).
Part C
Sales Budget Variance:
Particulars Actual Budgeted Variance
Quarterly Sales Volume 184100 206900 -22800
Unit Selling Price $6,300 $6,300 $6,300
Total Sales Revenue $1,159,830,000 $1,303,470,000 ($143,640,000)
Remarks Adverse
The sales budget variance as produced represents an adverse result of ($143,640,000).
This means that the estimated or budgeted total sales revenue of the entity differs with the
actually incurred sales revenue by the stated amount of variance in the table. Paulo as a
production manager should be utterly concerned as to how such a variance could occur
Paraphrase This Document
Need a fresh take? Get an instant paraphrase of this document with our AI Paraphraser
10AN EVALUATION OF BUDGETS
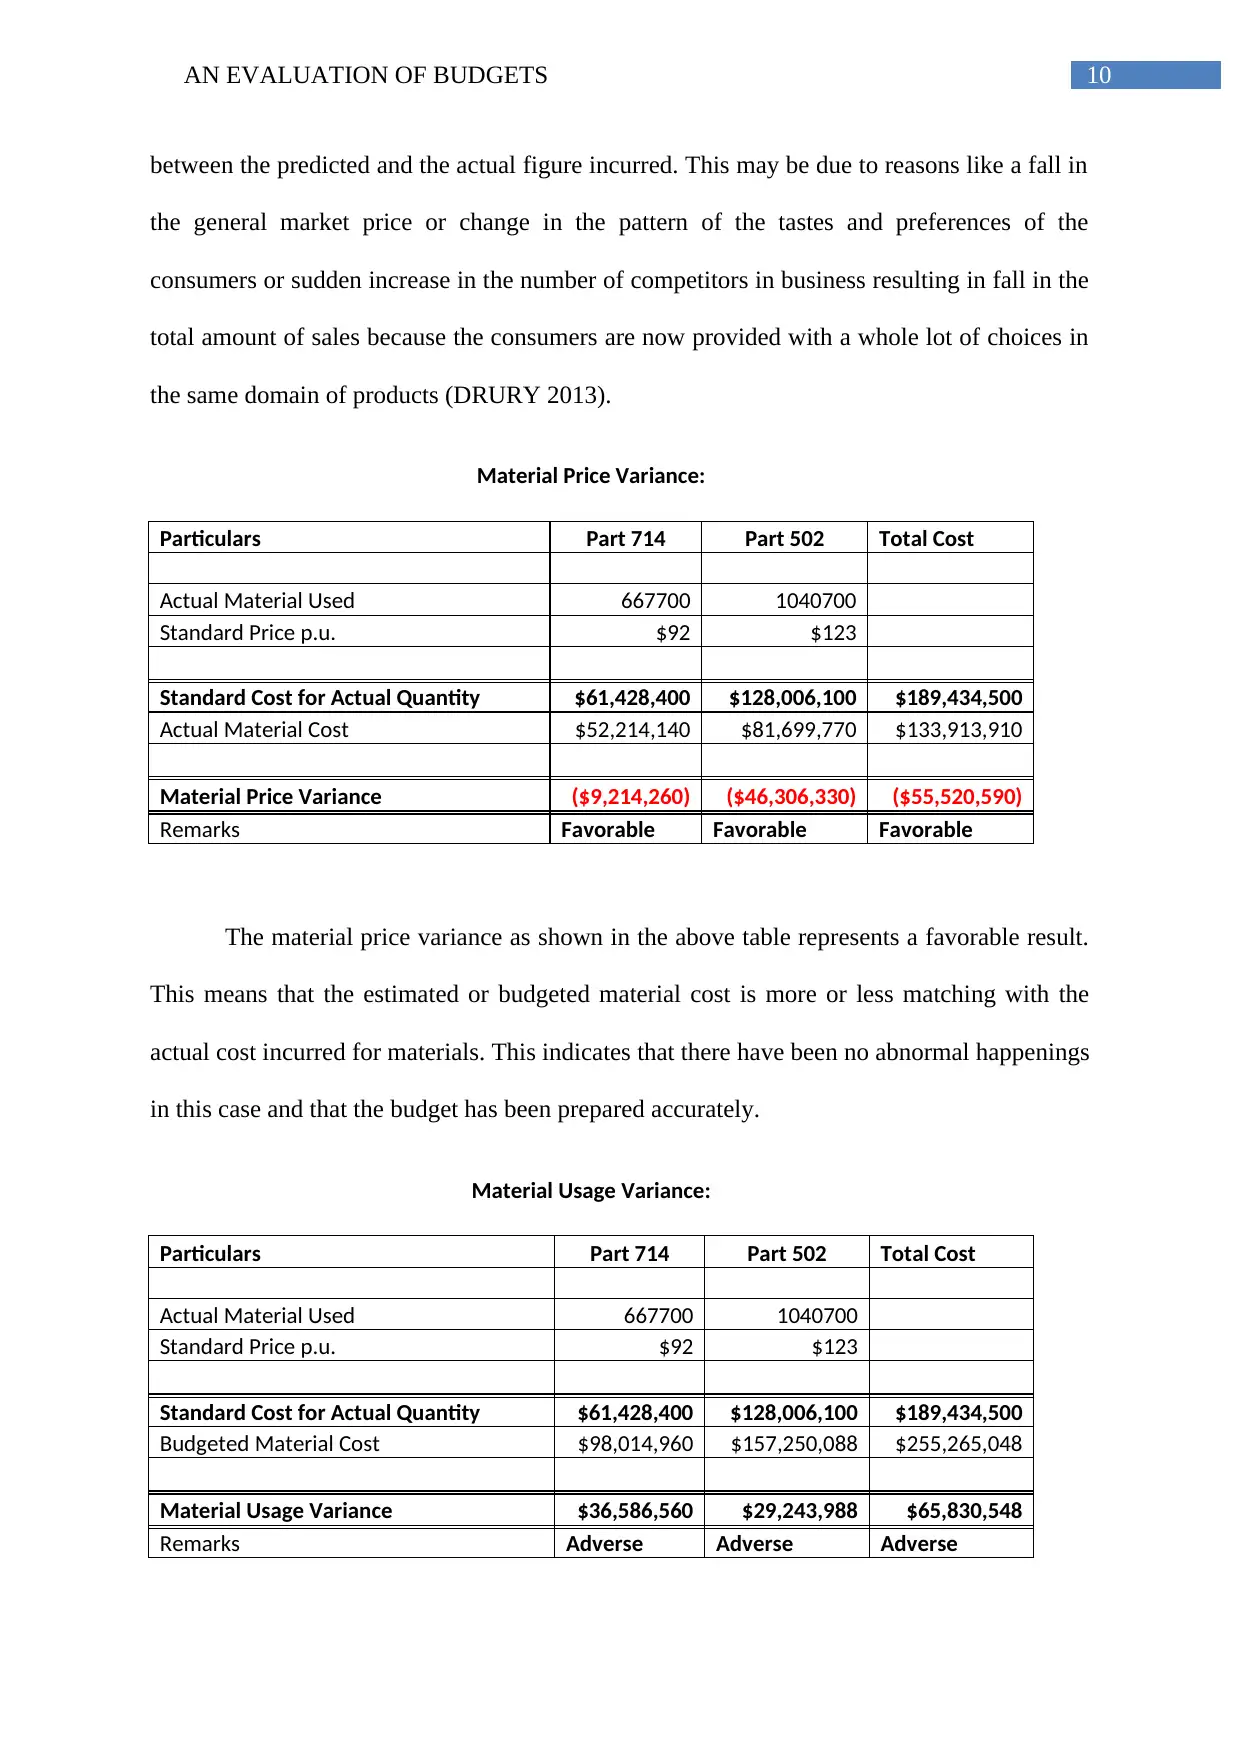
between the predicted and the actual figure incurred. This may be due to reasons like a fall in
the general market price or change in the pattern of the tastes and preferences of the
consumers or sudden increase in the number of competitors in business resulting in fall in the
total amount of sales because the consumers are now provided with a whole lot of choices in
the same domain of products (DRURY 2013).
Material Price Variance:
Particulars Part 714 Part 502 Total Cost
Actual Material Used 667700 1040700
Standard Price p.u. $92 $123
Standard Cost for Actual Quantity $61,428,400 $128,006,100 $189,434,500
Actual Material Cost $52,214,140 $81,699,770 $133,913,910
Material Price Variance ($9,214,260) ($46,306,330) ($55,520,590)
Remarks Favorable Favorable Favorable
The material price variance as shown in the above table represents a favorable result.
This means that the estimated or budgeted material cost is more or less matching with the
actual cost incurred for materials. This indicates that there have been no abnormal happenings
in this case and that the budget has been prepared accurately.
Material Usage Variance:
Particulars Part 714 Part 502 Total Cost
Actual Material Used 667700 1040700
Standard Price p.u. $92 $123
Standard Cost for Actual Quantity $61,428,400 $128,006,100 $189,434,500
Budgeted Material Cost $98,014,960 $157,250,088 $255,265,048
Material Usage Variance $36,586,560 $29,243,988 $65,830,548
Remarks Adverse Adverse Adverse
11AN EVALUATION OF BUDGETS
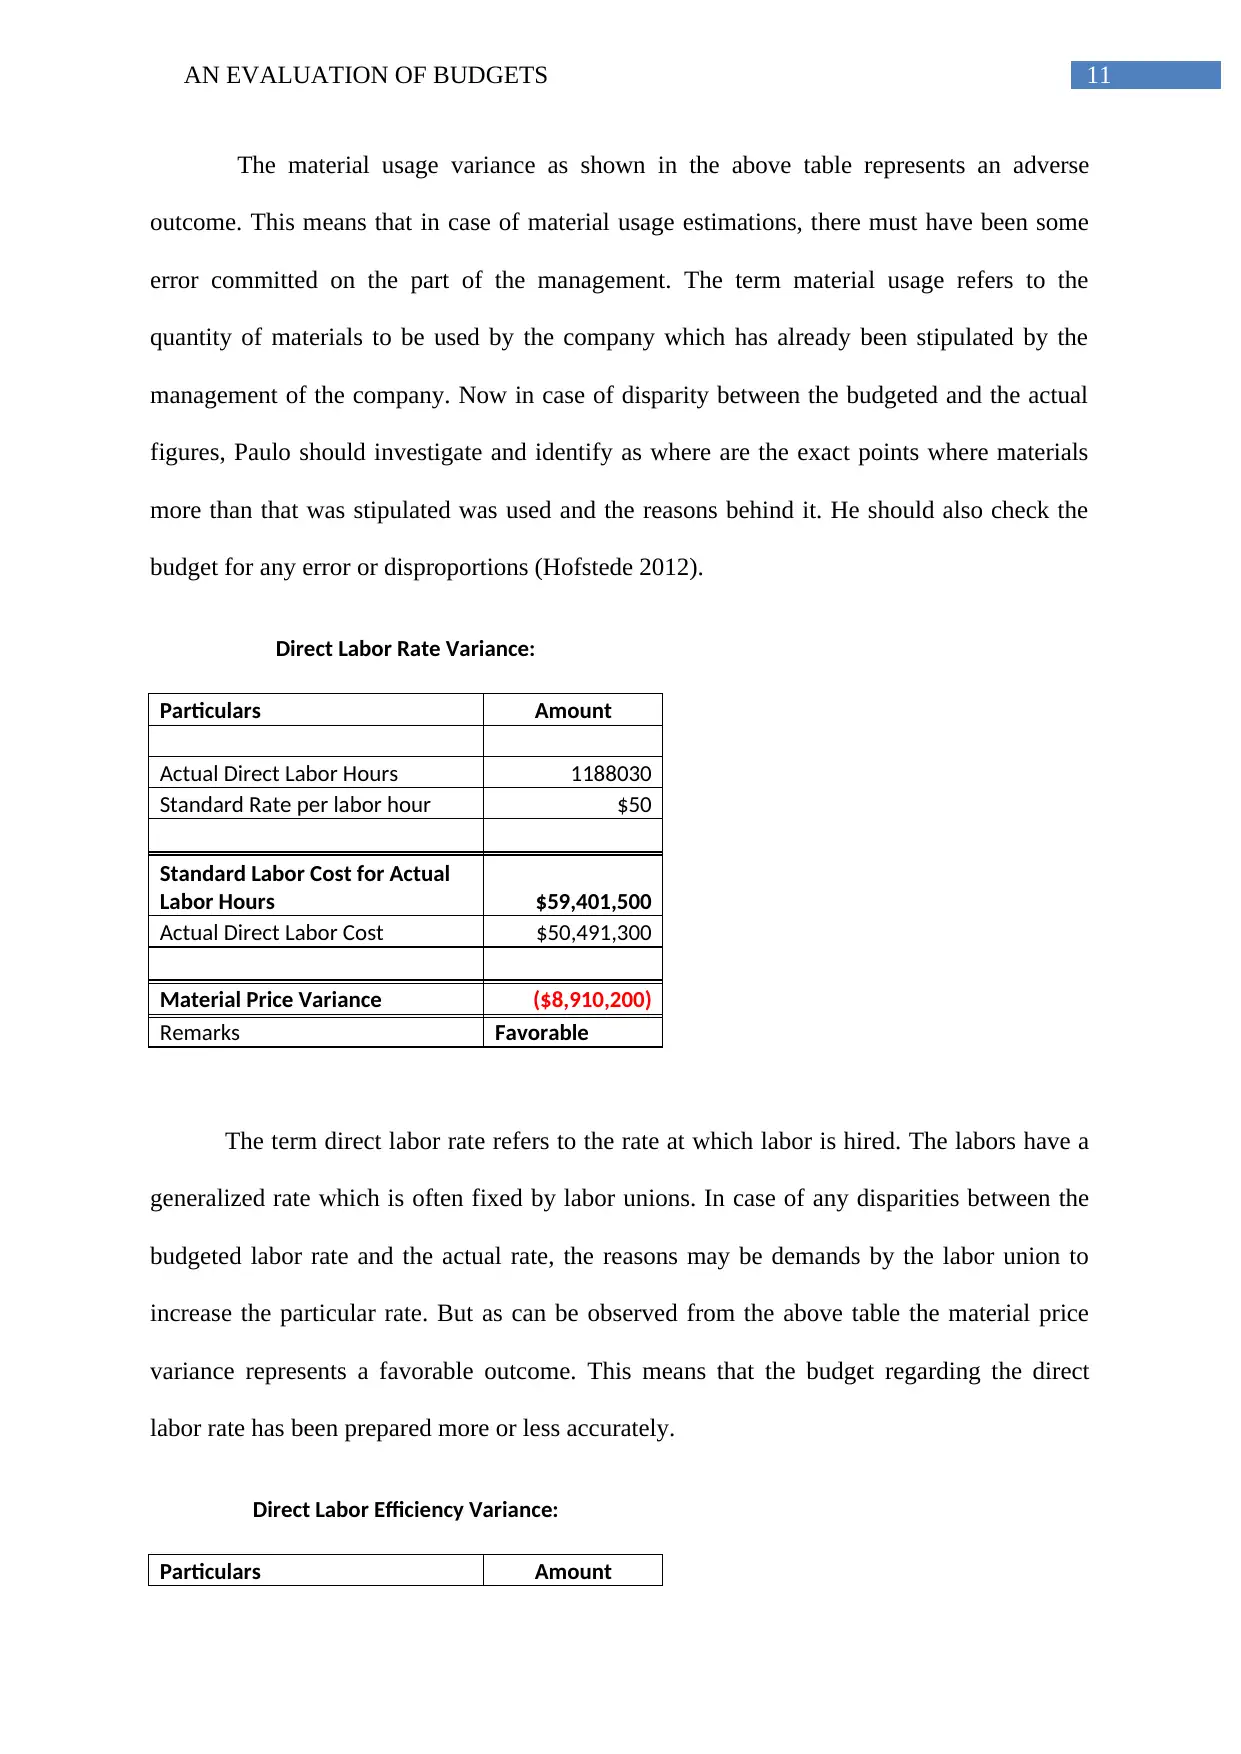
The material usage variance as shown in the above table represents an adverse
outcome. This means that in case of material usage estimations, there must have been some
error committed on the part of the management. The term material usage refers to the
quantity of materials to be used by the company which has already been stipulated by the
management of the company. Now in case of disparity between the budgeted and the actual
figures, Paulo should investigate and identify as where are the exact points where materials
more than that was stipulated was used and the reasons behind it. He should also check the
budget for any error or disproportions (Hofstede 2012).
Direct Labor Rate Variance:
Particulars Amount
Actual Direct Labor Hours 1188030
Standard Rate per labor hour $50
Standard Labor Cost for Actual
Labor Hours $59,401,500
Actual Direct Labor Cost $50,491,300
Material Price Variance ($8,910,200)
Remarks Favorable
The term direct labor rate refers to the rate at which labor is hired. The labors have a
generalized rate which is often fixed by labor unions. In case of any disparities between the
budgeted labor rate and the actual rate, the reasons may be demands by the labor union to
increase the particular rate. But as can be observed from the above table the material price
variance represents a favorable outcome. This means that the budget regarding the direct
labor rate has been prepared more or less accurately.
Direct Labor Efficiency Variance:
Particulars Amount
⊘ This is a preview!⊘
Do you want full access?
Subscribe today to unlock all pages.
Trusted by 1+ million students worldwide
1 out of 15
Related Documents


Your All-in-One AI-Powered Toolkit for Academic Success.
+13062052269
info@desklib.com
Available 24*7 on WhatsApp / Email
![[object Object]](/_next/static/media/star-bottom.7253800d.svg)
Unlock your academic potential
Copyright © 2020–2026 A2Z Services. All Rights Reserved. Developed and managed by ZUCOL.