Detailed Budgeting Report: KPI, NPV, Compensation and Rewards
VerifiedAdded on 2021/05/31
|6
|1170
|65
Report
AI Summary
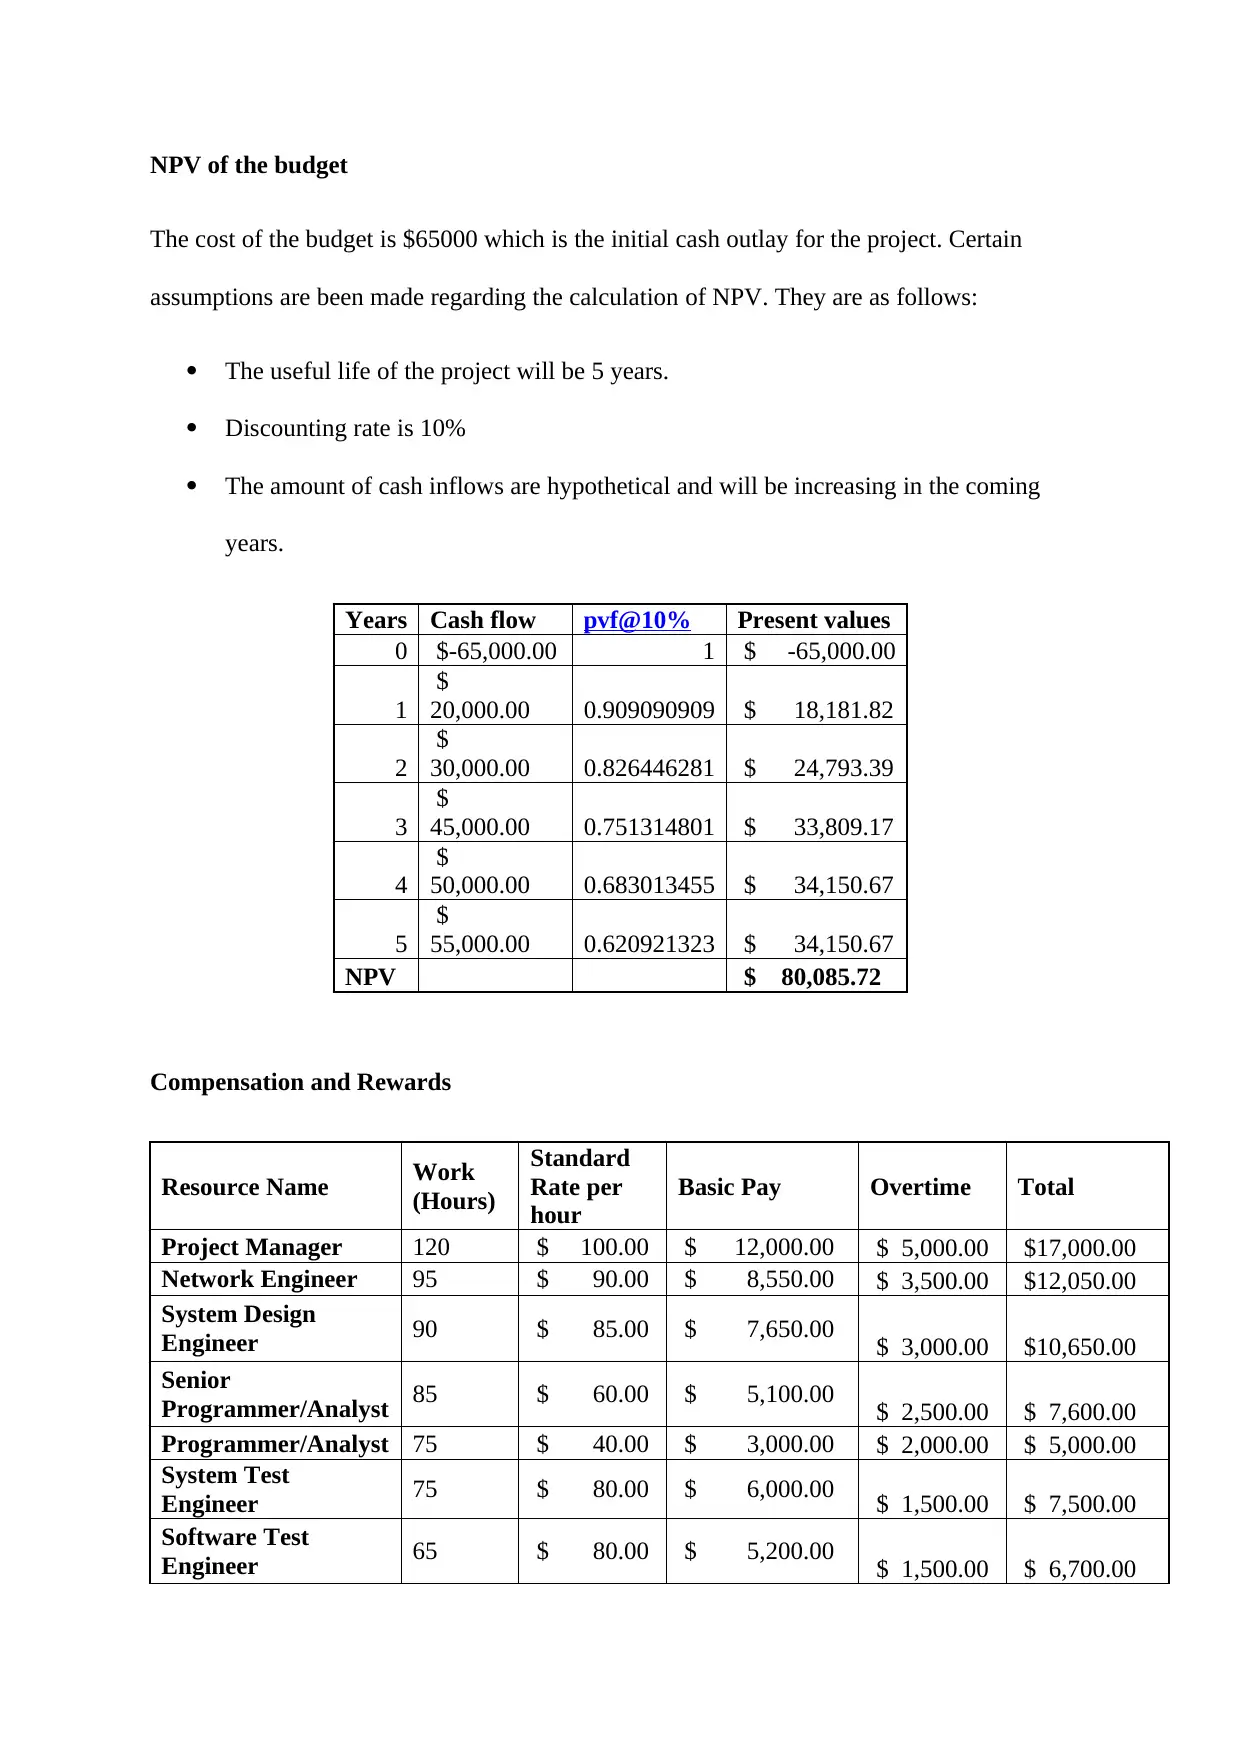
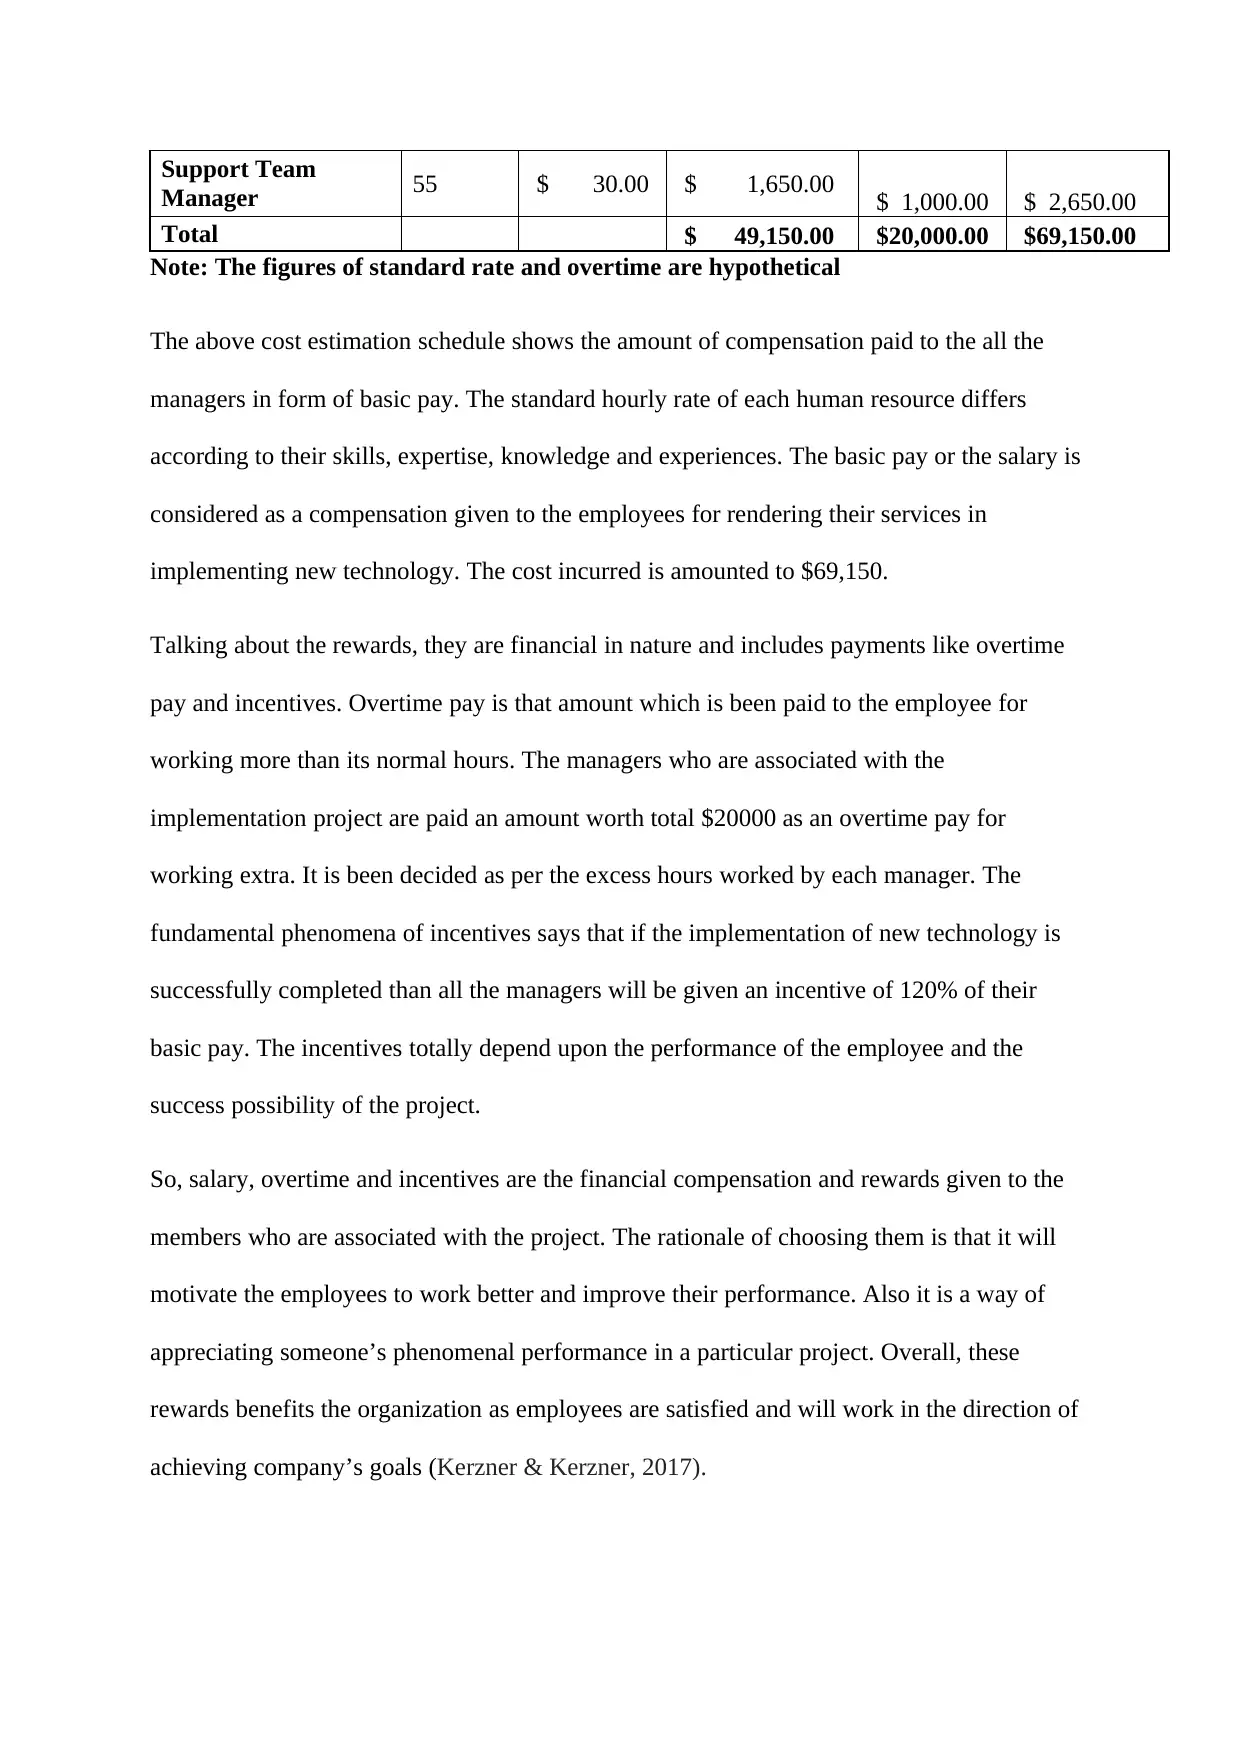
This report delves into the critical aspects of budgeting, focusing on Key Performance Indicators (KPIs) such as Earned Value Management (EVM) to assess project performance against planned outcomes. It highlights the importance of identifying gaps in technology implementation and centralizing project maps for effective teamwork. The report also presents a Net Present Value (NPV) analysis of a hypothetical budget, considering cash flows over a five-year period with a 10% discount rate. Furthermore, it includes a compensation and rewards schedule for project team members, detailing basic pay, overtime, and potential incentives, emphasizing the role of financial motivation in achieving project goals. The report references strategic planning and team training as crucial performance practices, as well as taking feedback from the team members. The report concludes by discussing the importance of these financial incentives in motivating employees and ensuring project success.

Budgeting
Paraphrase This Document
Need a fresh take? Get an instant paraphrase of this document with our AI Paraphraser

Part 1
Key performance indicators are the measures which are used to evaluate a project in terms of
quantity and quality. The KPIs evaluate the project against the expected outcomes and
confirms that all the set goals are achieved. In managing a technological implementation,
following are three main KPIs which are to be employed in order to know about the success
factor of the project.
Earned Value Management
It the most used performance indicator which reflected the variance or the difference between
the actual work done and the work planned. It is also used to calculate the cost variances that
is the amount of budget deficit or surplus during a particular period of time, expressed as a
difference between the value earned and actual cost incurred.
While implementing a new technology, it is very important to know about the amount that
will be earned by introducing the technology and the amount incurred for doing the same.
The difference will tell about the fact that whether the project is profitable in future or not. If
the earned value is more than the actual cost, then there is profit and in case of vice versa,
there will be a loss.
EVM = Value Earned – Actual Cost
Identification of gaps
As it is known that no technology is perfect, so it is very important for the manager to quickly
identify the potential gaps in the new technology and other internal systems. The rationale
used for this KPI is that sometimes the technology introduced does not complies or aligns
with existing system. This may create problem in the functioning of the business. Therefore,
it is necessary to measure the gaps and fill them properly.

Centralizing the maps and timelines
The third KPI for successful implementation of the new technology is that is to centralize all
the project maps and timelines. This will enable the team to work in a centralized manner and
lead to the success of the project. The rationale behind this is to make the teams members
work in a single direction with a focus of implementing the technology successfully
(Parmenter, 2015).
Performance practices are the techniques that are employed for conducting the project and
making it successful. In introducing the technology following practices are been followed:
Strategic planning
A proper planning must be done before starting the project implementation work. All the
strategic goals and objectives should be clearly determined and a process should be form for
the implementation. This will eventually guide the members to work in correct direction
(CPA Australia. 2009).
Training the members
Proper training must be given to the project team members for implementing a new
technology. The people should be aware about the key facts and should know how to
implement and use the technology in the business.
Taking feedback
It is another the performance management practice that should be followed by the managers.
Taking the feedback of the team members and other key people during the process of
implementation will definitely led the project to success.
Part 2
⊘ This is a preview!⊘
Do you want full access?
Subscribe today to unlock all pages.

Trusted by 1+ million students worldwide

NPV of the budget
The cost of the budget is $65000 which is the initial cash outlay for the project. Certain
assumptions are been made regarding the calculation of NPV. They are as follows:
The useful life of the project will be 5 years.
Discounting rate is 10%
The amount of cash inflows are hypothetical and will be increasing in the coming
years.
Years Cash flow pvf@10% Present values
0 $-65,000.00 1 $ -65,000.00
1
$
20,000.00 0.909090909 $ 18,181.82
2
$
30,000.00 0.826446281 $ 24,793.39
3
$
45,000.00 0.751314801 $ 33,809.17
4
$
50,000.00 0.683013455 $ 34,150.67
5
$
55,000.00 0.620921323 $ 34,150.67
NPV $ 80,085.72
Compensation and Rewards
Resource Name Work
(Hours)
Standard
Rate per
hour
Basic Pay Overtime Total
Project Manager 120 $ 100.00 $ 12,000.00 $ 5,000.00 $17,000.00
Network Engineer 95 $ 90.00 $ 8,550.00 $ 3,500.00 $12,050.00
System Design
Engineer 90 $ 85.00 $ 7,650.00 $ 3,000.00 $10,650.00
Senior
Programmer/Analyst 85 $ 60.00 $ 5,100.00 $ 2,500.00 $ 7,600.00
Programmer/Analyst 75 $ 40.00 $ 3,000.00 $ 2,000.00 $ 5,000.00
System Test
Engineer 75 $ 80.00 $ 6,000.00 $ 1,500.00 $ 7,500.00
Software Test
Engineer 65 $ 80.00 $ 5,200.00 $ 1,500.00 $ 6,700.00
Paraphrase This Document
Need a fresh take? Get an instant paraphrase of this document with our AI Paraphraser

Support Team
Manager 55 $ 30.00 $ 1,650.00 $ 1,000.00 $ 2,650.00
Total $ 49,150.00 $20,000.00 $69,150.00
Note: The figures of standard rate and overtime are hypothetical
The above cost estimation schedule shows the amount of compensation paid to the all the
managers in form of basic pay. The standard hourly rate of each human resource differs
according to their skills, expertise, knowledge and experiences. The basic pay or the salary is
considered as a compensation given to the employees for rendering their services in
implementing new technology. The cost incurred is amounted to $69,150.
Talking about the rewards, they are financial in nature and includes payments like overtime
pay and incentives. Overtime pay is that amount which is been paid to the employee for
working more than its normal hours. The managers who are associated with the
implementation project are paid an amount worth total $20000 as an overtime pay for
working extra. It is been decided as per the excess hours worked by each manager. The
fundamental phenomena of incentives says that if the implementation of new technology is
successfully completed than all the managers will be given an incentive of 120% of their
basic pay. The incentives totally depend upon the performance of the employee and the
success possibility of the project.
So, salary, overtime and incentives are the financial compensation and rewards given to the
members who are associated with the project. The rationale of choosing them is that it will
motivate the employees to work better and improve their performance. Also it is a way of
appreciating someone’s phenomenal performance in a particular project. Overall, these
rewards benefits the organization as employees are satisfied and will work in the direction of
achieving company’s goals (Kerzner & Kerzner, 2017).

References
CPA Australia. (2009). Best practice in performance management. Retrieved from
https://www.cpaaustralia.com.au/~/media/corporate/allfiles/document/professional-
resources/business/best-practice-in-performance-management.pdf?la=en
Kerzner, H., & Kerzner, H. R. (2017). Project management: a systems approach to planning,
scheduling, and controlling. (10th ed.). New Jersey: John Wiley & Sons
Parmenter, D. (2015). Key performance indicators: developing, implementing, and using
winning KPIs. New Jersey: John Wiley & Sons.
⊘ This is a preview!⊘
Do you want full access?
Subscribe today to unlock all pages.

Trusted by 1+ million students worldwide
1 out of 6
Related Documents
Your All-in-One AI-Powered Toolkit for Academic Success.
+13062052269
info@desklib.com
Available 24*7 on WhatsApp / Email
Unlock your academic potential
Copyright © 2020–2025 A2Z Services. All Rights Reserved. Developed and managed by ZUCOL.


