A Study on Bullying and Mental Health Continuum in School Students
VerifiedAdded on 2020/04/21
|22
|4049
|281
Report
AI Summary
This report presents a comprehensive study on the association between bullying and the mental health continuum in secondary school students. The research investigates the impact of school climate, including social and physical aspects, on students' emotional and psychological wellbeing. Data was collected from 1678 students across eight schools in South Australia, utilizing a self-completion questionnaire. The study explores various factors such as safety, social relationships, and school connectedness. Key findings include the response rates across different schools, the role of age and sex on reliability, and the distribution of mental health continuum. The report also examines the factors contributing to student happiness and the results of Bartlett’s tests. Statistical methods like frequencies, reliability analysis using Cronbach's alpha, and factor analysis are employed to analyze the data. The study aims to provide recommendations for effective school policies and practices to enhance the mental and emotional wellbeing of adolescents, addressing issues like bullying, victimization, and mental health challenges such as depression and anxiety.
Running head: BULLYING AND MENTAL HEALTH CONTINUUM IN SCHOOL
STUDENTS
A study on Bullying and Mental Health Continuum in secondary school students
Name of the student
Name of the university
Author’s note
STUDENTS
A study on Bullying and Mental Health Continuum in secondary school students
Name of the student
Name of the university
Author’s note
Paraphrase This Document
Need a fresh take? Get an instant paraphrase of this document with our AI Paraphraser
1BULLYING AND MENTAL HEALTH CONTINUUM IN SCHOOL STUDENTS
Abstract
School climate has often been discussed as the quality and character of school life. Including
both the social and physical aspects of the school, school atmosphere could positively promote
behaviour, school achievement and the social & emotional development of the students. The
current study examined the association between students’ mental and emotional wellbeing and
factors pertaining to school climate. Recommendations for effective school policy and practice in
eight schools help to enhance the mental and emotional wellbeing of adolescents.
2BULLYING AND MENTAL HEALTH CONTINUUM IN SCHOOL STUDENTS
Table of Contents
Introduction: -..................................................................................................................................3
Statement of Purpose:-.................................................................................................................3
Purpose of the Study:-..................................................................................................................3
Research Questions:-....................................................................................................................4
Literature Review:-..........................................................................................................................4
Methods:-.........................................................................................................................................7
Study Design:-..............................................................................................................................7
Sampling / Participants:-..............................................................................................................7
Procedures:-.................................................................................................................................7
Data Analysis:-................................................................................................................................8
Frequencies:-................................................................................................................................8
Reliability...................................................................................................................................10
Factor Analysis..........................................................................................................................14
Bullying......................................................................................................................................14
Mental Health Continuum..........................................................................................................16
Ethical Consideration.....................................................................................................................17
Annotated Bibliography:-..........................................................................................................19
⊘ This is a preview!⊘
Do you want full access?
Subscribe today to unlock all pages.
Trusted by 1+ million students worldwide

3BULLYING AND MENTAL HEALTH CONTINUUM IN SCHOOL STUDENTS
Paraphrase This Document
Need a fresh take? Get an instant paraphrase of this document with our AI Paraphraser
4BULLYING AND MENTAL HEALTH CONTINUUM IN SCHOOL STUDENTS
Introduction: -
Statement of Purpose:-
The report is based on the statistical research of emotional and behavioural difficulties.
Aggregated responses from each item were compared to responses from a recent survey of
students attending schools in the southern metropolitan area of Adelaide. Association between
types of involvement in bullying, friendships and mental health status of the students of Australia
particularly identifies the abnormal behaviour of the psychological behaviour. Poor teacher and
peer relationships in school climate creates a lack of peer support, bullying, victimisation and
higher safety concerns that are related to declines in psychological adjustment such as self-
esteem and mental health issues such as symptoms of depression, anxiety and suicidality.
Therefore, we are evaluating the factors behind this to enhance moral identity development.
Purpose of the Study:-
Greater variability of the adjustment in response to bullying has also been detected. The
current study tested the relationship between mental and emotional wellbeing of the students and
factors pertaining to school climate targeting on the domains of safety, social relationships and
school connectedness. Data was collected using a self-completion questionnaire from 1678
students of 8 schools aged 11-16 years. Multilevel modelling was used to determine the healthy
school climate predictor of mental and emotional wellbeing of the students at each time point. A
sustained positive school climate promotes social, mental and emotional development and its
behavioural and learning outcomes guaranteeing both physical and social safety. Research of the
study has shown optimistic school climate is linked with enhanced academic achievement and
5BULLYING AND MENTAL HEALTH CONTINUUM IN SCHOOL STUDENTS
performance, psychological adjustment, satisfaction with school, sense of belonging, motivation
to learn, decreased manner issues and overall positive health of wellbeing.
Research Questions:-
What are the response rate among students of eight different schools?
What is the role of age and sex on the reliability of moral values and socio-economic approach?
How is mental health continuum distributed?
What are the main factors of happiness of the students?
How Bartlett’s tests result in moral development parameters?
How the component matrix and total variance resulting in both the moral evaluating parameter?
Literature Review:-
The first subject of study elaborates about data analysis about level of School satisfaction.
Responses of twelve questions are asked to gather responses about “school contentment”. A
Likert scale from 1 to 7 different levels (from very strongly disagree to very strongly disagree)
were introduced. To target analysis of “school connectedness and support”, we considered
“Questions about bullying”. Rigby and Slee (1991) developed the Peer Relation Scale (PRQ) that
involves the measurement of victim, bullying others and pro-social behaviour. Students
responded to the questions using the scale ranging from “never”, “once in a while”, “pretty
often” to “very often”. Questions from the pro-social subscale were involved in an assessment of
student relationships. Bully and victim subscales were included in an analysis testing the
⊘ This is a preview!⊘
Do you want full access?
Subscribe today to unlock all pages.
Trusted by 1+ million students worldwide
6BULLYING AND MENTAL HEALTH CONTINUUM IN SCHOOL STUDENTS
relationship of cognitive and hampering empathy with involvement in bullying. Bullying
analysis indicates how often students have been bullied. The question asked to students is “How
often in this year have you been bullied or harassed by a student or students at school?” The
responses taken in nominal scale are “every day”, “most days”, “one or two days a week”,
“about once a week”, “less than once a week” and “never”. This question enabled the detection
of students who had been bullied once a week or more often. A question to determine how safe
they feel from being bullied at school asked to respond. The question is “How safe do you feel
from being bullied or harassed at this school?” The responses are “not at all safe”, “only safe
sometimes”, “usually safe” and “always or nearly always safe”. The next scale of study is “The
Flourishing Scale” that is a summary measure of self-perceived success of a person in crucial
areas such as engagement, relationships, optimism, meaning, purpose and self-esteem. This scale
supplies an indication of whether one is psychologically flourishing (good mental health). This
uni-dimensional scale provided a single score that was an indication of general psychological
well-being of the students. The responses were on a 7-point Likert scale ranging from “very
strongly disagree” to “very strongly agree”.
Second subject of study is to investigate the Social, emotional and psychological well-being of
the school students. According to Keyes, it is tested in Mental Health Continuum Scale. Using
various aspects of three dimensions of well-being that are social, emotional and psychological,
the scale indicates whether a person is flourishing, languishing or has moderate mental health.
Students were asked to respond to the questions about how often they experienced hedonic and
eudemonic feelings using the scale of “never”, “once or twice”, “about once a week”, “2 or 3
times a week”, “almost every day” and “every day”.
Paraphrase This Document
Need a fresh take? Get an instant paraphrase of this document with our AI Paraphraser
7BULLYING AND MENTAL HEALTH CONTINUUM IN SCHOOL STUDENTS
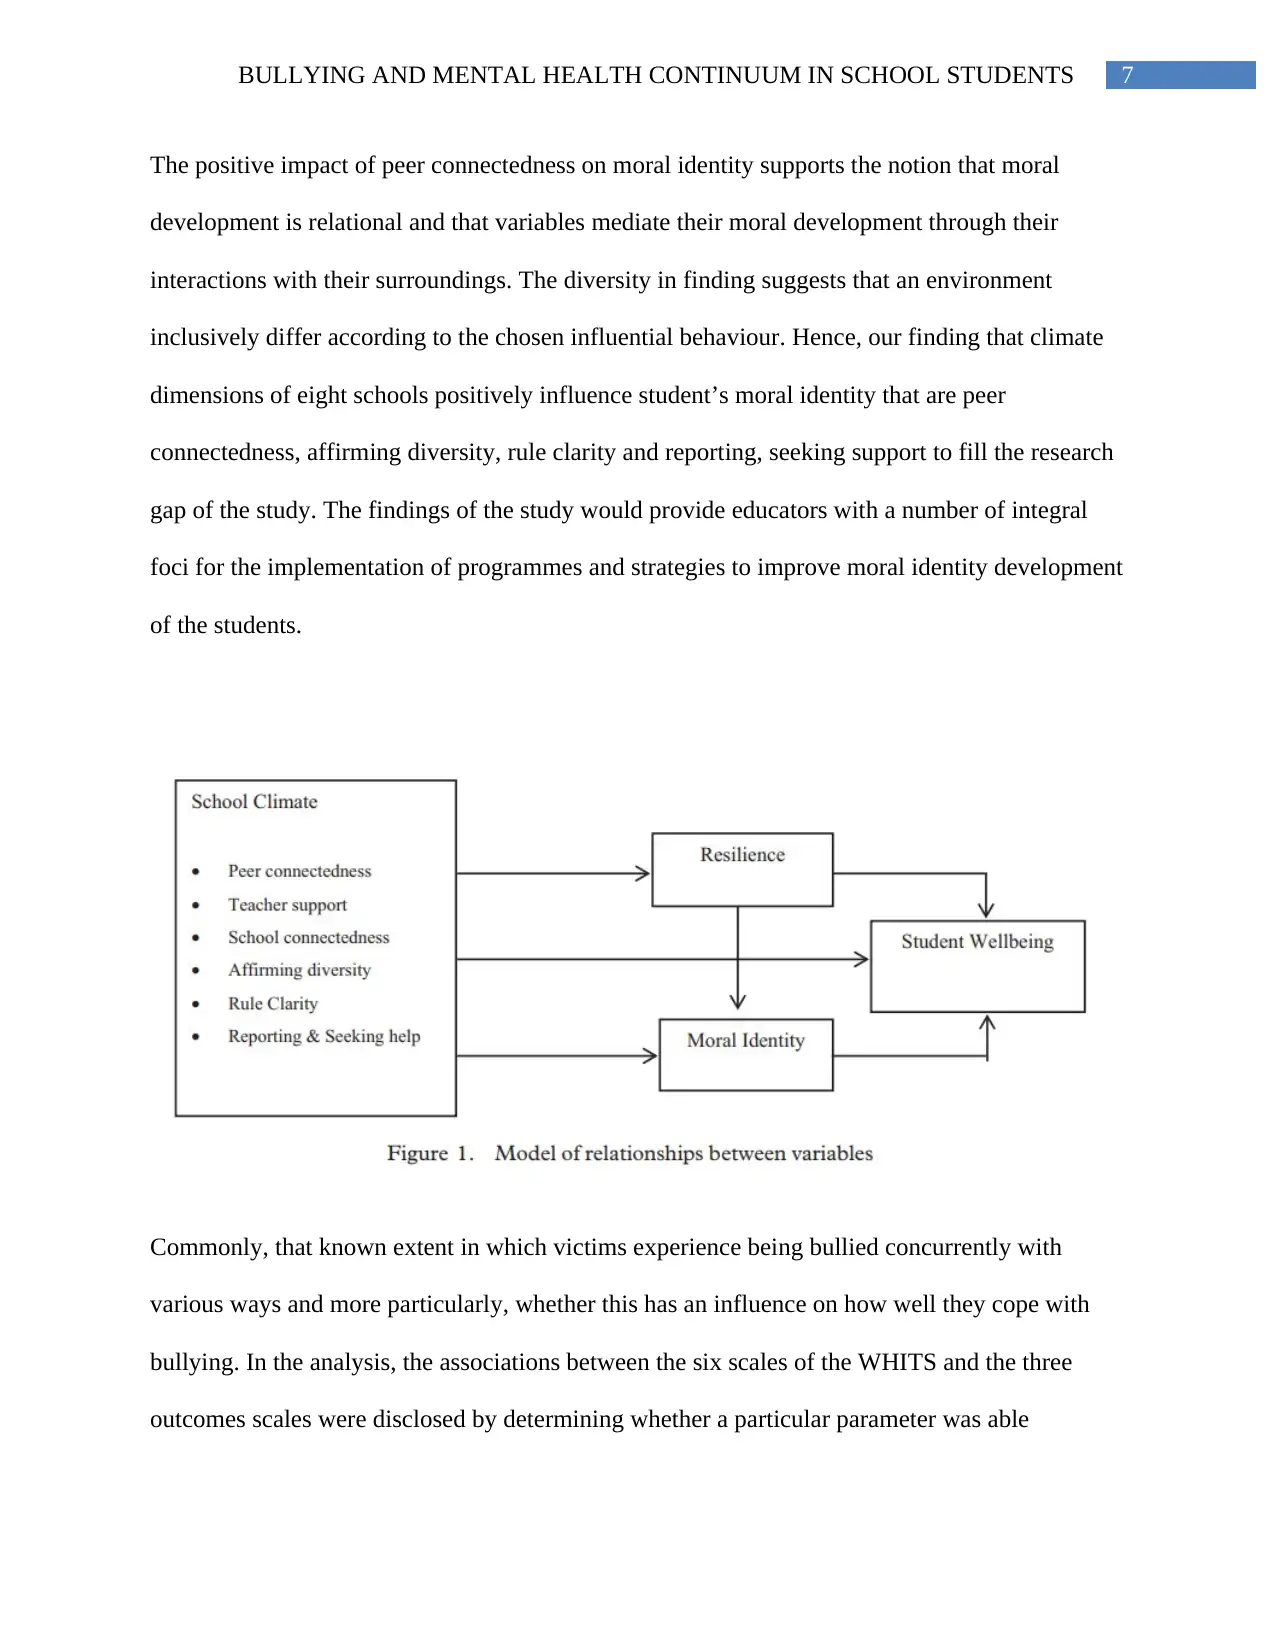
The positive impact of peer connectedness on moral identity supports the notion that moral
development is relational and that variables mediate their moral development through their
interactions with their surroundings. The diversity in finding suggests that an environment
inclusively differ according to the chosen influential behaviour. Hence, our finding that climate
dimensions of eight schools positively influence student’s moral identity that are peer
connectedness, affirming diversity, rule clarity and reporting, seeking support to fill the research
gap of the study. The findings of the study would provide educators with a number of integral
foci for the implementation of programmes and strategies to improve moral identity development
of the students.
Commonly, that known extent in which victims experience being bullied concurrently with
various ways and more particularly, whether this has an influence on how well they cope with
bullying. In the analysis, the associations between the six scales of the WHITS and the three
outcomes scales were disclosed by determining whether a particular parameter was able
8BULLYING AND MENTAL HEALTH CONTINUUM IN SCHOOL STUDENTS
statistically to estimate significantly the potential relationships between the hypothetically
correlated scales.
Methods:-
Study Design:-
Students (n=1678, ages 11-16 years) attending South Australian metropolitan high schools
completed the ‘Living and learning at school: Bullying at school” survey in which students
reported the ways they were bullied and the strategies they would use to deal with bullying. We
prepared an interview method based on “problem-focus”, “emotion-focus”, “approach” and
“avoidance”.
Sampling / Participants:-
The increase of adolescent mental health problems in Australia is properly documented and
tabulated. The sample of present study involves the data of 1678 responses of eight independent
Catholic secondary schools in South Australia. The data includes the information about age,
location and gender and socio-economic status of the schools involved.
Procedures:-
The data gathered from students was analysed using structural equation modelling. The
distribution of age, gender and demographic data are needed to be identified to qualify the
students for eight Catholic schools. To examine the psychometric properties of the measurement
model, confirmatory factor analysis (CFA) was incorporated to provide evidence to support the
⊘ This is a preview!⊘
Do you want full access?
Subscribe today to unlock all pages.
Trusted by 1+ million students worldwide
9BULLYING AND MENTAL HEALTH CONTINUUM IN SCHOOL STUDENTS
convergent and discriminant validity. Reliability and convergent validity in terms of component
matrix were assessed by examining the item reliability of each measure, the composite reliability
of each construct and the average variance extracted. Item teliability was assessed by its factor
loading onto the underlying construct. The interpretation of composite reliability is similar to that
of Cronbach’s alpha, except that it takes into account the actual factor loadings rather than
assuming that each item is equally weighted in the composite-load determination.
To test the research hypotheses, the fitness of model was examined first. As Chi-square goodness
of fit test is sensitive to sample size, we have to fit the model using Comparative Fit Index (CFI),
Tucker Lewis Index (TLI) and Root Mean Square Approximations (RMSEA). CFI and TLI
values should be equal to the or greater than 0.9 and RMSEA values less than 0.05 to interpret
good empirical fit based on Kline’s recommendation.
Data Analysis:-
The analysis of the data shows that there were 1678 respondents. However, there is
missing data.
Frequencies:-
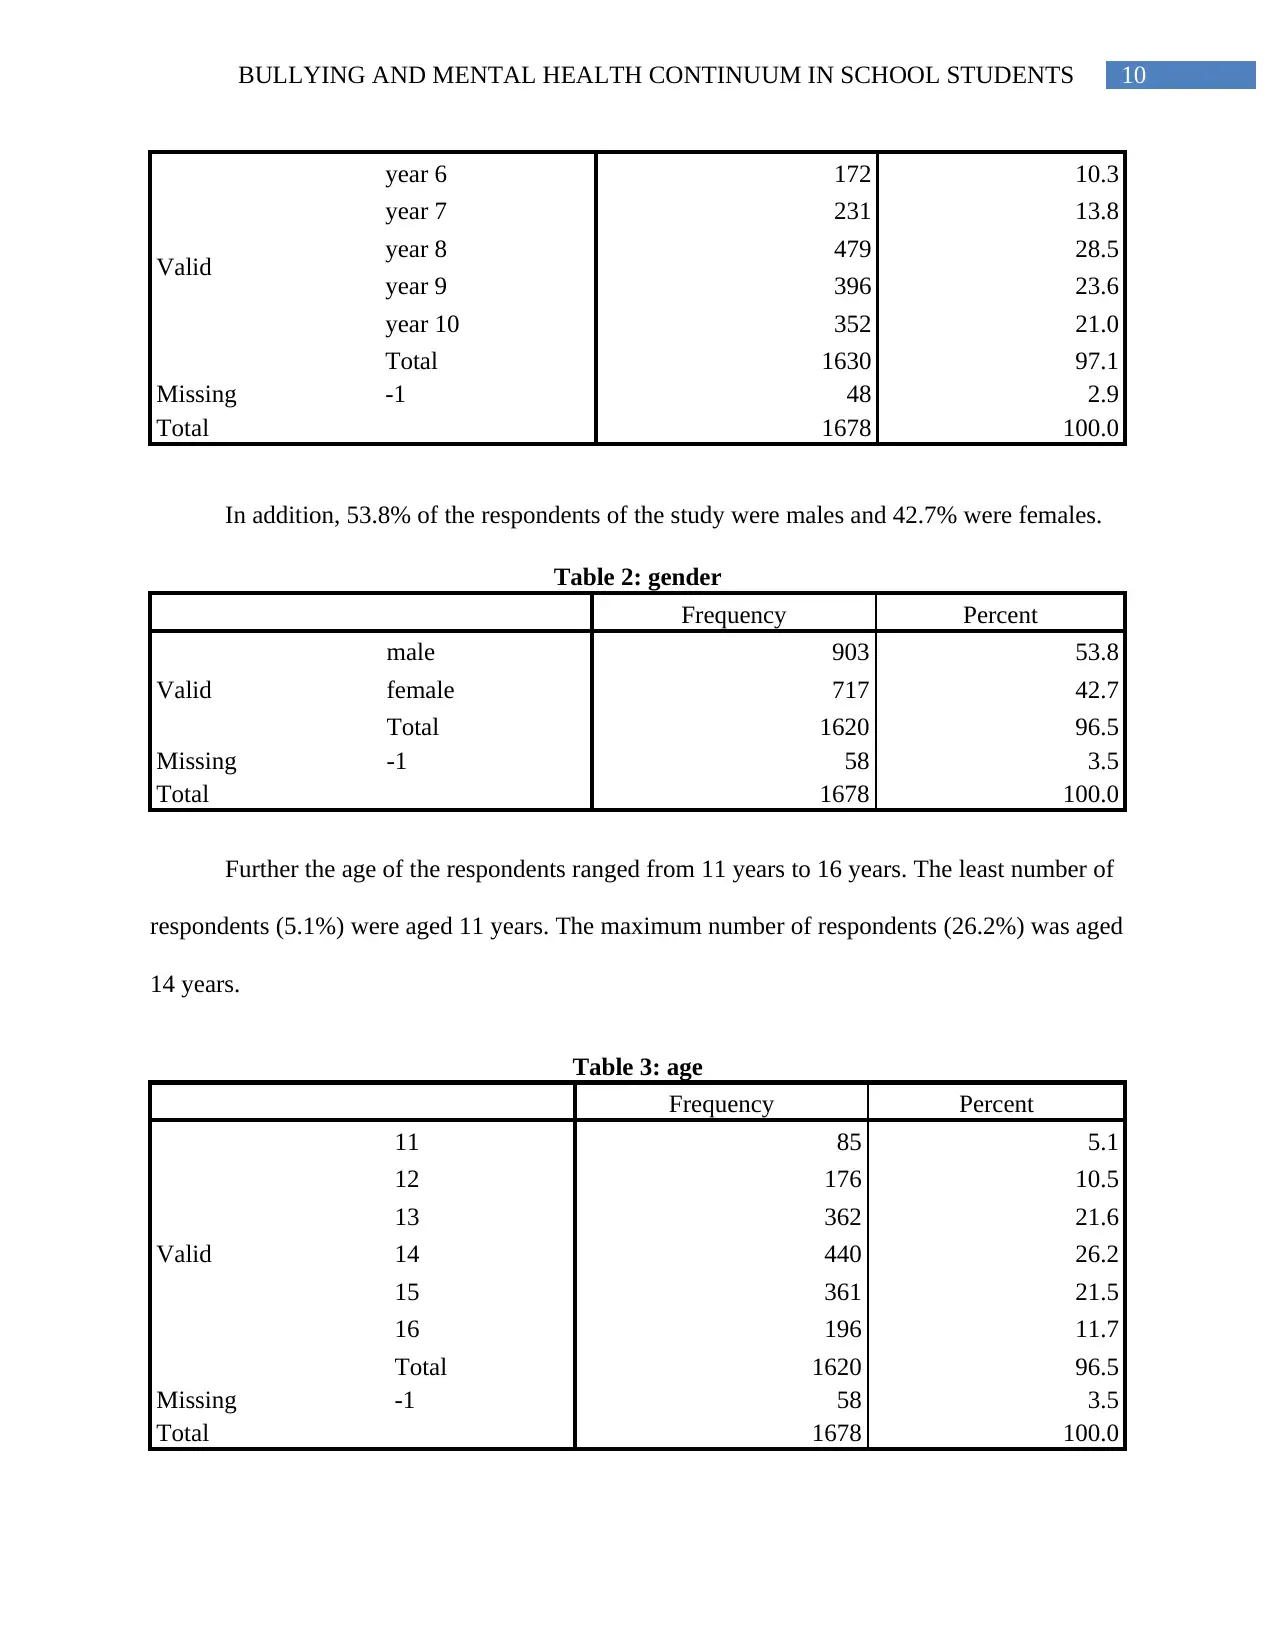
The analysis of the demographic profile of the students shows that most of the
respondents were in year 8, 28.5%. The least number of respondents in year 6 is 10.3%.
Table 1: year
Frequency Percent
convergent and discriminant validity. Reliability and convergent validity in terms of component
matrix were assessed by examining the item reliability of each measure, the composite reliability
of each construct and the average variance extracted. Item teliability was assessed by its factor
loading onto the underlying construct. The interpretation of composite reliability is similar to that
of Cronbach’s alpha, except that it takes into account the actual factor loadings rather than
assuming that each item is equally weighted in the composite-load determination.
To test the research hypotheses, the fitness of model was examined first. As Chi-square goodness
of fit test is sensitive to sample size, we have to fit the model using Comparative Fit Index (CFI),
Tucker Lewis Index (TLI) and Root Mean Square Approximations (RMSEA). CFI and TLI
values should be equal to the or greater than 0.9 and RMSEA values less than 0.05 to interpret
good empirical fit based on Kline’s recommendation.
Data Analysis:-
The analysis of the data shows that there were 1678 respondents. However, there is
missing data.
Frequencies:-
The analysis of the demographic profile of the students shows that most of the
respondents were in year 8, 28.5%. The least number of respondents in year 6 is 10.3%.
Table 1: year
Frequency Percent
Paraphrase This Document
Need a fresh take? Get an instant paraphrase of this document with our AI Paraphraser
10BULLYING AND MENTAL HEALTH CONTINUUM IN SCHOOL STUDENTS
Valid
year 6 172 10.3
year 7 231 13.8
year 8 479 28.5
year 9 396 23.6
year 10 352 21.0
Total 1630 97.1
Missing -1 48 2.9
Total 1678 100.0
In addition, 53.8% of the respondents of the study were males and 42.7% were females.
Table 2: gender
Frequency Percent
Valid
male 903 53.8
female 717 42.7
Total 1620 96.5
Missing -1 58 3.5
Total 1678 100.0
Further the age of the respondents ranged from 11 years to 16 years. The least number of
respondents (5.1%) were aged 11 years. The maximum number of respondents (26.2%) was aged
14 years.
Table 3: age
Frequency Percent
Valid
11 85 5.1
12 176 10.5
13 362 21.6
14 440 26.2
15 361 21.5
16 196 11.7
Total 1620 96.5
Missing -1 58 3.5
Total 1678 100.0
Valid
year 6 172 10.3
year 7 231 13.8
year 8 479 28.5
year 9 396 23.6
year 10 352 21.0
Total 1630 97.1
Missing -1 48 2.9
Total 1678 100.0
In addition, 53.8% of the respondents of the study were males and 42.7% were females.
Table 2: gender
Frequency Percent
Valid
male 903 53.8
female 717 42.7
Total 1620 96.5
Missing -1 58 3.5
Total 1678 100.0
Further the age of the respondents ranged from 11 years to 16 years. The least number of
respondents (5.1%) were aged 11 years. The maximum number of respondents (26.2%) was aged
14 years.
Table 3: age
Frequency Percent
Valid
11 85 5.1
12 176 10.5
13 362 21.6
14 440 26.2
15 361 21.5
16 196 11.7
Total 1620 96.5
Missing -1 58 3.5
Total 1678 100.0
11BULLYING AND MENTAL HEALTH CONTINUUM IN SCHOOL STUDENTS
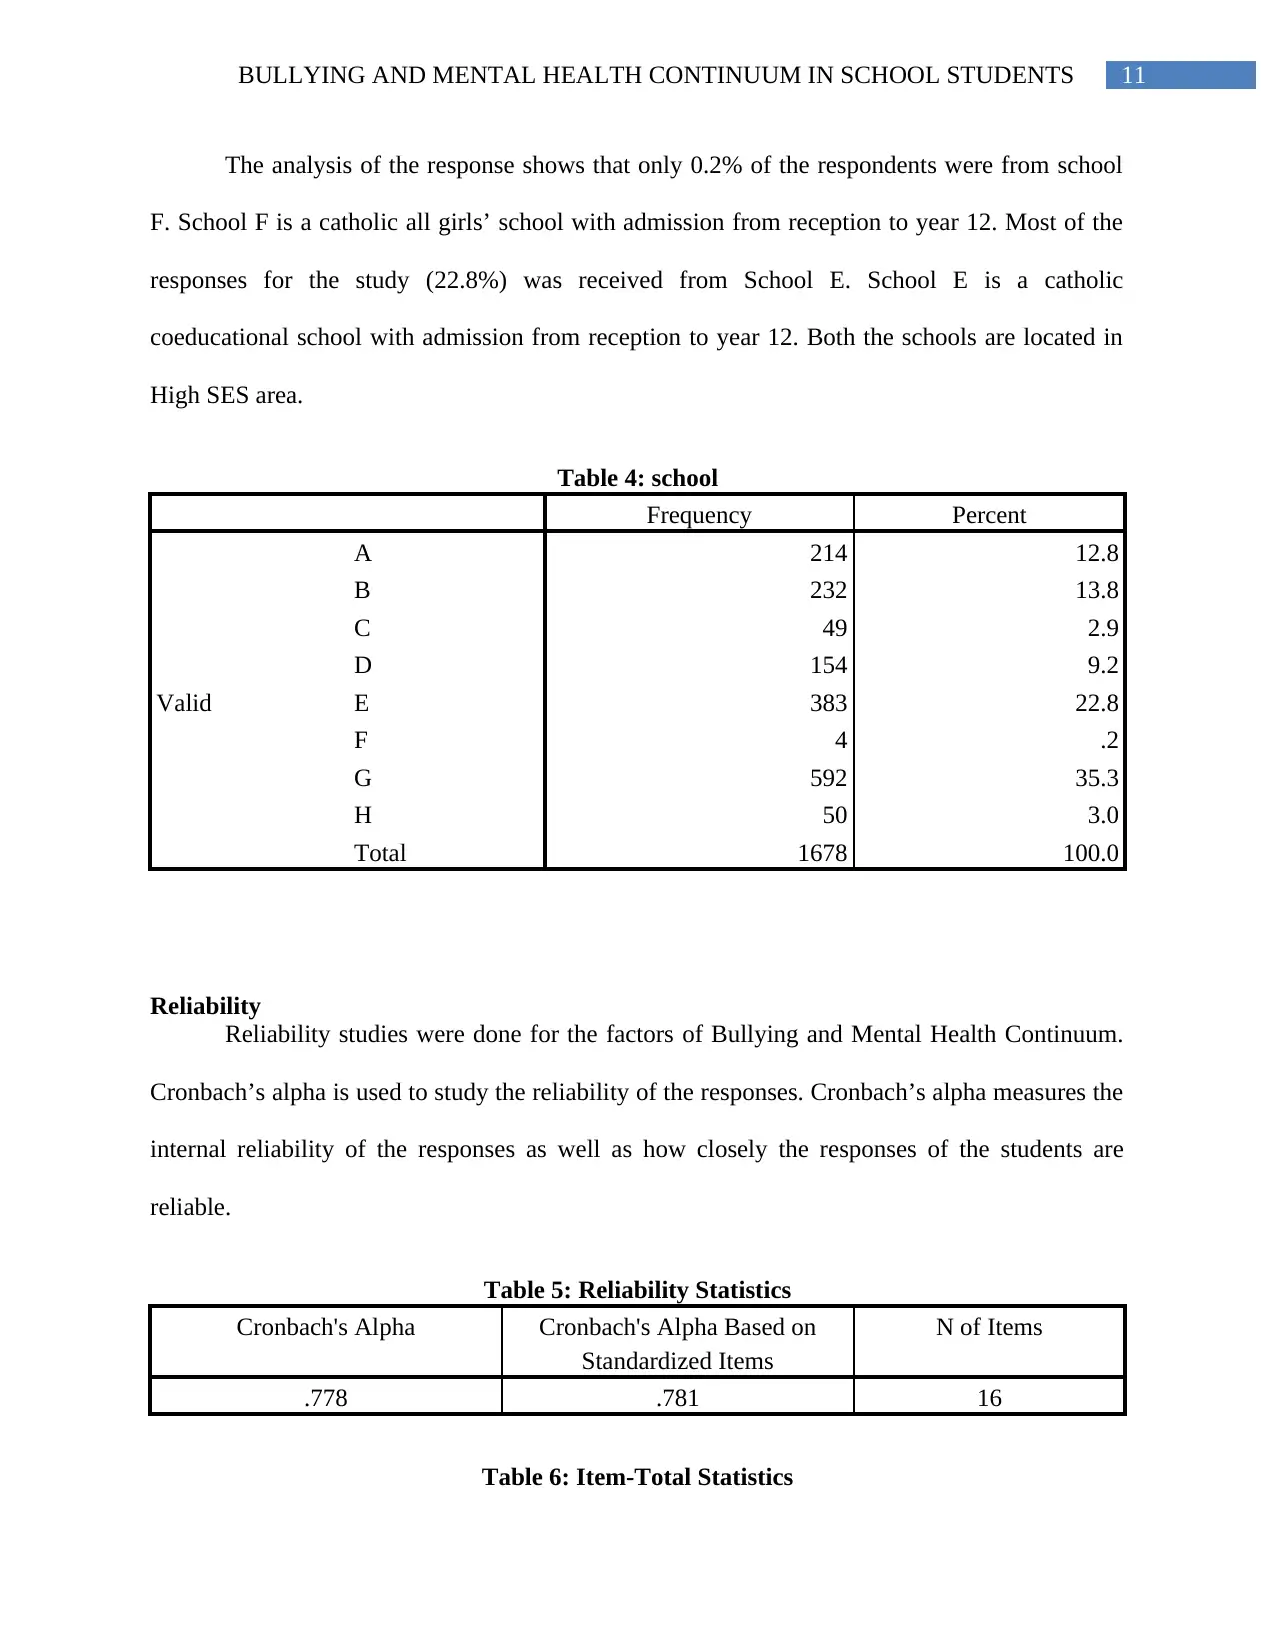
The analysis of the response shows that only 0.2% of the respondents were from school
F. School F is a catholic all girls’ school with admission from reception to year 12. Most of the
responses for the study (22.8%) was received from School E. School E is a catholic
coeducational school with admission from reception to year 12. Both the schools are located in
High SES area.
Table 4: school
Frequency Percent
Valid
A 214 12.8
B 232 13.8
C 49 2.9
D 154 9.2
E 383 22.8
F 4 .2
G 592 35.3
H 50 3.0
Total 1678 100.0
Reliability
Reliability studies were done for the factors of Bullying and Mental Health Continuum.
Cronbach’s alpha is used to study the reliability of the responses. Cronbach’s alpha measures the
internal reliability of the responses as well as how closely the responses of the students are
reliable.
Table 5: Reliability Statistics
Cronbach's Alpha Cronbach's Alpha Based on
Standardized Items
N of Items
.778 .781 16
Table 6: Item-Total Statistics
⊘ This is a preview!⊘
Do you want full access?
Subscribe today to unlock all pages.
Trusted by 1+ million students worldwide
1 out of 22
Related Documents


Your All-in-One AI-Powered Toolkit for Academic Success.
+13062052269
info@desklib.com
Available 24*7 on WhatsApp / Email
![[object Object]](/_next/static/media/star-bottom.7253800d.svg)
Unlock your academic potential
Copyright © 2020–2026 A2Z Services. All Rights Reserved. Developed and managed by ZUCOL.