BUQU 1230, Kwantlen: Assignment 1 - Descriptive and Inferential Stats

Verified

Added on  2022/08/23

|4
|1000
|27
Homework Assignment
AI Summary
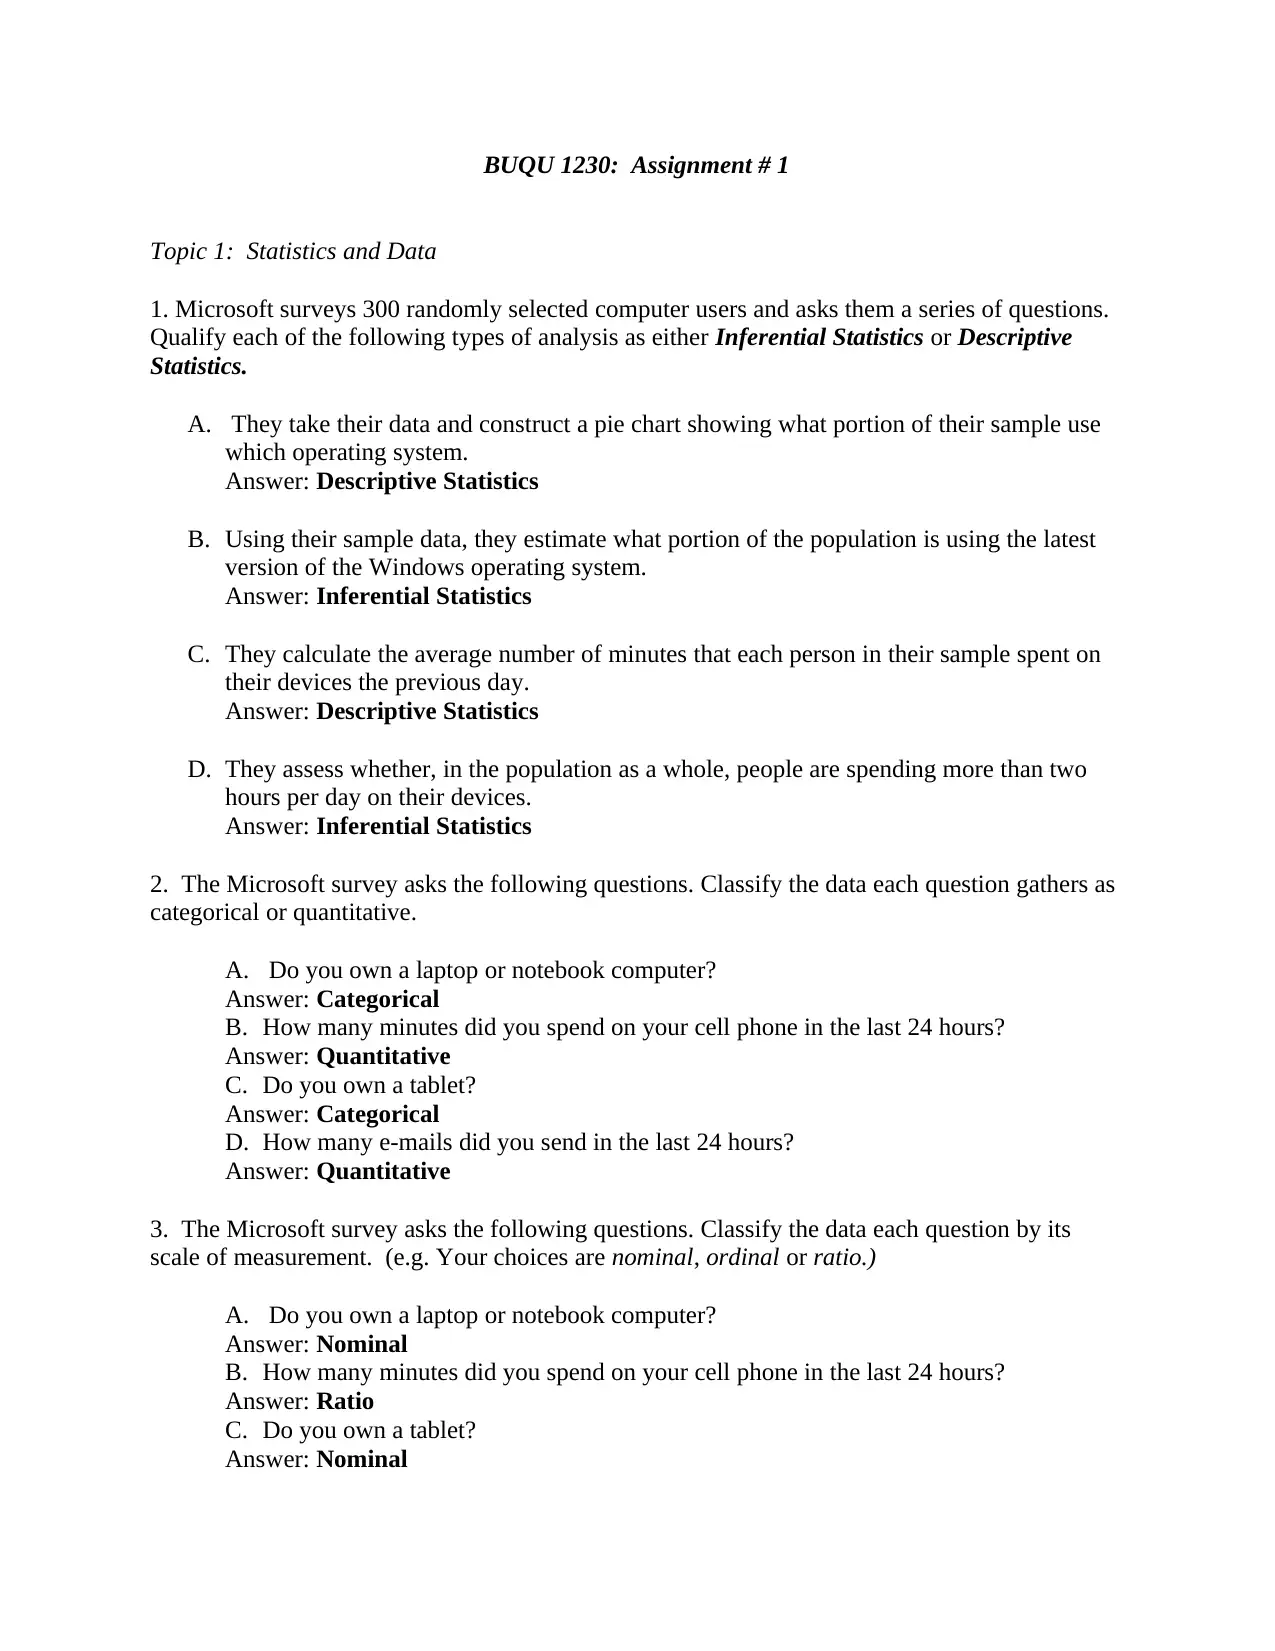
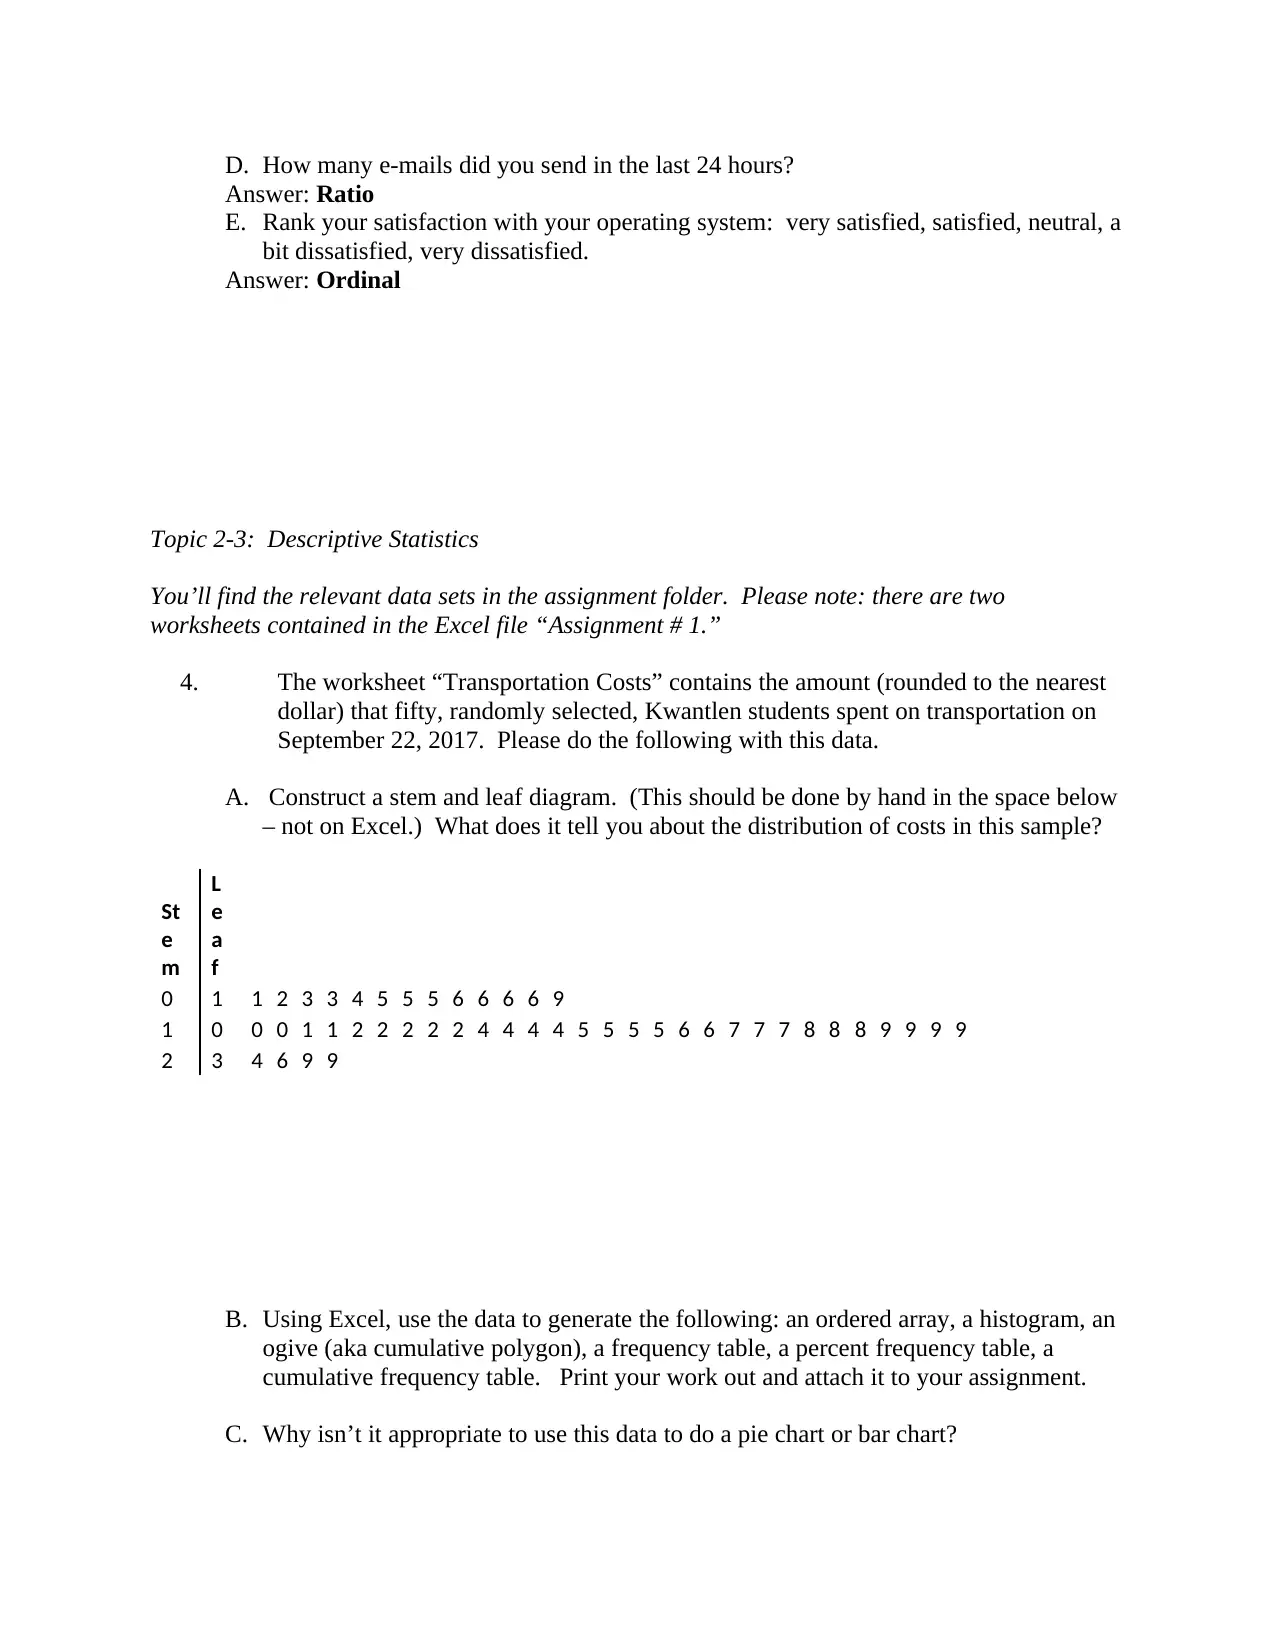
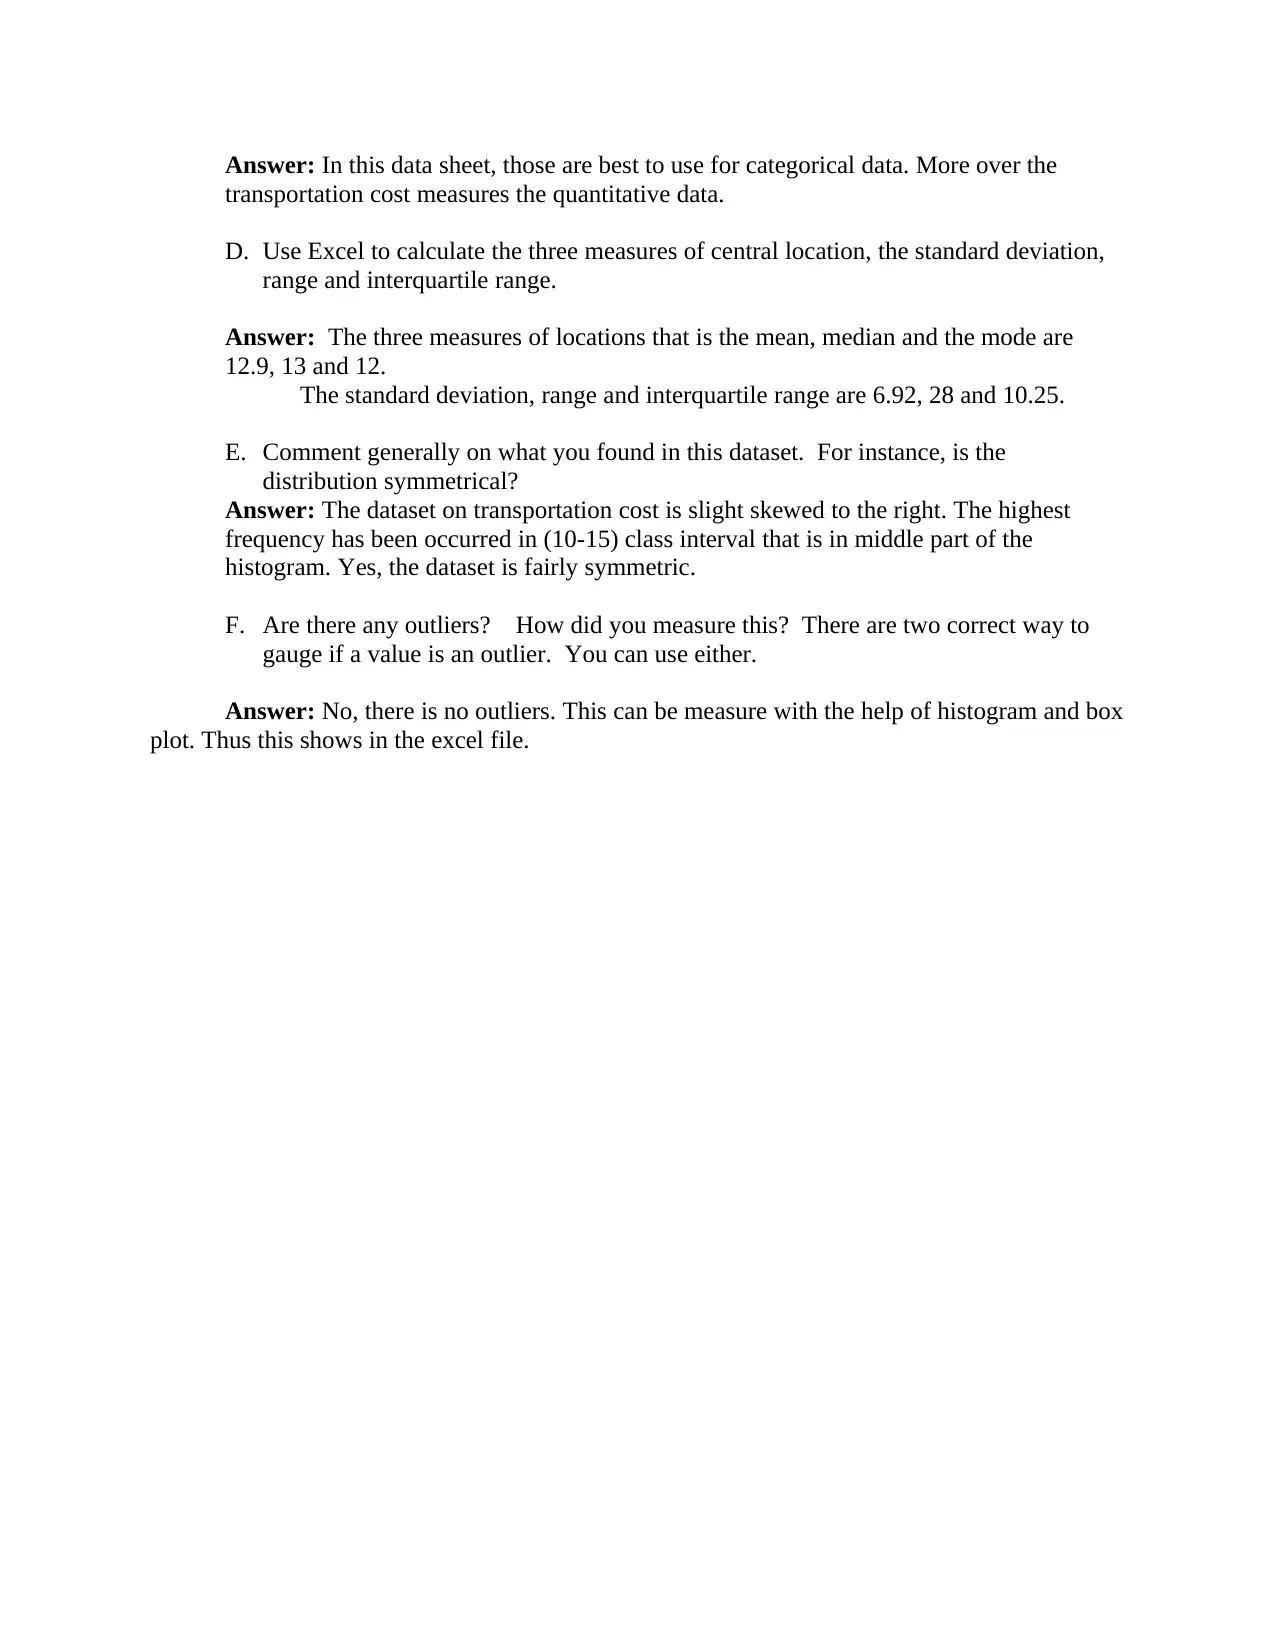
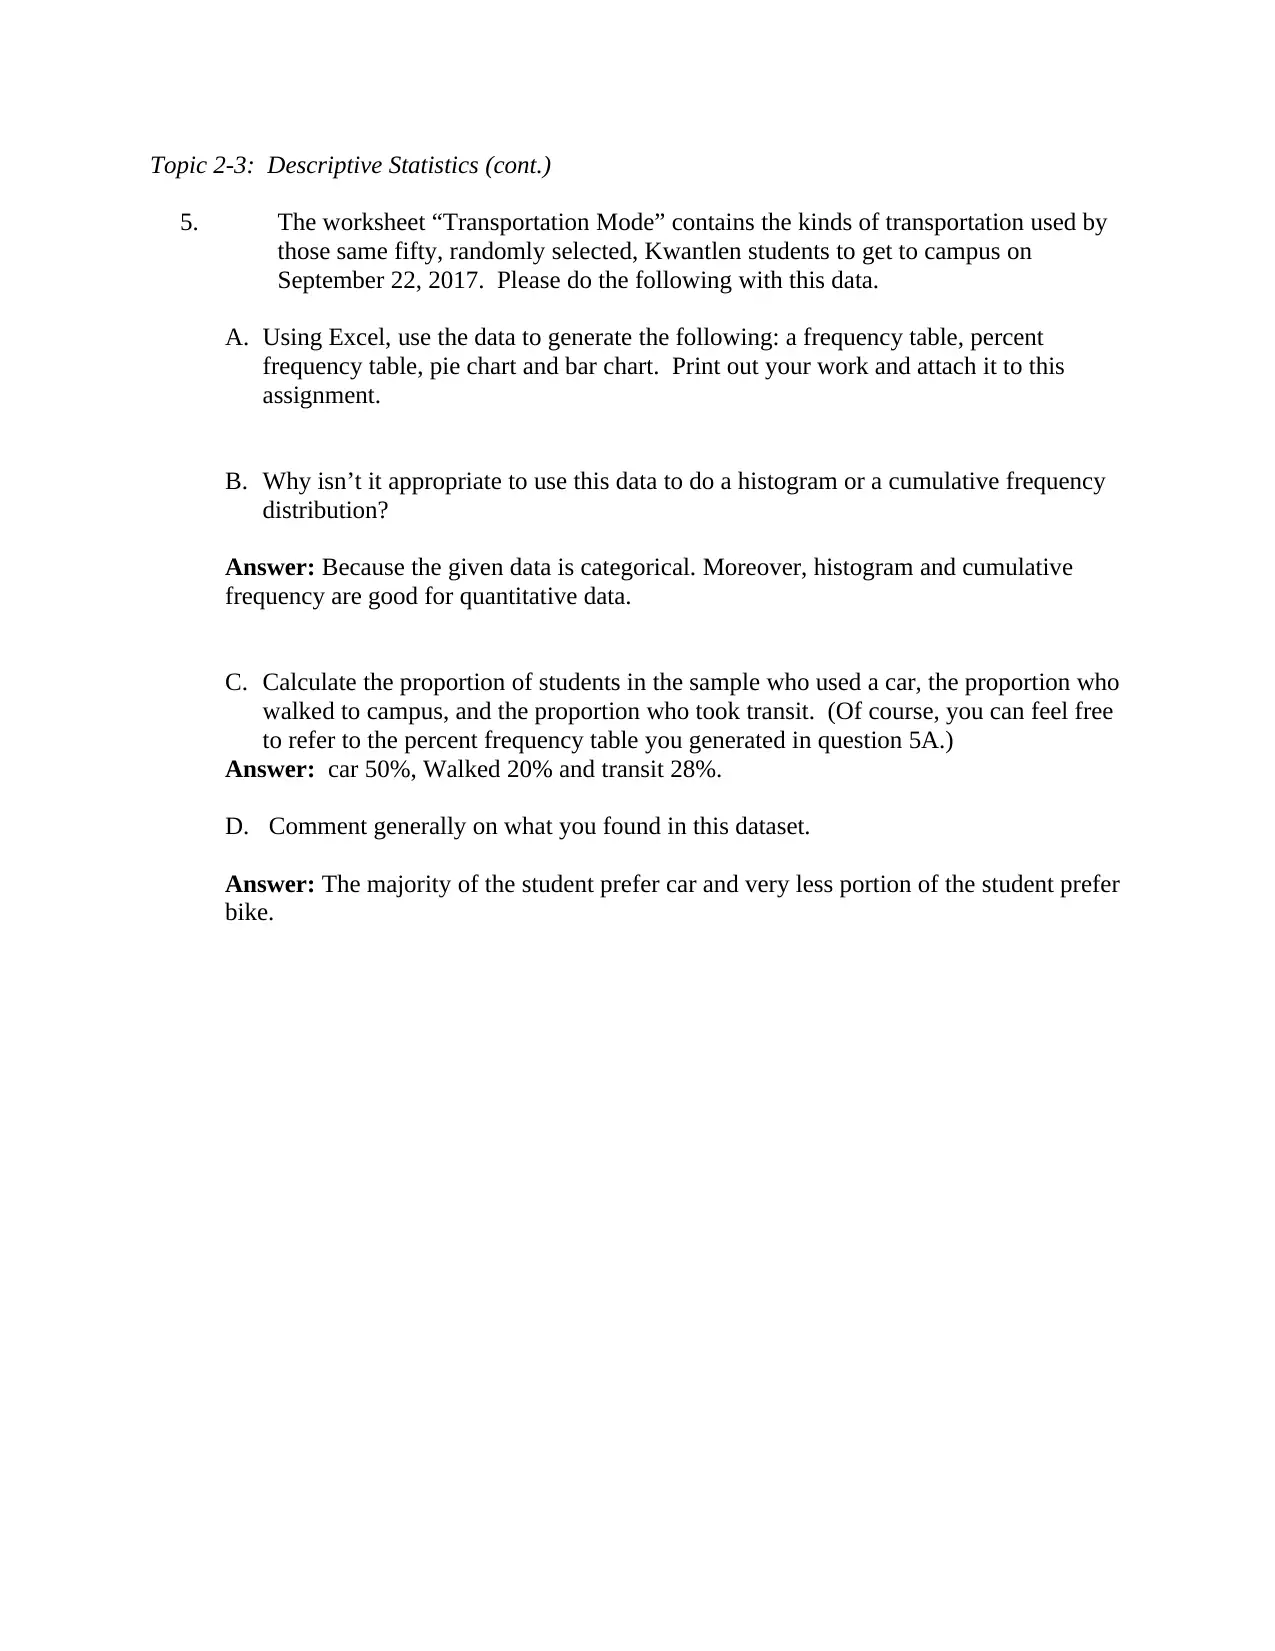
This assignment solution for BUQU 1230 covers fundamental statistical concepts and data analysis techniques. It begins by classifying types of statistical analysis as descriptive or inferential and categorizes data as categorical or quantitative, classifying the scale of measurement. The solution then delves into descriptive statistics using transportation cost data from Kwantlen students. It includes constructing a stem and leaf diagram, generating ordered arrays, histograms, ogives, frequency tables, and calculating measures of central location, standard deviation, and interquartile range using Excel. The solution also analyzes transportation mode data, generating frequency tables, percent frequency tables, pie charts, and bar charts. The assignment requires the calculation of proportions and drawing conclusions from the datasets, providing a comprehensive understanding of statistical methods and their application.
Document Page
BUQU 1230: Assignment # 1
Topic 1: Statistics and Data
1. Microsoft surveys 300 randomly selected computer users and asks them a series of questions.
Qualify each of the following types of analysis as either Inferential Statistics or Descriptive
Statistics.
A. They take their data and construct a pie chart showing what portion of their sample use
which operating system.
Answer: Descriptive Statistics
B. Using their sample data, they estimate what portion of the population is using the latest
version of the Windows operating system.
Answer: Inferential Statistics
C. They calculate the average number of minutes that each person in their sample spent on
their devices the previous day.
Answer: Descriptive Statistics
D. They assess whether, in the population as a whole, people are spending more than two
hours per day on their devices.
Answer: Inferential Statistics
2. The Microsoft survey asks the following questions. Classify the data each question gathers as
categorical or quantitative.
A. Do you own a laptop or notebook computer?
Answer: Categorical
B. How many minutes did you spend on your cell phone in the last 24 hours?
Answer: Quantitative
C. Do you own a tablet?
Answer: Categorical
D. How many e-mails did you send in the last 24 hours?
Answer: Quantitative
3. The Microsoft survey asks the following questions. Classify the data each question by its
scale of measurement. (e.g. Your choices are nominal, ordinal or ratio.)
A. Do you own a laptop or notebook computer?
Answer: Nominal
B. How many minutes did you spend on your cell phone in the last 24 hours?
Answer: Ratio
C. Do you own a tablet?
Answer: Nominal
tabler-icon-diamond-filled.svg

Paraphrase This Document

Need a fresh take? Get an instant paraphrase of this document with our AI Paraphraser
Document Page
D. How many e-mails did you send in the last 24 hours?
Answer: Ratio
E. Rank your satisfaction with your operating system: very satisfied, satisfied, neutral, a
bit dissatisfied, very dissatisfied.
Answer: Ordinal
Topic 2-3: Descriptive Statistics
You’ll find the relevant data sets in the assignment folder. Please note: there are two
worksheets contained in the Excel file “Assignment # 1.”
4. The worksheet “Transportation Costs” contains the amount (rounded to the nearest
dollar) that fifty, randomly selected, Kwantlen students spent on transportation on
September 22, 2017. Please do the following with this data.
A. Construct a stem and leaf diagram. (This should be done by hand in the space below
– not on Excel.) What does it tell you about the distribution of costs in this sample?
St
e
m
L
e
a
f
0 1 1 2 3 3 4 5 5 5 6 6 6 6 9
1 0 0 0 1 1 2 2 2 2 2 4 4 4 4 5 5 5 5 6 6 7 7 7 8 8 8 9 9 9 9
2 3 4 6 9 9
B. Using Excel, use the data to generate the following: an ordered array, a histogram, an
ogive (aka cumulative polygon), a frequency table, a percent frequency table, a
cumulative frequency table. Print your work out and attach it to your assignment.
C. Why isn’t it appropriate to use this data to do a pie chart or bar chart?
Document Page
Answer: In this data sheet, those are best to use for categorical data. More over the
transportation cost measures the quantitative data.
D. Use Excel to calculate the three measures of central location, the standard deviation,
range and interquartile range.
Answer: The three measures of locations that is the mean, median and the mode are
12.9, 13 and 12.
The standard deviation, range and interquartile range are 6.92, 28 and 10.25.
E. Comment generally on what you found in this dataset. For instance, is the
distribution symmetrical?
Answer: The dataset on transportation cost is slight skewed to the right. The highest
frequency has been occurred in (10-15) class interval that is in middle part of the
histogram. Yes, the dataset is fairly symmetric.
F. Are there any outliers? How did you measure this? There are two correct way to
gauge if a value is an outlier. You can use either.
Answer: No, there is no outliers. This can be measure with the help of histogram and box
plot. Thus this shows in the excel file.
Document Page
Topic 2-3: Descriptive Statistics (cont.)
5. The worksheet “Transportation Mode” contains the kinds of transportation used by
those same fifty, randomly selected, Kwantlen students to get to campus on
September 22, 2017. Please do the following with this data.
A. Using Excel, use the data to generate the following: a frequency table, percent
frequency table, pie chart and bar chart. Print out your work and attach it to this
assignment.
B. Why isn’t it appropriate to use this data to do a histogram or a cumulative frequency
distribution?
Answer: Because the given data is categorical. Moreover, histogram and cumulative
frequency are good for quantitative data.
C. Calculate the proportion of students in the sample who used a car, the proportion who
walked to campus, and the proportion who took transit. (Of course, you can feel free
to refer to the percent frequency table you generated in question 5A.)
Answer: car 50%, Walked 20% and transit 28%.
D. Comment generally on what you found in this dataset.
Answer: The majority of the student prefer car and very less portion of the student prefer
bike.
chevron_up_icon
1 out of 4
circle_padding
hide_on_mobile
zoom_out_icon
[object Object]