Financial Analysis Report on Burberry PLC: 2019-2020, Sections A & B
VerifiedAdded on 2021/06/11
|23
|3246
|1017
Report
AI Summary
This report presents a comprehensive financial analysis of Burberry Group PLC for the fiscal years 2019 and 2020, examining the impact of the COVID-19 pandemic and the adoption of IFRS 16. The report includes an executive summary, context, and detailed financial ratio analysis, focusing on revenue and gross margin growth, adjusted operating profit margin accretion, and capital efficiency. It compares Burberry's performance with its competitor, Mulberry, and the FTSE100 index, providing insights into risk and return on equity. The analysis covers key financial metrics, including revenue, gross margin, operating profit, ROCE, and operating cycle, highlighting the effects of the pandemic and regulatory changes. The report concludes with an assessment of Burberry's financial position, investment potential, and recommendations for future strategies, emphasizing digital platforms and sustainable products. The report is divided into two sections, the first dealing with Financial Analysis and the second dealing with Financial Management and risk and return.
Student Id - 2067206
2
SECTION A
FINANCIAL ANALYSIS REPORT BURBERRY PLC 2019-2020
1.0 EXECUTIVE SUMMARY:
During the financial year 2019-2020, Burberry Group Plc was on track to move to the second
phase of its strategic transformation with new collections delivering double digit growth and
taking a leadership position in digital sales that contributed to sales growth in the first nine
months of the year. However, Q4 was badly affected by Covid-19 pandemic. As a result, FY
2019/2020 results were significantly below the expectations. Revenue was £2.6 billion, down
3.2%. Reported operating profit was £189 million, down 57%, after charging £244m of
adjusting items, predominantly related to asset impairments resulting from the expected
impact of the pandemic.
digital strength, made it more resilient as to navigate through this challenging times. Burberry
group has sustained the Covid-19 crisis in a fair manner and the decrease in revenues and
operating margin are similar to industry standards. Introduction of the new IFRS16 regulations
has impacted significantly on the financial analysis of the Burberry Group Plc.
2.0 CONTEXT:
2.1 External Profile:
Burberry Plc is a British Luxury design house and clothing brand with headquarters in London,
England. Established in 1856, the company has now grown to become one of the most
valuable luxury brands worldwide. As per the data from 2019 (Figure-1), Burberry group stood
at 3rd position by revenues in leading luxury brands position in UK. Covid-19 crisis has slowed
a decade of growth across luxury categories that was buoyed by a bullish global economy.
Business outlooks remains uncertain because of the potential for the virus to remerge. At the
consumers become more environmentally, and socially aware and digital channels become
more important as sources of inspiration and sales. Companies that respond by streamlining
operations, redefining luxury to be less conspicuous and more inclusive, and investing in new
ways of doing business are more likely to not just power through these uncertain, changing
times but emerge stronger for the future.
Paraphrase This Document
Need a fresh take? Get an instant paraphrase of this document with our AI Paraphraser
Student Id - 2067206
3
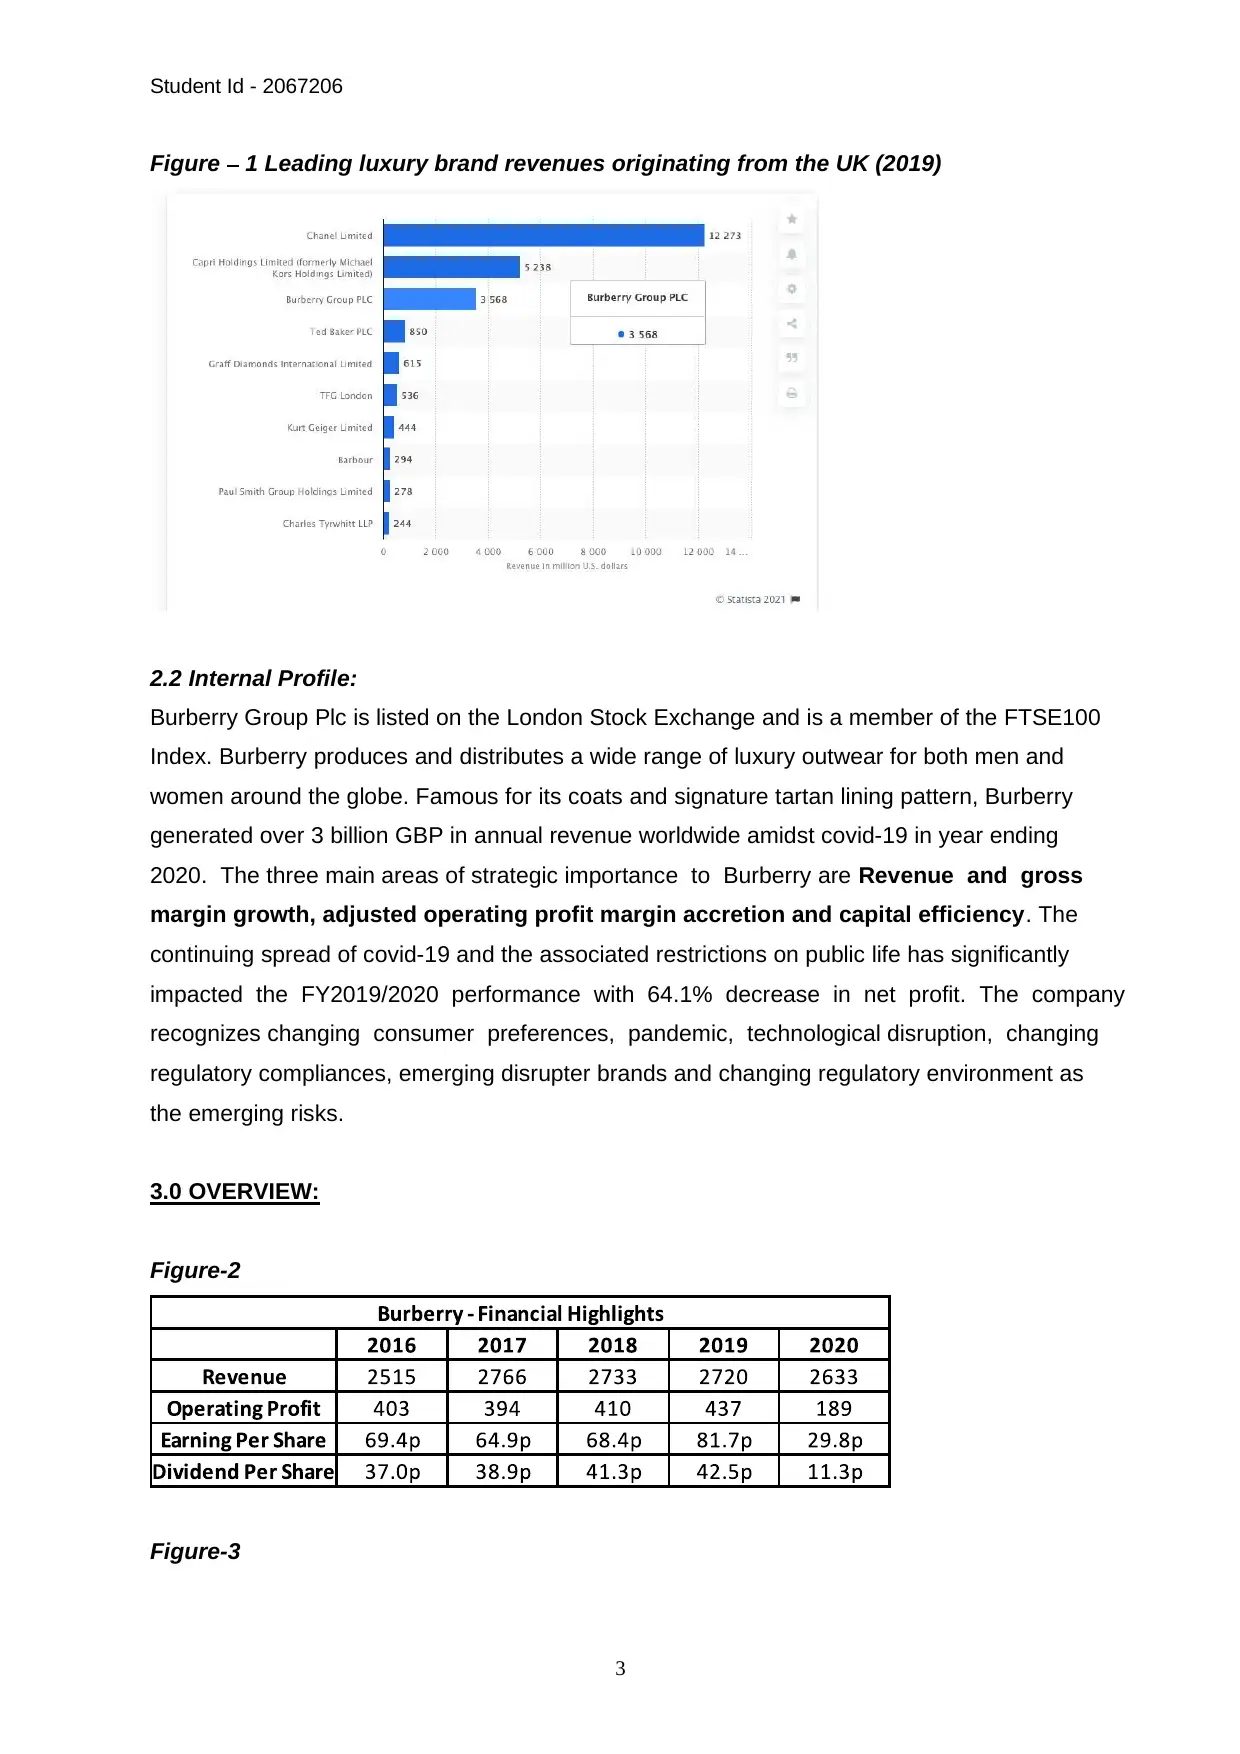
Figure 1 Leading luxury brand revenues originating from the UK (2019)
2.2 Internal Profile:
Burberry Group Plc is listed on the London Stock Exchange and is a member of the FTSE100
Index. Burberry produces and distributes a wide range of luxury outwear for both men and
women around the globe. Famous for its coats and signature tartan lining pattern, Burberry
generated over 3 billion GBP in annual revenue worldwide amidst covid-19 in year ending
2020. The three main areas of strategic importance to Burberry are Revenue and gross
margin growth, adjusted operating profit margin accretion and capital efficiency. The
continuing spread of covid-19 and the associated restrictions on public life has significantly
impacted the FY2019/2020 performance with 64.1% decrease in net profit. The company
recognizes changing consumer preferences, pandemic, technological disruption, changing
regulatory compliances, emerging disrupter brands and changing regulatory environment as
the emerging risks.
3.0 OVERVIEW:
Figure-2
Figure-3
3
Figure 1 Leading luxury brand revenues originating from the UK (2019)
2.2 Internal Profile:
Burberry Group Plc is listed on the London Stock Exchange and is a member of the FTSE100
Index. Burberry produces and distributes a wide range of luxury outwear for both men and
women around the globe. Famous for its coats and signature tartan lining pattern, Burberry
generated over 3 billion GBP in annual revenue worldwide amidst covid-19 in year ending
2020. The three main areas of strategic importance to Burberry are Revenue and gross
margin growth, adjusted operating profit margin accretion and capital efficiency. The
continuing spread of covid-19 and the associated restrictions on public life has significantly
impacted the FY2019/2020 performance with 64.1% decrease in net profit. The company
recognizes changing consumer preferences, pandemic, technological disruption, changing
regulatory compliances, emerging disrupter brands and changing regulatory environment as
the emerging risks.
3.0 OVERVIEW:
Figure-2
Figure-3
Student Id - 2067206
4
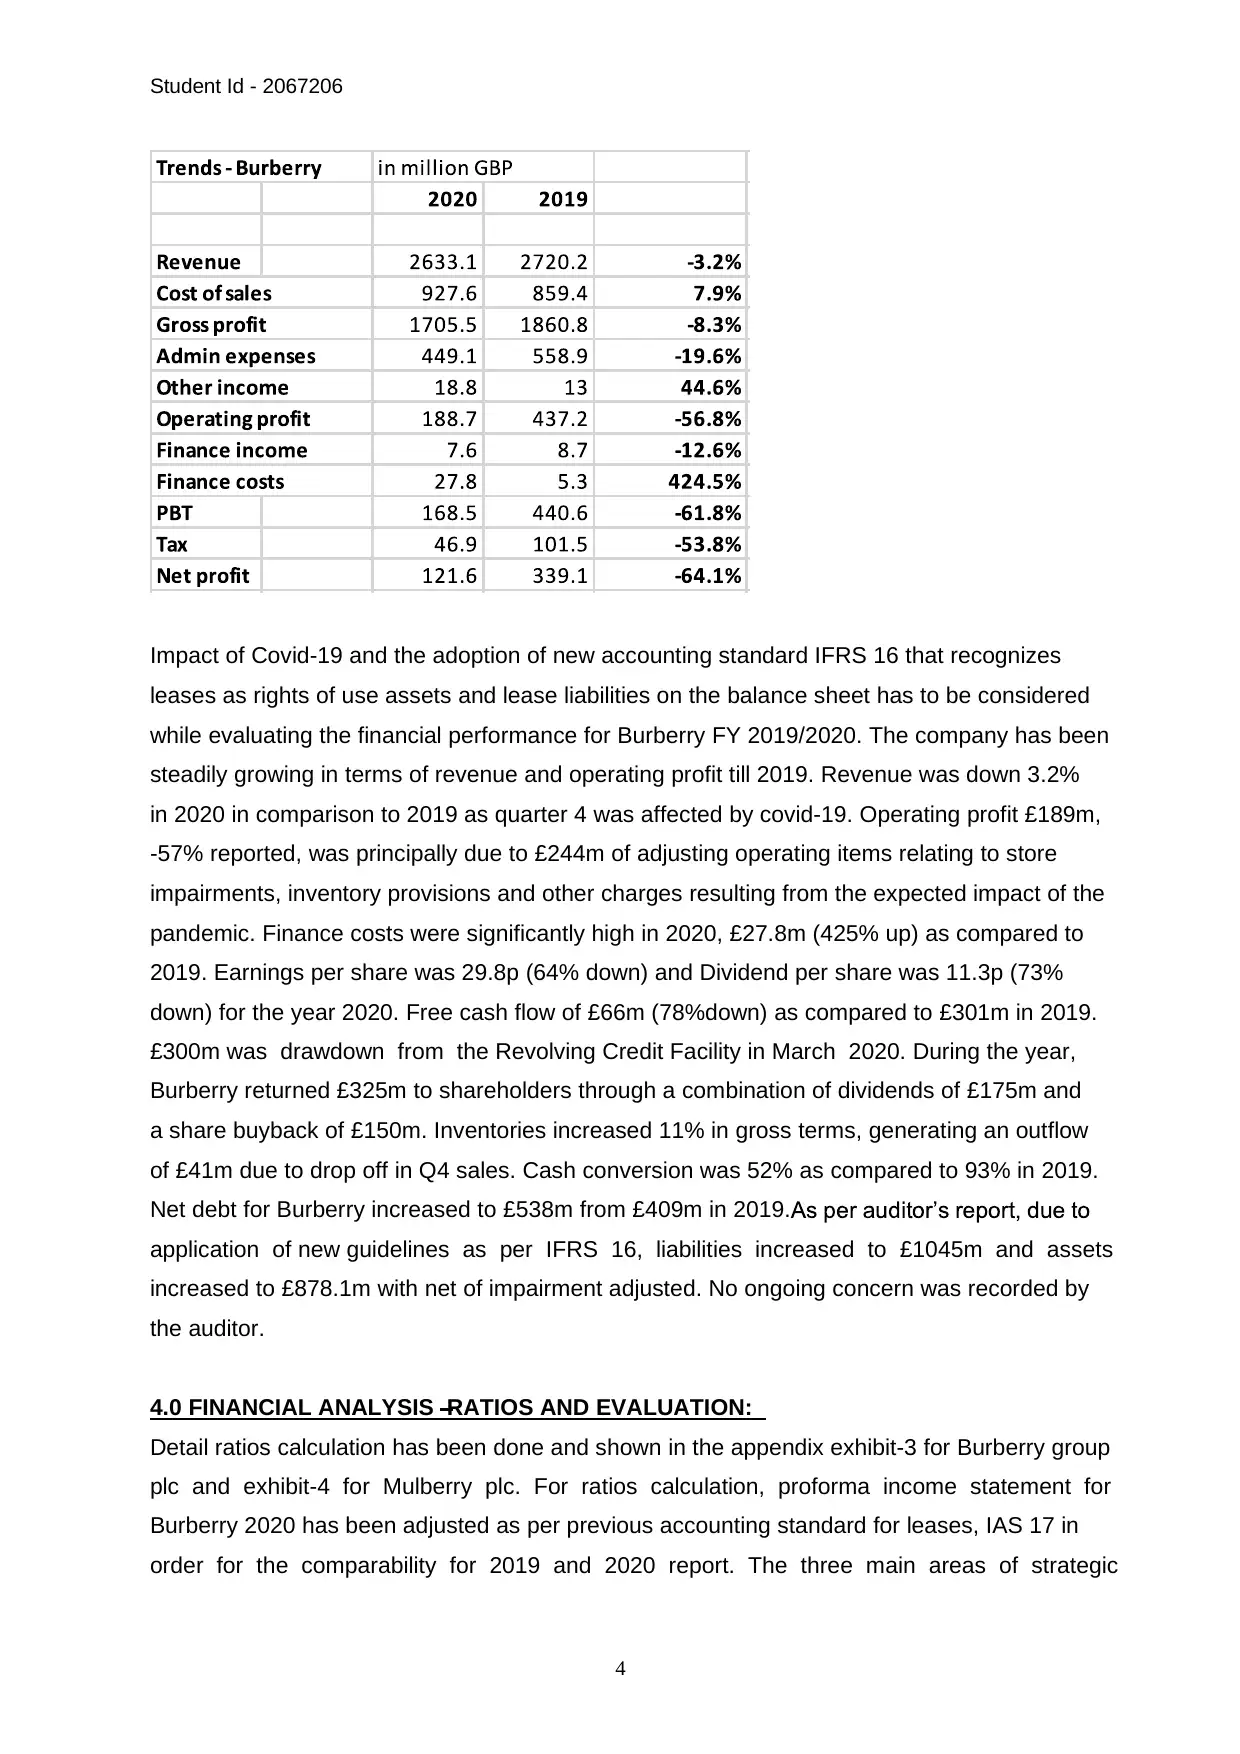
Impact of Covid-19 and the adoption of new accounting standard IFRS 16 that recognizes
leases as rights of use assets and lease liabilities on the balance sheet has to be considered
while evaluating the financial performance for Burberry FY 2019/2020. The company has been
steadily growing in terms of revenue and operating profit till 2019. Revenue was down 3.2%
in 2020 in comparison to 2019 as quarter 4 was affected by covid-19. Operating profit £189m,
-57% reported, was principally due to £244m of adjusting operating items relating to store
impairments, inventory provisions and other charges resulting from the expected impact of the
pandemic. Finance costs were significantly high in 2020, £27.8m (425% up) as compared to
2019. Earnings per share was 29.8p (64% down) and Dividend per share was 11.3p (73%
down) for the year 2020. Free cash flow of £66m (78%down) as compared to £301m in 2019.
£300m was drawdown from the Revolving Credit Facility in March 2020. During the year,
Burberry returned £325m to shareholders through a combination of dividends of £175m and
a share buyback of £150m. Inventories increased 11% in gross terms, generating an outflow
of £41m due to drop off in Q4 sales. Cash conversion was 52% as compared to 93% in 2019.
Net debt for Burberry increased to £538m from £409m in 2019.
application of new guidelines as per IFRS 16, liabilities increased to £1045m and assets
increased to £878.1m with net of impairment adjusted. No ongoing concern was recorded by
the auditor.
4.0 FINANCIAL ANALYSIS RATIOS AND EVALUATION:
Detail ratios calculation has been done and shown in the appendix exhibit-3 for Burberry group
plc and exhibit-4 for Mulberry plc. For ratios calculation, proforma income statement for
Burberry 2020 has been adjusted as per previous accounting standard for leases, IAS 17 in
order for the comparability for 2019 and 2020 report. The three main areas of strategic
4
Impact of Covid-19 and the adoption of new accounting standard IFRS 16 that recognizes
leases as rights of use assets and lease liabilities on the balance sheet has to be considered
while evaluating the financial performance for Burberry FY 2019/2020. The company has been
steadily growing in terms of revenue and operating profit till 2019. Revenue was down 3.2%
in 2020 in comparison to 2019 as quarter 4 was affected by covid-19. Operating profit £189m,
-57% reported, was principally due to £244m of adjusting operating items relating to store
impairments, inventory provisions and other charges resulting from the expected impact of the
pandemic. Finance costs were significantly high in 2020, £27.8m (425% up) as compared to
2019. Earnings per share was 29.8p (64% down) and Dividend per share was 11.3p (73%
down) for the year 2020. Free cash flow of £66m (78%down) as compared to £301m in 2019.
£300m was drawdown from the Revolving Credit Facility in March 2020. During the year,
Burberry returned £325m to shareholders through a combination of dividends of £175m and
a share buyback of £150m. Inventories increased 11% in gross terms, generating an outflow
of £41m due to drop off in Q4 sales. Cash conversion was 52% as compared to 93% in 2019.
Net debt for Burberry increased to £538m from £409m in 2019.
application of new guidelines as per IFRS 16, liabilities increased to £1045m and assets
increased to £878.1m with net of impairment adjusted. No ongoing concern was recorded by
the auditor.
4.0 FINANCIAL ANALYSIS RATIOS AND EVALUATION:
Detail ratios calculation has been done and shown in the appendix exhibit-3 for Burberry group
plc and exhibit-4 for Mulberry plc. For ratios calculation, proforma income statement for
Burberry 2020 has been adjusted as per previous accounting standard for leases, IAS 17 in
order for the comparability for 2019 and 2020 report. The three main areas of strategic
⊘ This is a preview!⊘
Do you want full access?
Subscribe today to unlock all pages.
Trusted by 1+ million students worldwide
Student Id - 2067206
5
importance for Burberry group plc were identified in internal profile analysis. Consequently, I
will discuss and evaluate ratios that relate directly to these three areas.
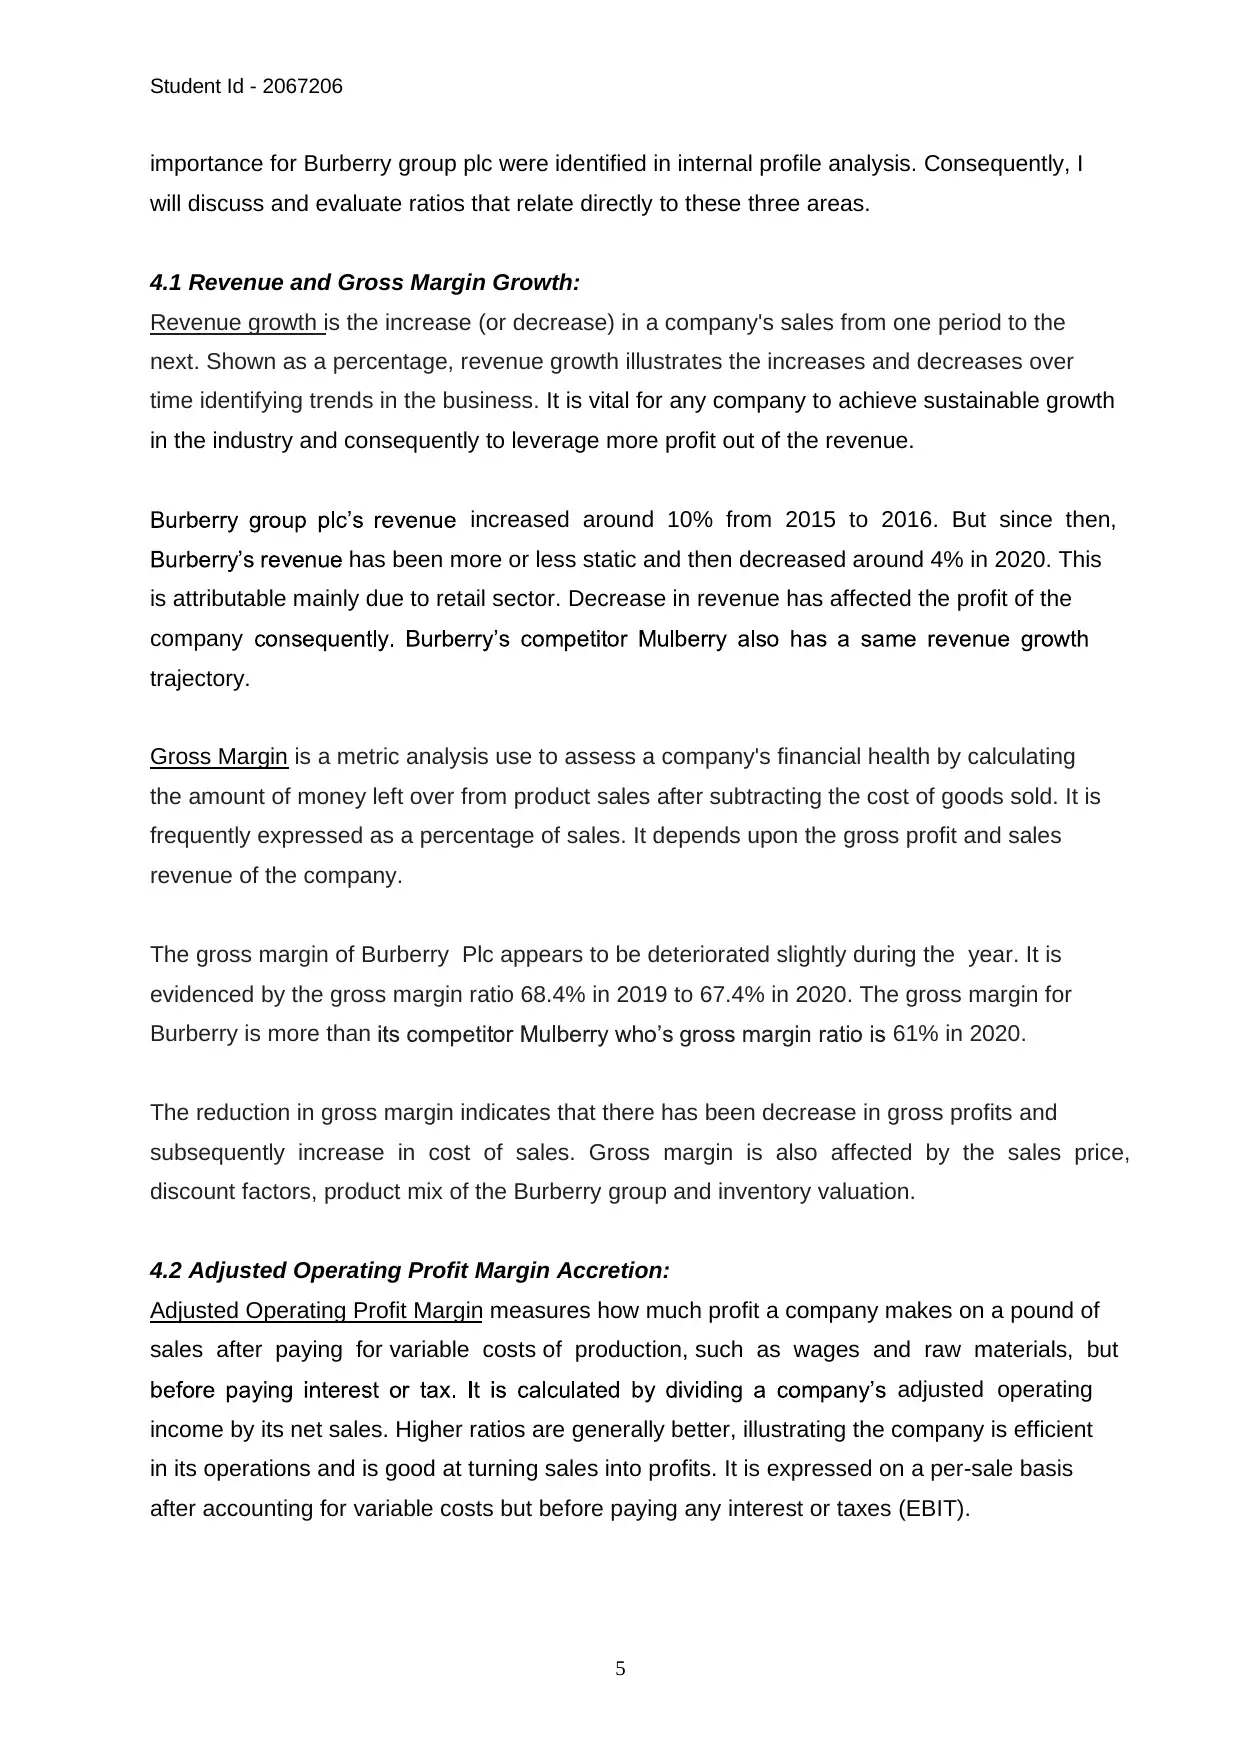
4.1 Revenue and Gross Margin Growth:
Revenue growth is the increase (or decrease) in a company's sales from one period to the
next. Shown as a percentage, revenue growth illustrates the increases and decreases over
time identifying trends in the business. It is vital for any company to achieve sustainable growth
in the industry and consequently to leverage more profit out of the revenue.
increased around 10% from 2015 to 2016. But since then,
has been more or less static and then decreased around 4% in 2020. This
is attributable mainly due to retail sector. Decrease in revenue has affected the profit of the
company
trajectory.
Gross Margin is a metric analysis use to assess a company's financial health by calculating
the amount of money left over from product sales after subtracting the cost of goods sold. It is
frequently expressed as a percentage of sales. It depends upon the gross profit and sales
revenue of the company.
The gross margin of Burberry Plc appears to be deteriorated slightly during the year. It is
evidenced by the gross margin ratio 68.4% in 2019 to 67.4% in 2020. The gross margin for
Burberry is more than 61% in 2020.
The reduction in gross margin indicates that there has been decrease in gross profits and
subsequently increase in cost of sales. Gross margin is also affected by the sales price,
discount factors, product mix of the Burberry group and inventory valuation.
4.2 Adjusted Operating Profit Margin Accretion:
Adjusted Operating Profit Margin measures how much profit a company makes on a pound of
sales after paying for variable costs of production, such as wages and raw materials, but
adjusted operating
income by its net sales. Higher ratios are generally better, illustrating the company is efficient
in its operations and is good at turning sales into profits. It is expressed on a per-sale basis
after accounting for variable costs but before paying any interest or taxes (EBIT).
5
importance for Burberry group plc were identified in internal profile analysis. Consequently, I
will discuss and evaluate ratios that relate directly to these three areas.
4.1 Revenue and Gross Margin Growth:
Revenue growth is the increase (or decrease) in a company's sales from one period to the
next. Shown as a percentage, revenue growth illustrates the increases and decreases over
time identifying trends in the business. It is vital for any company to achieve sustainable growth
in the industry and consequently to leverage more profit out of the revenue.
increased around 10% from 2015 to 2016. But since then,
has been more or less static and then decreased around 4% in 2020. This
is attributable mainly due to retail sector. Decrease in revenue has affected the profit of the
company
trajectory.
Gross Margin is a metric analysis use to assess a company's financial health by calculating
the amount of money left over from product sales after subtracting the cost of goods sold. It is
frequently expressed as a percentage of sales. It depends upon the gross profit and sales
revenue of the company.
The gross margin of Burberry Plc appears to be deteriorated slightly during the year. It is
evidenced by the gross margin ratio 68.4% in 2019 to 67.4% in 2020. The gross margin for
Burberry is more than 61% in 2020.
The reduction in gross margin indicates that there has been decrease in gross profits and
subsequently increase in cost of sales. Gross margin is also affected by the sales price,
discount factors, product mix of the Burberry group and inventory valuation.
4.2 Adjusted Operating Profit Margin Accretion:
Adjusted Operating Profit Margin measures how much profit a company makes on a pound of
sales after paying for variable costs of production, such as wages and raw materials, but
adjusted operating
income by its net sales. Higher ratios are generally better, illustrating the company is efficient
in its operations and is good at turning sales into profits. It is expressed on a per-sale basis
after accounting for variable costs but before paying any interest or taxes (EBIT).
Paraphrase This Document
Need a fresh take? Get an instant paraphrase of this document with our AI Paraphraser
Student Id - 2067206
6
The board strategies to increase the adjusted profit margin gradually. However, it has
deteriorated since last year from 16.1% to 15.3% (5-year summary Exhibit 8). In order to
analyse better we will look at the net operating margin ratio.
Net operating margin for Burberry has reduced from 16.1% in 2019 to 6.1% in 2020. It
indicates that operating expenses has increased significantly which drive down the operating
profit and hence net operating margin. In comparison to its competitor Mulberry who reported
net operating margin of -28.8% in 2020, Burberry did well in this crisis time.
The reason for increased operating expenses can be due to impairment of retail cash
generating units, inventory, intangible assets, receivables and other effects of covid-19 as
described in the note 6 to the financial statements. Restructuring costs of £10.6 million were
also added to the operating expenses
cost- efficiency programme announced in May 2016.
4.3 Capital Efficiency:
evaluate here ROCE ratio and Operating Cycle.
Return on capital employed (ROCE) is a financial ratio that can be used in assessing a
company's profitability and capital efficiency. This ratio can help to understand how well a
company is generating profits from its capital as it has put to use.
ROCE has significantly reduced during the current year from 25.8% in 2019 to 6.2% in 2020.
It indicates that either operating profit has decreased or employed capital has been increased
-46.3%.
discussed above and its
lease liabilities has also increased due to IFRS16 regulatory changes. Burberry has also
borrowed £300m in 2020. These effects in increase liabilities, consequently in the capital
during the current year.
Operating cycle is the average period of time required for a business to make an initial
outlay of cash to produce goods, sell the goods, and receive cash from customers in
exchange for the goods. This is useful for estimating the amount of working capital that a
company will need in order to maintain or grow its business.
Student Id - 2067206
7
the current year from 9 days in 2019 to 36
days in 2020 which is a contrast to its competitor mulberry who has reduced its operating
cycle by 18 days in current year.
This indicates that Burberry will require more working capital to manage short term cash.
The reason for increase in operating cycle can be due to increase in inventories and
delays in receivables due to covid -19 pandemic. Trade payable days has been decreased
from 223 in 2019 to 190 in 2020 which indicates lose command on suppliers.
5.0 CONCLUSION:
Introduction of IFRS16 regulations and Covid-19 has impacted a lot on the financial analysis
of Burberry Group Plc. Revenue growth, gross profit margin and operating profit margin has
decreased, and short term and long-term liabilities has increased. However, Burberry group
has sustained the Covid-19 crisis in a fair manner and the decrease in ratios are similar to
industry standards. The most significant impact to the financial statement has been in respect
of retail assets impairment and inventory provisioning. In order to focus on the strategic pillars
of the company, Burberry has decided to invest in digital platform, omnichannel services and
sustainable and responsible products that aligns with the strategy of the group. Auditors have
reported a true and fair view of the financial statement given by the Burberry Group Plc. In my
view, Burberry has a strong financial position and decent financial performance over last year
considering covid-19 situation when compared with other luxury brands in the same sector
e.g.: Mulberry. Burberry will require to renegotiate contracts with its suppliers in order to
increase payable days and improve efficiency in operating cycle.
⊘ This is a preview!⊘
Do you want full access?
Subscribe today to unlock all pages.
Trusted by 1+ million students worldwide
Student Id - 2067206
8
SECTION B
FINANCIAL MANAGEMENT - RISK AND RETURN ON EQUITY OF BURBERRY &
MULBERRY:
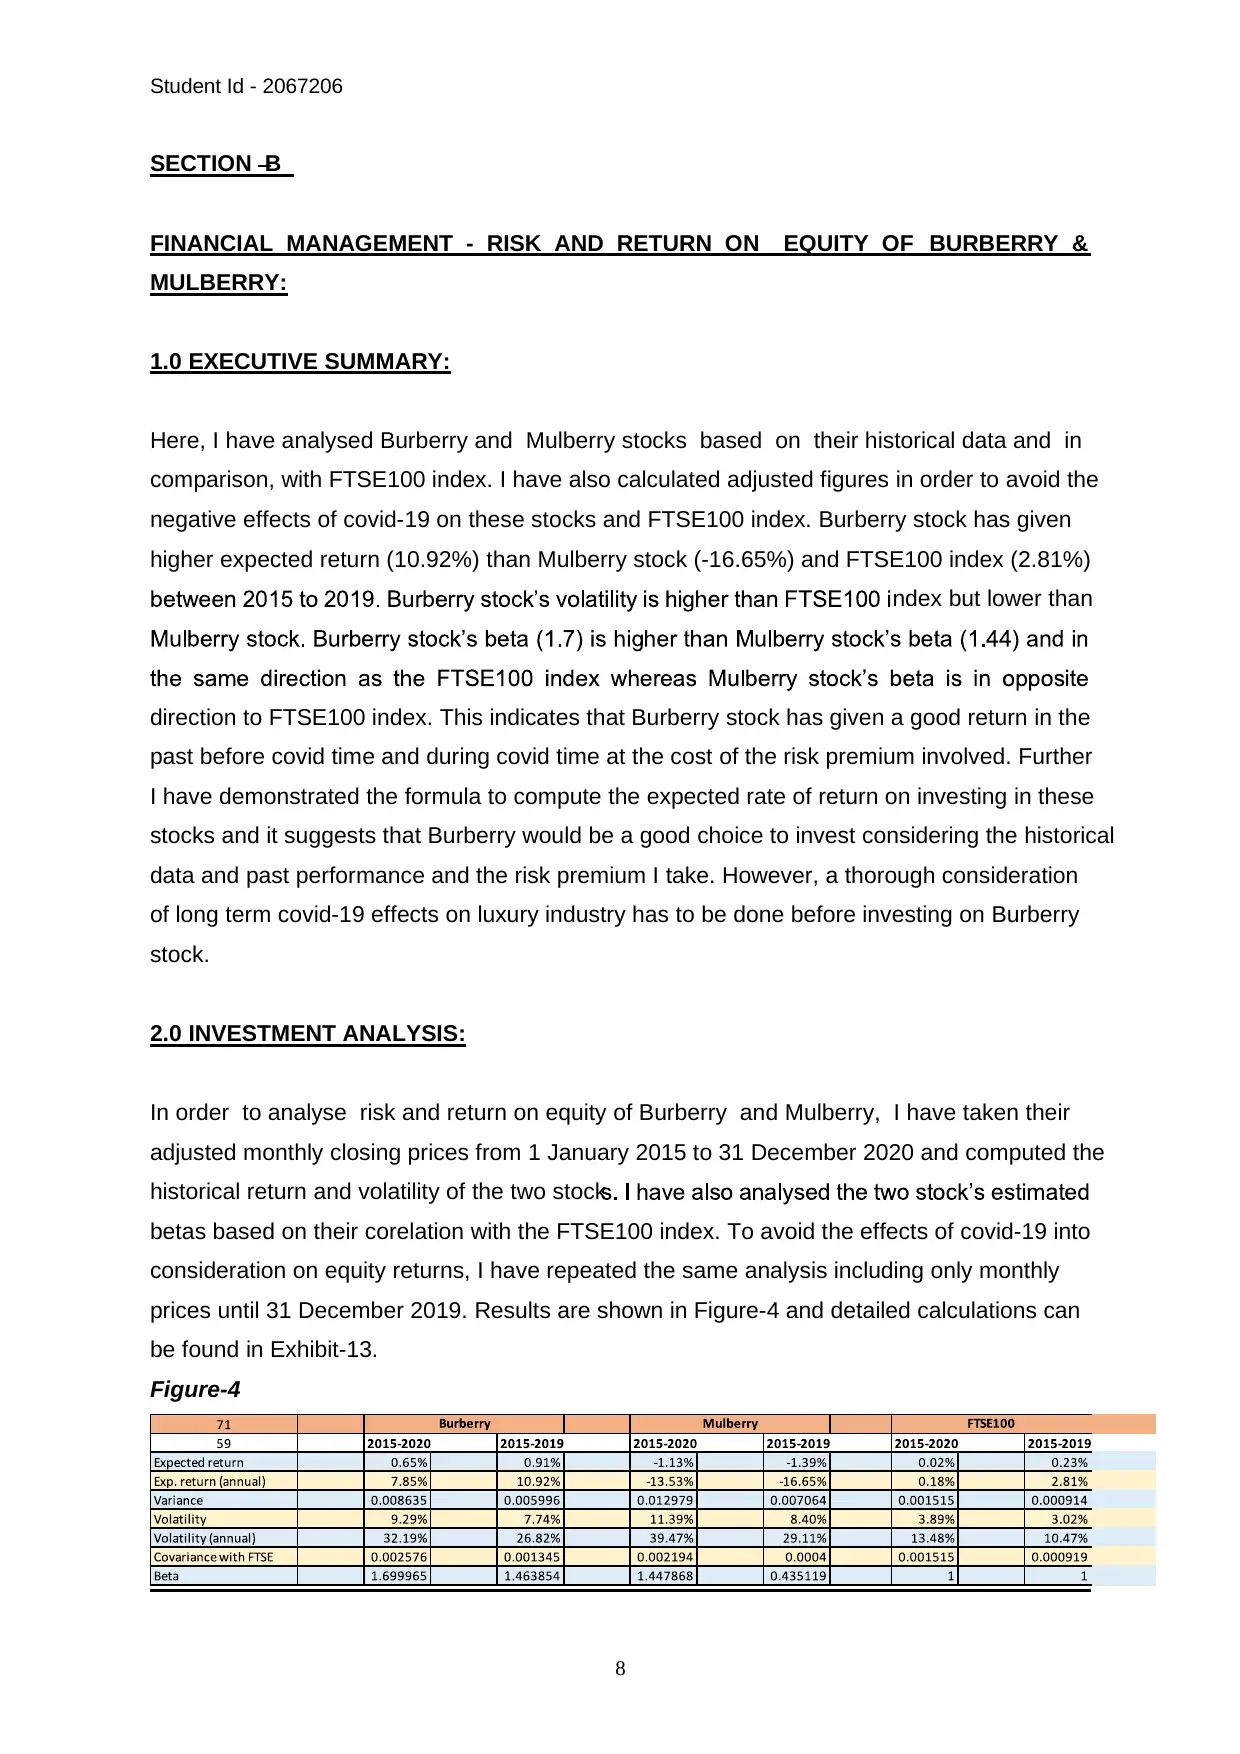
1.0 EXECUTIVE SUMMARY:
Here, I have analysed Burberry and Mulberry stocks based on their historical data and in
comparison, with FTSE100 index. I have also calculated adjusted figures in order to avoid the
negative effects of covid-19 on these stocks and FTSE100 index. Burberry stock has given
higher expected return (10.92%) than Mulberry stock (-16.65%) and FTSE100 index (2.81%)
ndex but lower than
direction to FTSE100 index. This indicates that Burberry stock has given a good return in the
past before covid time and during covid time at the cost of the risk premium involved. Further
I have demonstrated the formula to compute the expected rate of return on investing in these
stocks and it suggests that Burberry would be a good choice to invest considering the historical
data and past performance and the risk premium I take. However, a thorough consideration
of long term covid-19 effects on luxury industry has to be done before investing on Burberry
stock.
2.0 INVESTMENT ANALYSIS:
In order to analyse risk and return on equity of Burberry and Mulberry, I have taken their
adjusted monthly closing prices from 1 January 2015 to 31 December 2020 and computed the
historical return and volatility of the two stock
betas based on their corelation with the FTSE100 index. To avoid the effects of covid-19 into
consideration on equity returns, I have repeated the same analysis including only monthly
prices until 31 December 2019. Results are shown in Figure-4 and detailed calculations can
be found in Exhibit-13.
Figure-4
8
SECTION B
FINANCIAL MANAGEMENT - RISK AND RETURN ON EQUITY OF BURBERRY &
MULBERRY:
1.0 EXECUTIVE SUMMARY:
Here, I have analysed Burberry and Mulberry stocks based on their historical data and in
comparison, with FTSE100 index. I have also calculated adjusted figures in order to avoid the
negative effects of covid-19 on these stocks and FTSE100 index. Burberry stock has given
higher expected return (10.92%) than Mulberry stock (-16.65%) and FTSE100 index (2.81%)
ndex but lower than
direction to FTSE100 index. This indicates that Burberry stock has given a good return in the
past before covid time and during covid time at the cost of the risk premium involved. Further
I have demonstrated the formula to compute the expected rate of return on investing in these
stocks and it suggests that Burberry would be a good choice to invest considering the historical
data and past performance and the risk premium I take. However, a thorough consideration
of long term covid-19 effects on luxury industry has to be done before investing on Burberry
stock.
2.0 INVESTMENT ANALYSIS:
In order to analyse risk and return on equity of Burberry and Mulberry, I have taken their
adjusted monthly closing prices from 1 January 2015 to 31 December 2020 and computed the
historical return and volatility of the two stock
betas based on their corelation with the FTSE100 index. To avoid the effects of covid-19 into
consideration on equity returns, I have repeated the same analysis including only monthly
prices until 31 December 2019. Results are shown in Figure-4 and detailed calculations can
be found in Exhibit-13.
Figure-4
Paraphrase This Document
Need a fresh take? Get an instant paraphrase of this document with our AI Paraphraser
Student Id - 2067206
9
Analysing the historical data, annual expected return for Burberry stock is 7.85% whereas for
Mulberry stock, it is -13.53%. FTSE has given a return of 0.18% during the same time. Volatility
for the same per (13.48%)
and this risk premium has been compensated by high expected returns on Burberry stock as
compared to FTSE100. Covid-19 has more or less negative impacts on all the industries and
luxury fashion industry was one of the one who was hit very badly. To offset this one-off event
for analysis, calculated expected returns till 2019 for Burberry, Mulberry and FTSE are
10.92%, -16.65% and 2.81% respectively. Obviously, volatility has reduced across both stocks
and FTSE100 index while excluding covid time prices. Analysing the pre covid data, Burberry
has performed well over Mulberry and FTSE100 index, giving 10.92% returns with a volatility
risk of 26.82%. It indicates that Burberry has outperformed Mulberry and FTSE100 index pre-
covid time and during covid time till December 2020 although luxury fashion industry is in a
bad shape during covid time.
The beta for Burberry stock is 1.7 between 2015-2019 and for Mulberry stock is 1.44 for the
same period. However, Burberry has given positive returns and Mulberry has given negative
returns on equity within that time. It suggests that Burberry stock has moved 1.7 times than
the FTSE100 index and in the same direction as FTSE100 index. While Mulberry stock has
moved 1.44 times than the FTSE100 index but in opposite direction and hence has given
negative expected returns on equity.
To comment further for future performance on these two stocks, historical data is quite helpful
for analysing and future predictions. It tells us how both stocks have performed over the last
six years individually, together and in comparison, with FTSE100 index. It also tells us how
much market risk premium both stocks have and have they been able to generate returns for
that risk premium for investors. I would prefer investing on Burberry stock over Mulberry as it
has given good returns for the price of risk premium over the past period. However, I should
also consider the long-term impacts of covid-19 on luxury fashion industry and Burberry as
specific company before investing on Burberry stock.
In order to compute the rate of return that I require for investing in these two stocks, I will use
the following CAPM formula,
E(RY)=Rf Y ·(E(RM f)
Student Id - 2067206
10
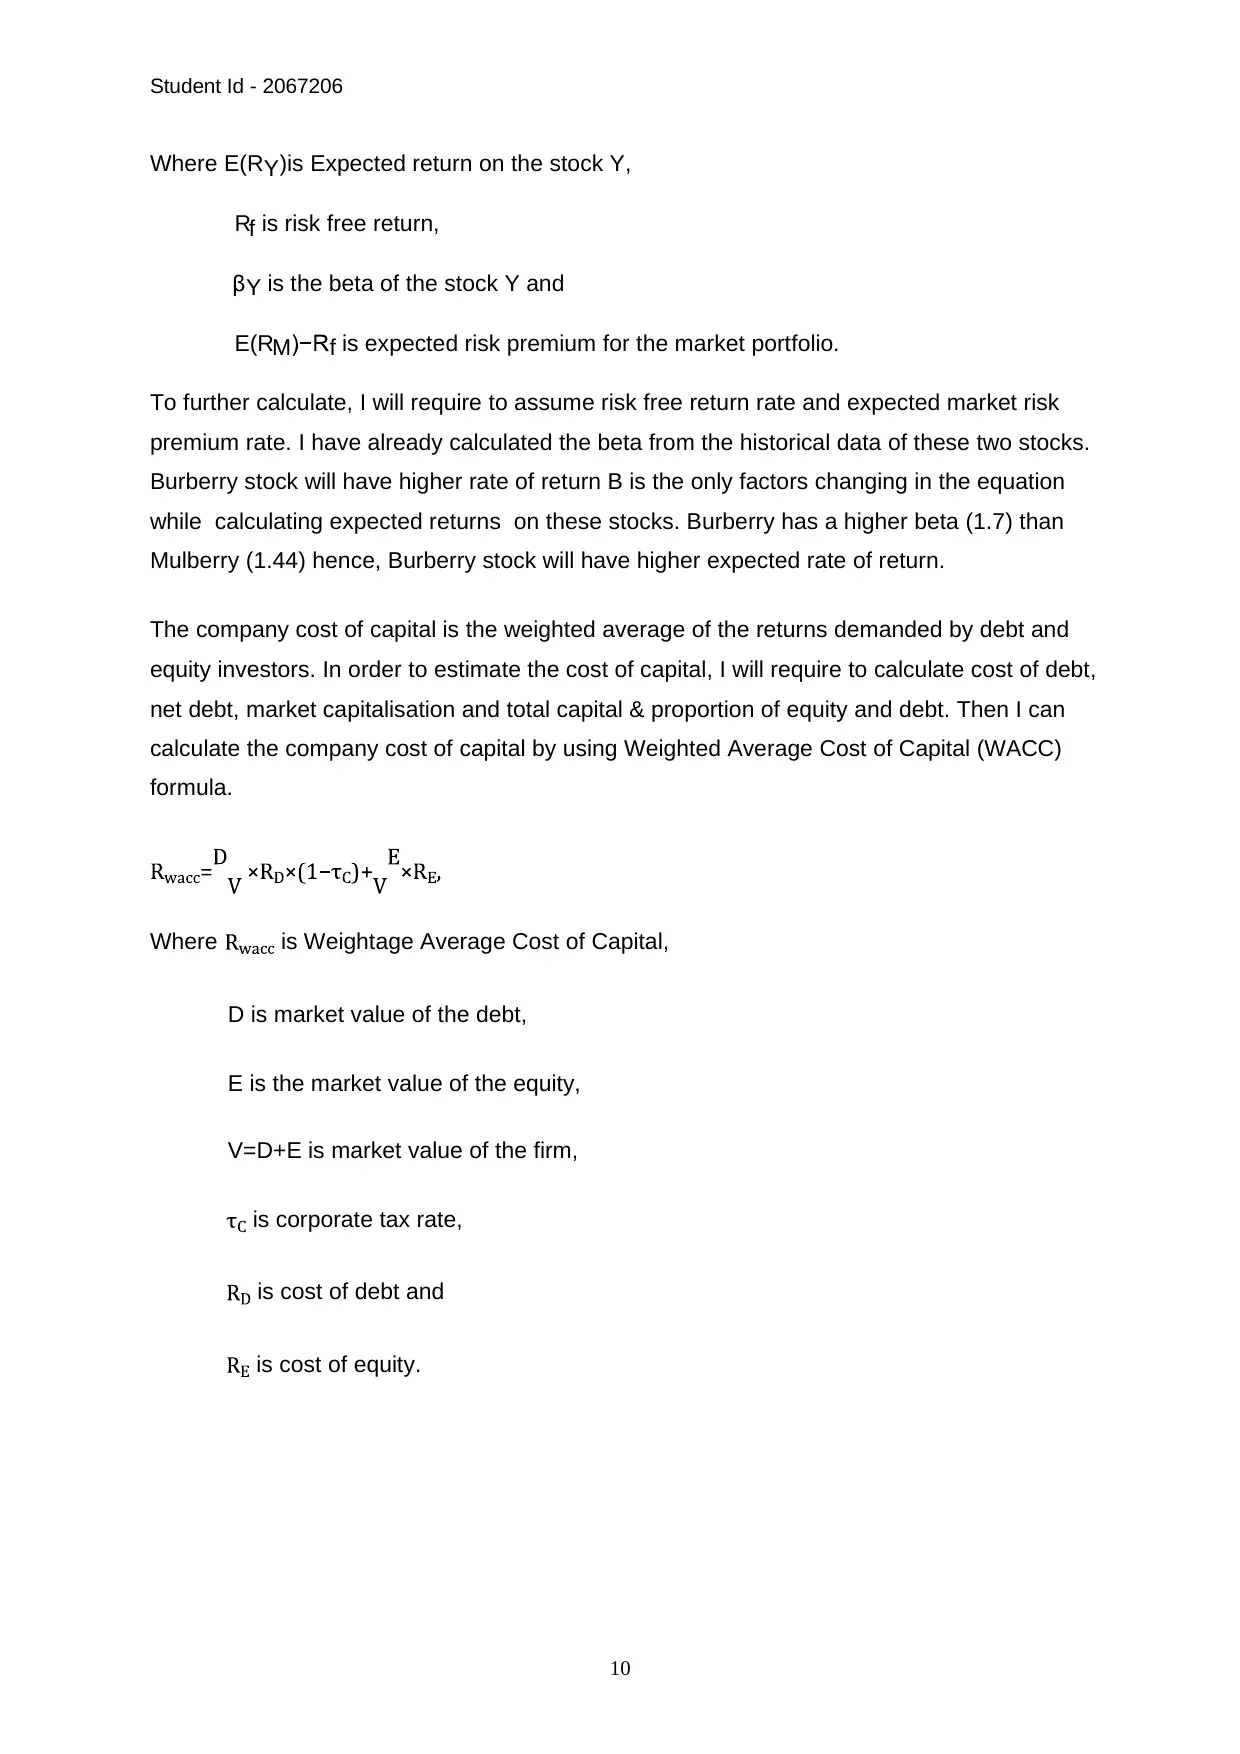
Where E(RY)is Expected return on the stock Y,
Rf is risk free return,
Y is the beta of the stock Y and
E(RM f is expected risk premium for the market portfolio.
To further calculate, I will require to assume risk free return rate and expected market risk
premium rate. I have already calculated the beta from the historical data of these two stocks.
Burberry stock will have higher rate of return B is the only factors changing in the equation
while calculating expected returns on these stocks. Burberry has a higher beta (1.7) than
Mulberry (1.44) hence, Burberry stock will have higher expected rate of return.
The company cost of capital is the weighted average of the returns demanded by debt and
equity investors. In order to estimate the cost of capital, I will require to calculate cost of debt,
net debt, market capitalisation and total capital & proportion of equity and debt. Then I can
calculate the company cost of capital by using Weighted Average Cost of Capital (WACC)
formula.
Where is Weightage Average Cost of Capital,
D is market value of the debt,
E is the market value of the equity,
V=D+E is market value of the firm,
is corporate tax rate,
is cost of debt and
is cost of equity.
10
Where E(RY)is Expected return on the stock Y,
Rf is risk free return,
Y is the beta of the stock Y and
E(RM f is expected risk premium for the market portfolio.
To further calculate, I will require to assume risk free return rate and expected market risk
premium rate. I have already calculated the beta from the historical data of these two stocks.
Burberry stock will have higher rate of return B is the only factors changing in the equation
while calculating expected returns on these stocks. Burberry has a higher beta (1.7) than
Mulberry (1.44) hence, Burberry stock will have higher expected rate of return.
The company cost of capital is the weighted average of the returns demanded by debt and
equity investors. In order to estimate the cost of capital, I will require to calculate cost of debt,
net debt, market capitalisation and total capital & proportion of equity and debt. Then I can
calculate the company cost of capital by using Weighted Average Cost of Capital (WACC)
formula.
Where is Weightage Average Cost of Capital,
D is market value of the debt,
E is the market value of the equity,
V=D+E is market value of the firm,
is corporate tax rate,
is cost of debt and
is cost of equity.
⊘ This is a preview!⊘
Do you want full access?
Subscribe today to unlock all pages.
Trusted by 1+ million students worldwide
Student Id - 2067206
11
3.0 CONCLUSION:
In summary, Burberry stock has low volatility and higher expected returns than Mulberry stock.
Burberry stock has performed well before covid period and during the covid period as
and returns are rewarded to the investor for the risk premium they have taken.
After carefully analysing the two stocks historical data, their expected returns, volatility and
betas in comparison to FTSE100 index, I would like to invest in the Burberry stock as the
further expected return on investment is high than Mulberry stock and FTSE100 index
considering the risk premium I take. However, a thorough consideration of long term covid-19
effects on luxury industry has to be done before investing on Burberry stock.
Paraphrase This Document
Need a fresh take? Get an instant paraphrase of this document with our AI Paraphraser
Student Id - 2067206
12
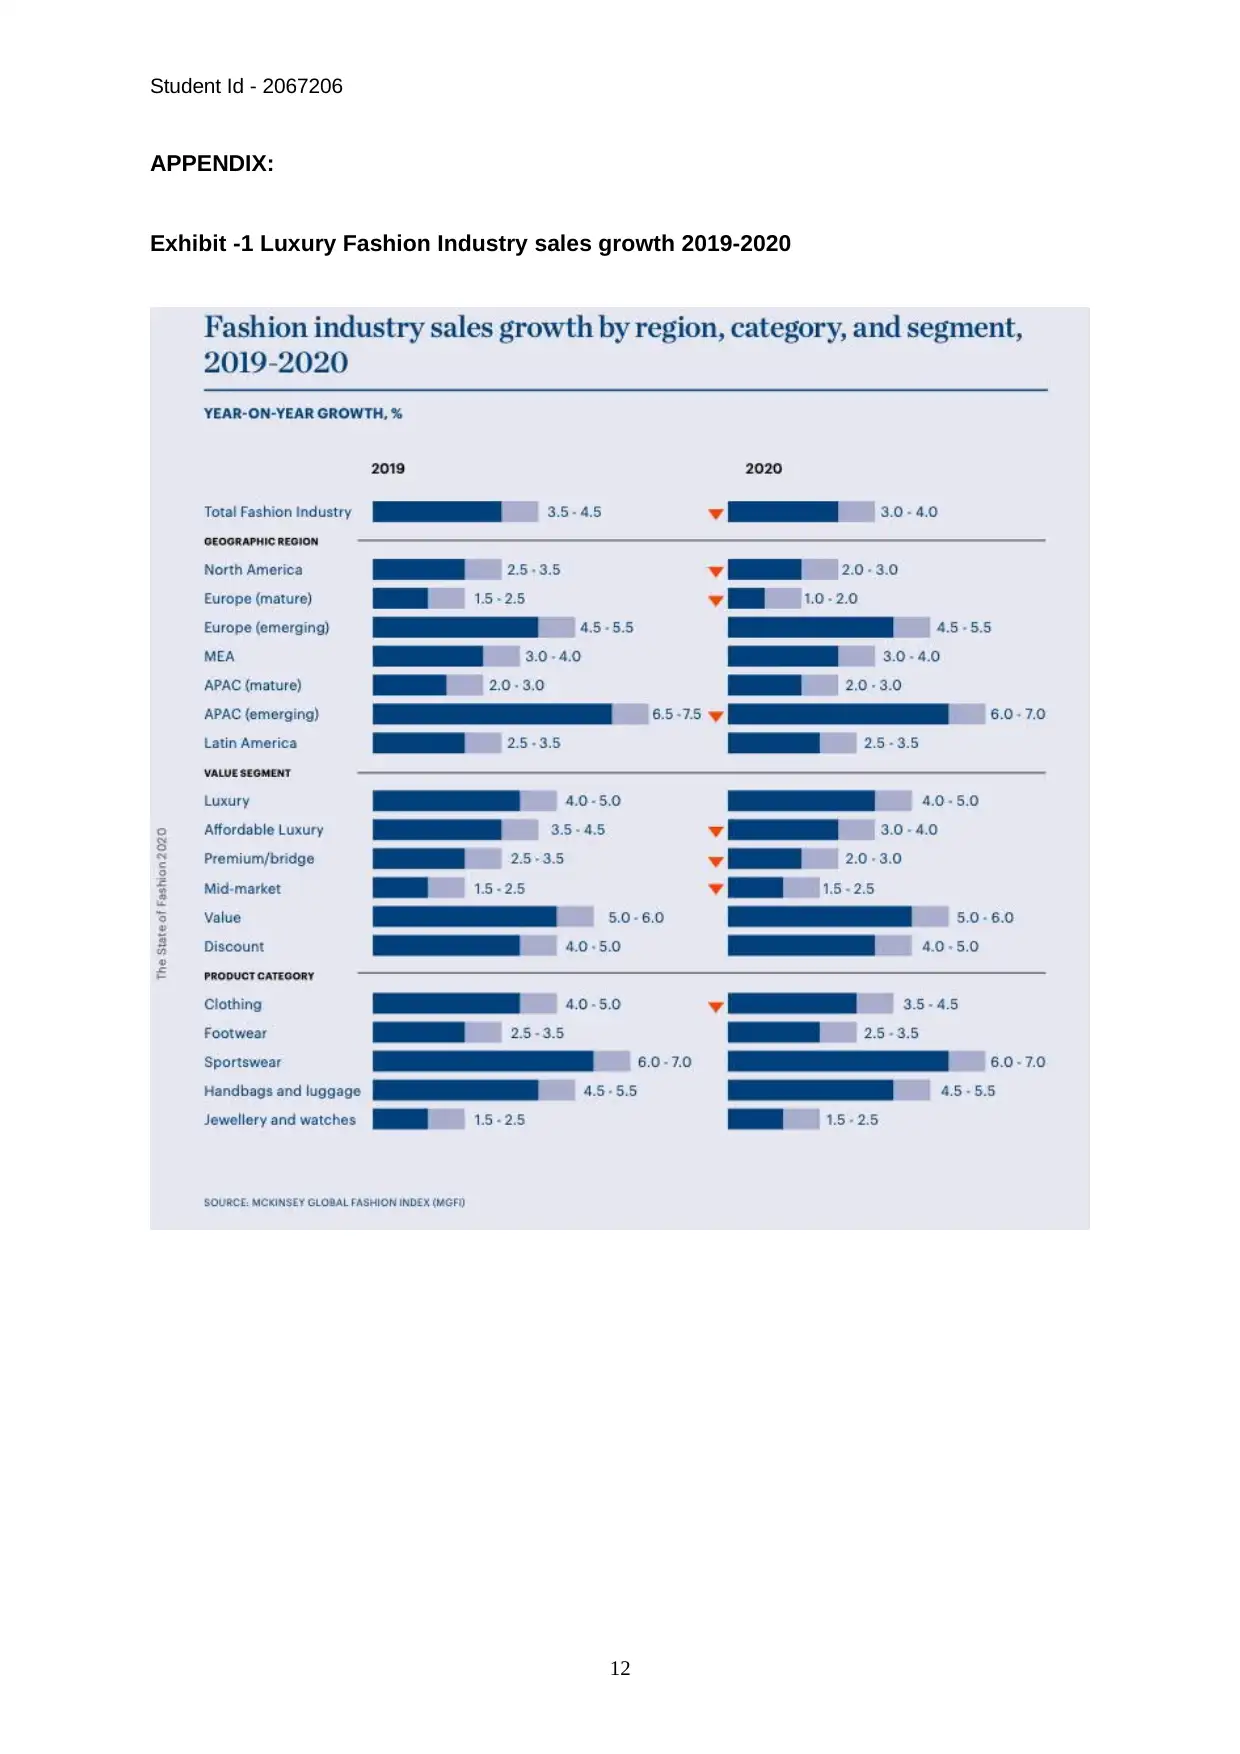
APPENDIX:
Exhibit -1 Luxury Fashion Industry sales growth 2019-2020
12
APPENDIX:
Exhibit -1 Luxury Fashion Industry sales growth 2019-2020
Student Id - 2067206
13
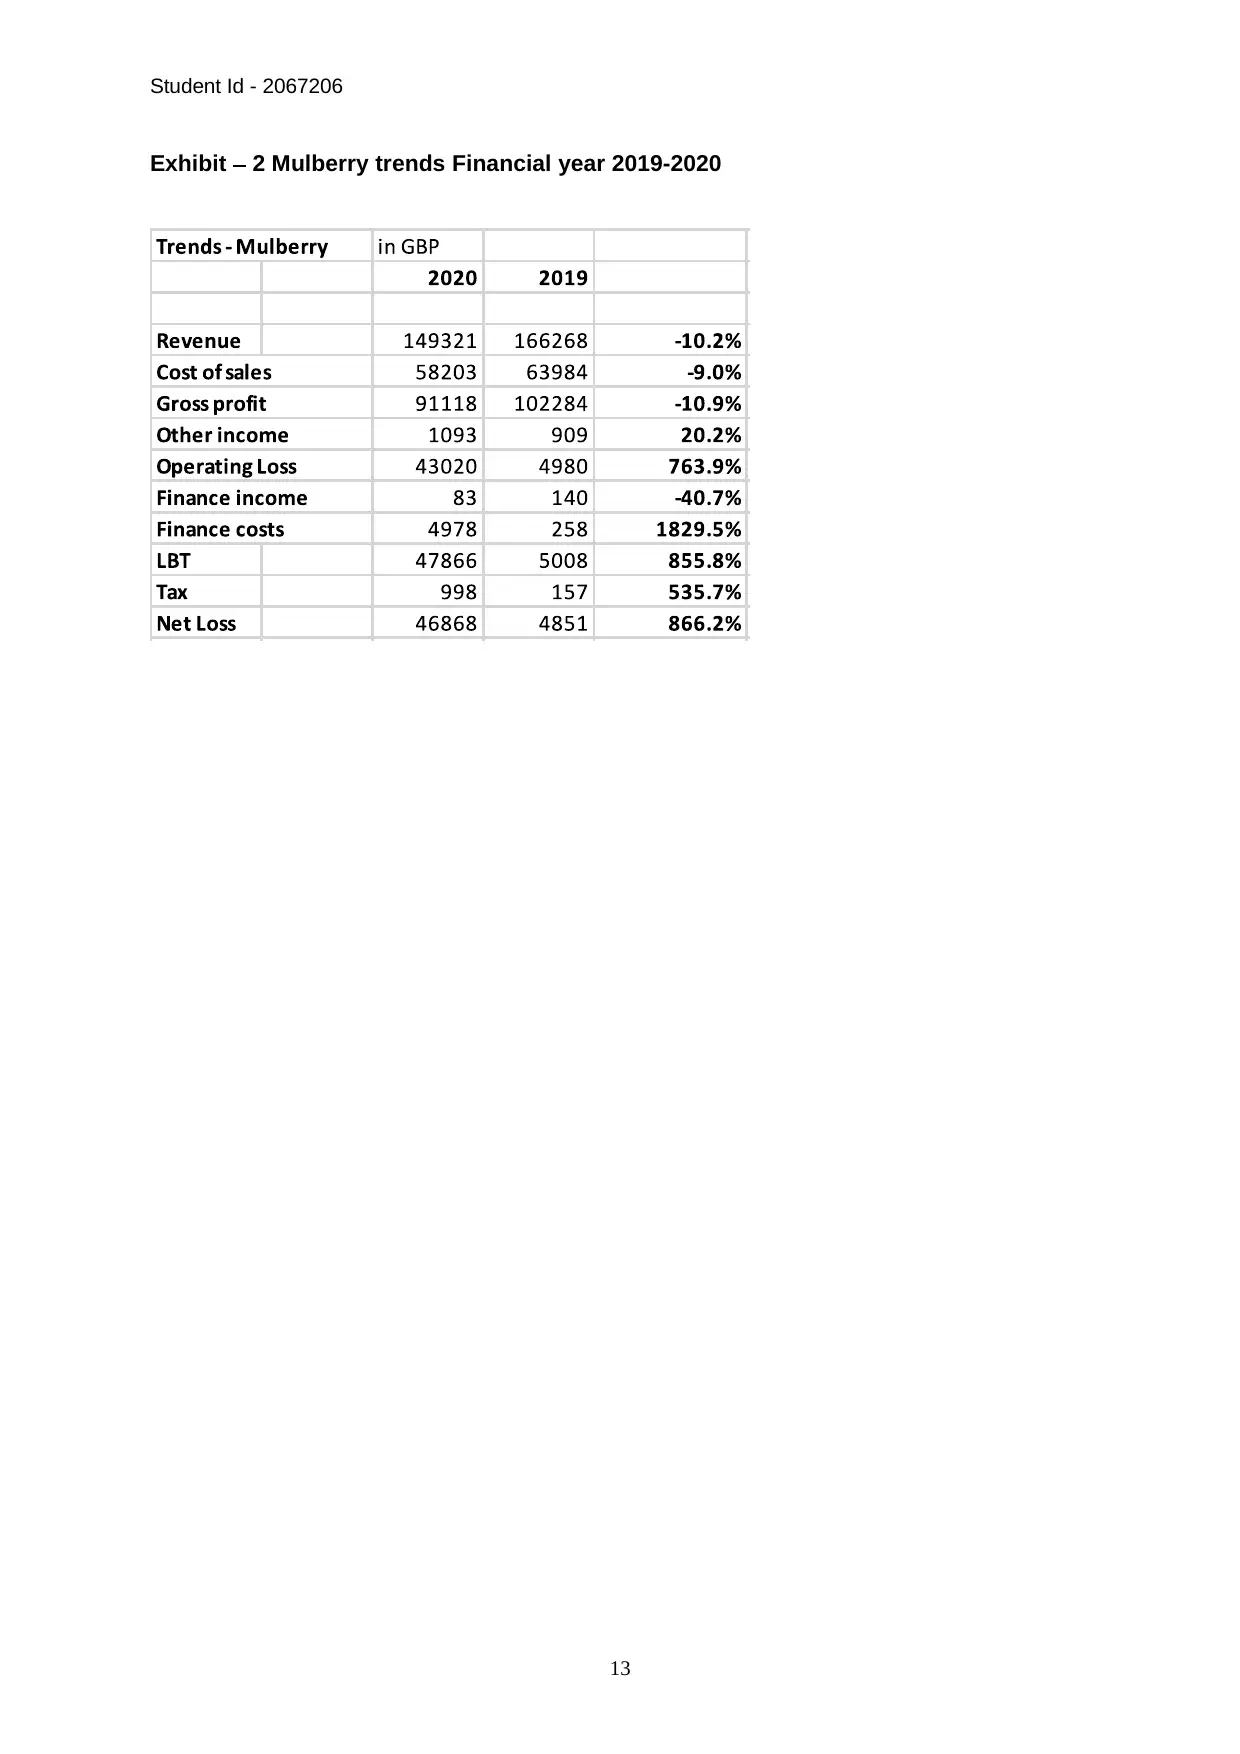
Exhibit 2 Mulberry trends Financial year 2019-2020
13
Exhibit 2 Mulberry trends Financial year 2019-2020
⊘ This is a preview!⊘
Do you want full access?
Subscribe today to unlock all pages.
Trusted by 1+ million students worldwide
1 out of 23
Related Documents


Your All-in-One AI-Powered Toolkit for Academic Success.
+13062052269
info@desklib.com
Available 24*7 on WhatsApp / Email
![[object Object]](/_next/static/media/star-bottom.7253800d.svg)
Unlock your academic potential
Copyright © 2020–2026 A2Z Services. All Rights Reserved. Developed and managed by ZUCOL.