Economics Assignment - Microeconomic Analysis of Bus Trip Market

Verified

Added on  2022/10/04

|9
|549
|229
Homework Assignment
AI Summary
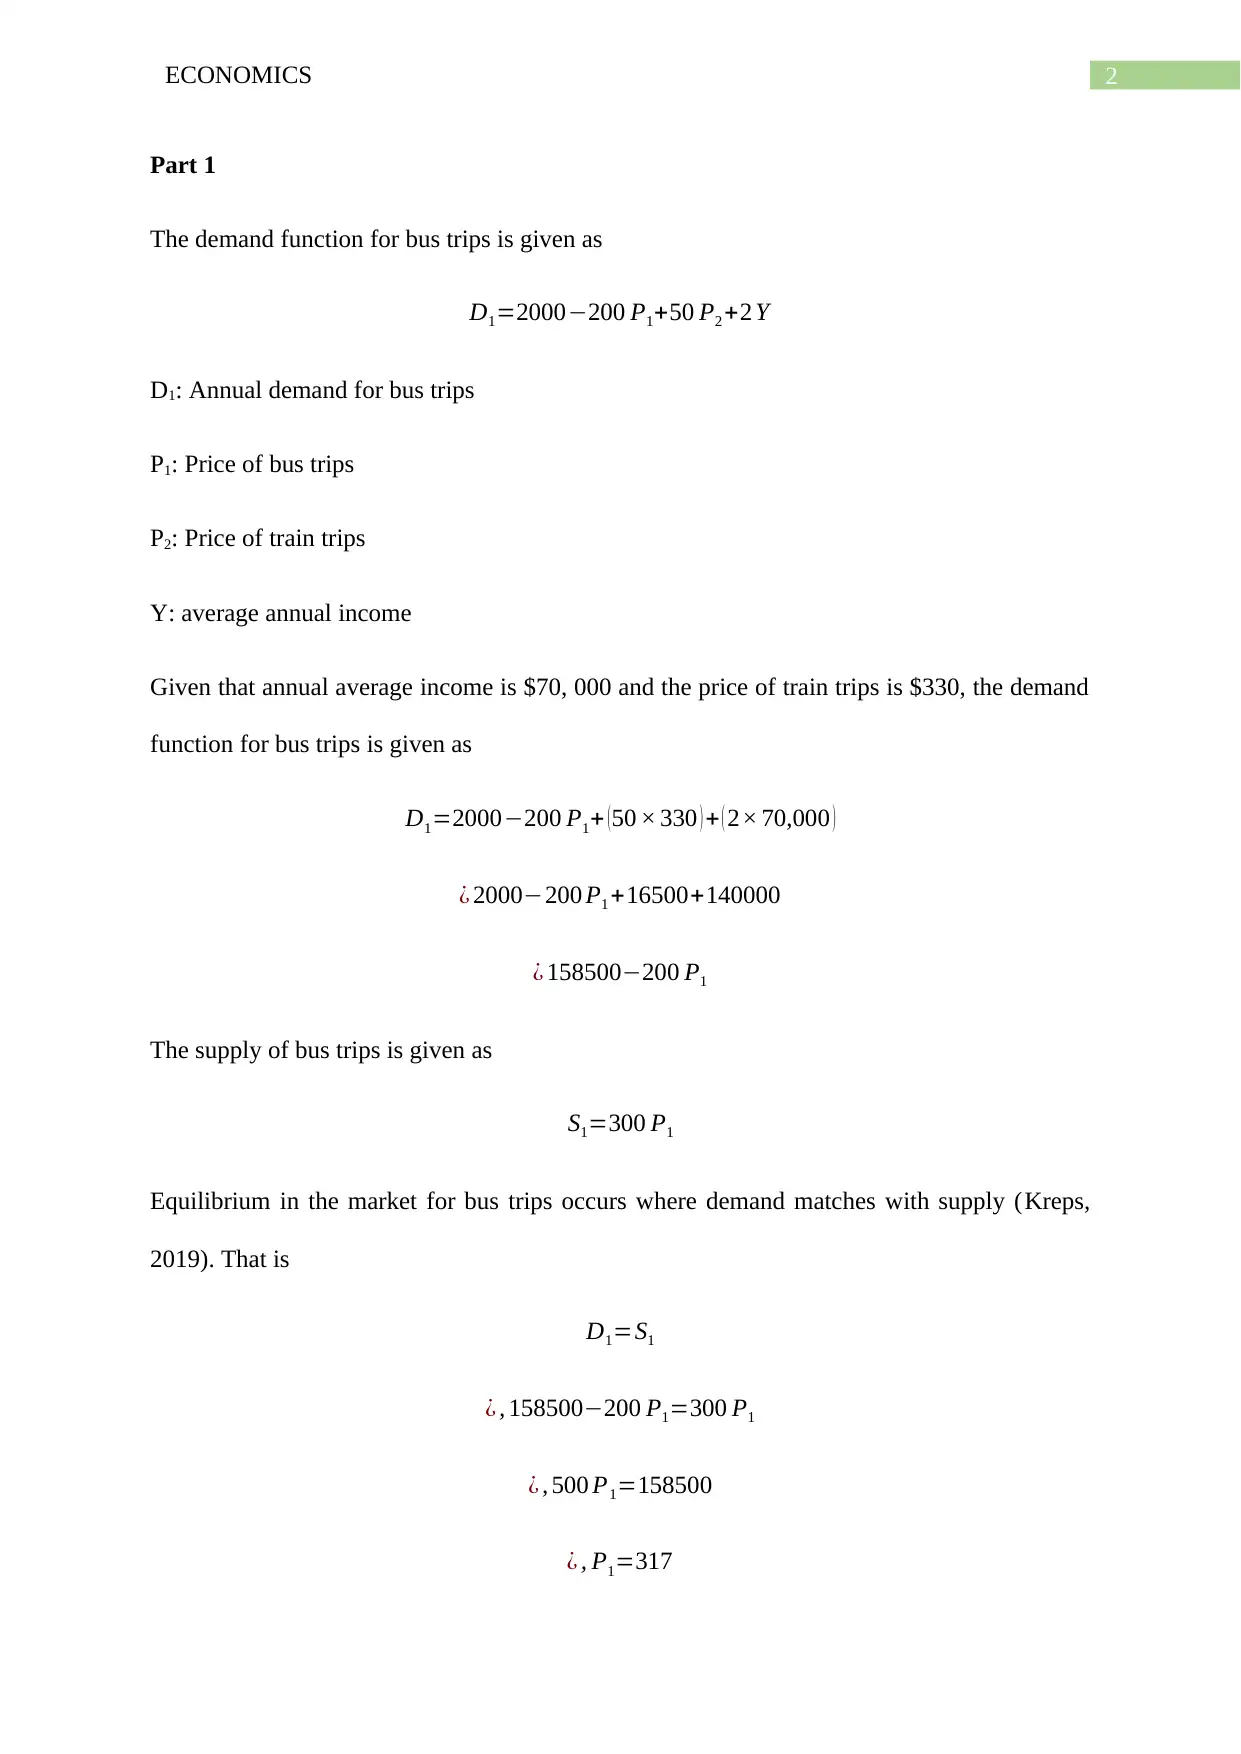
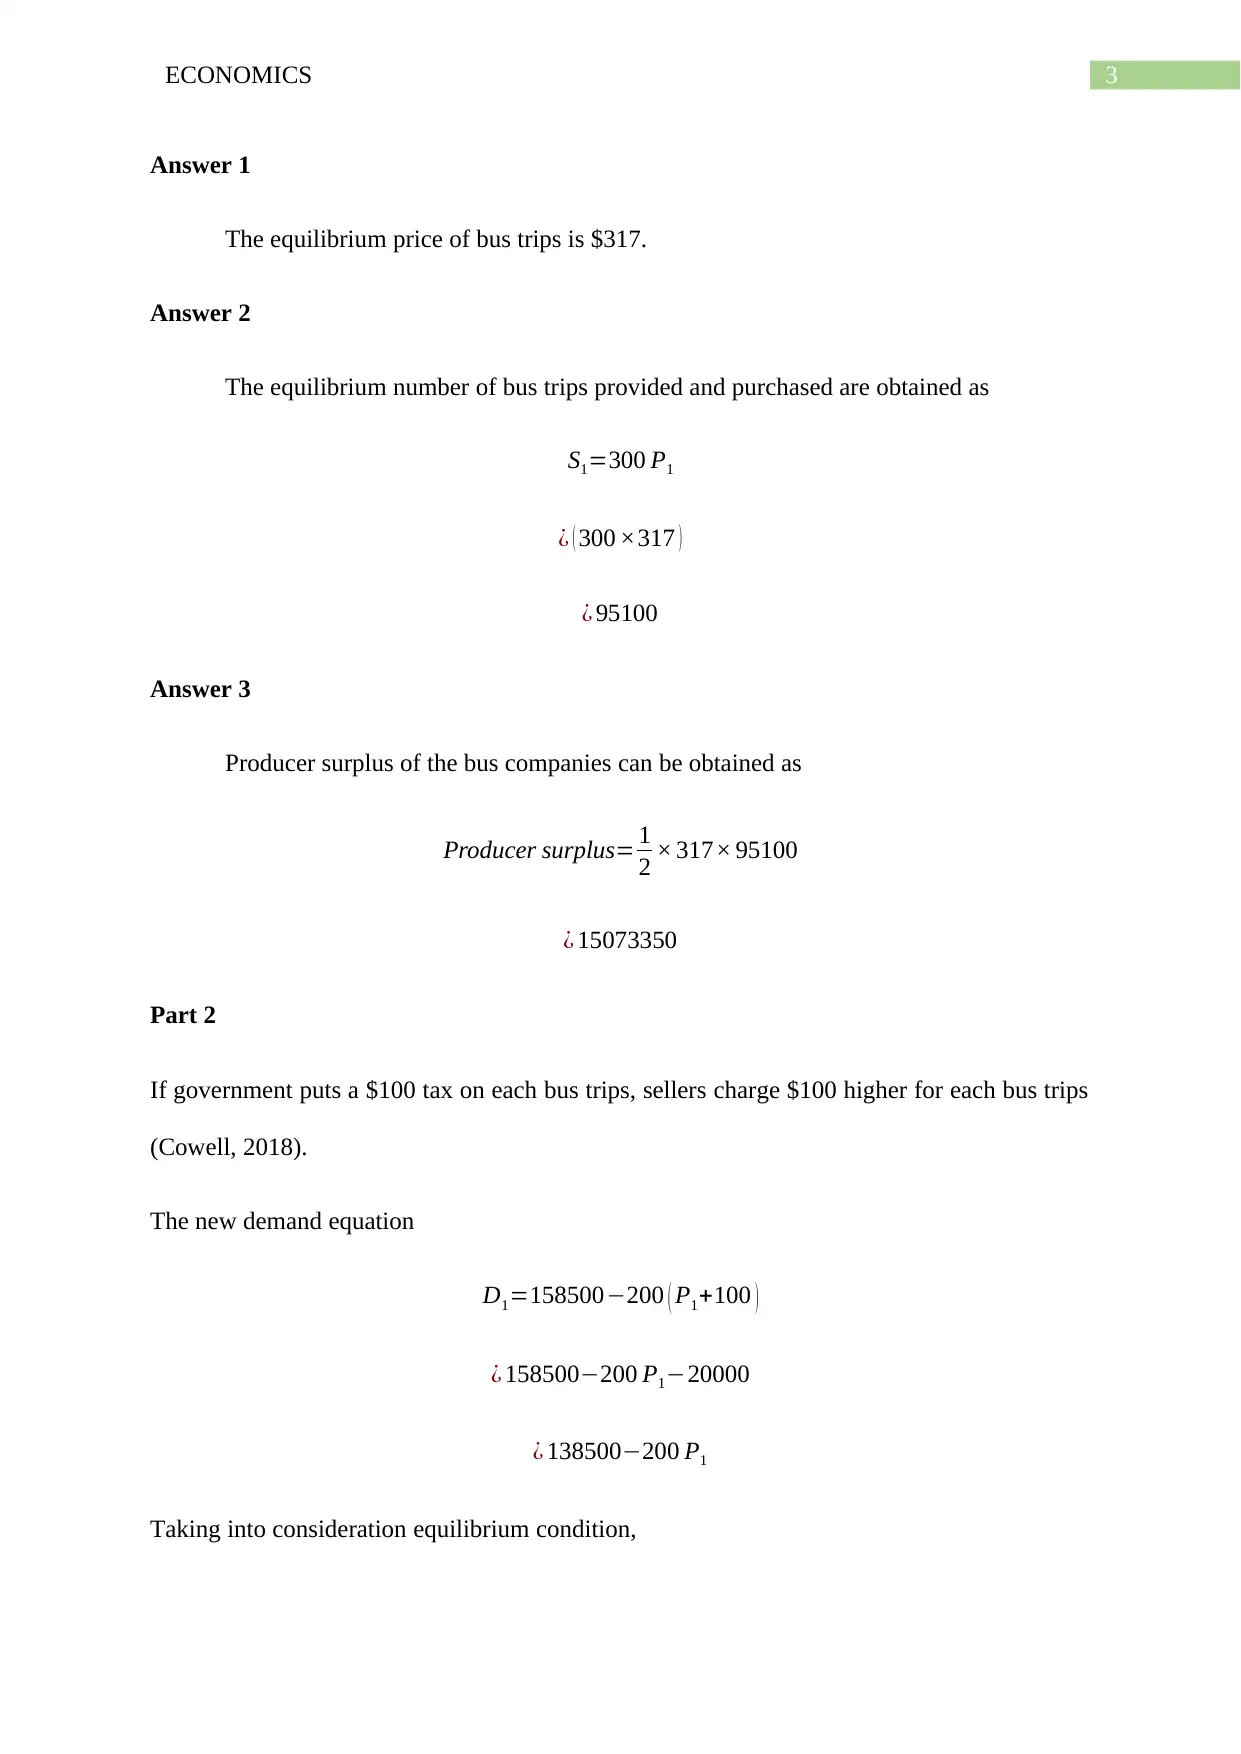
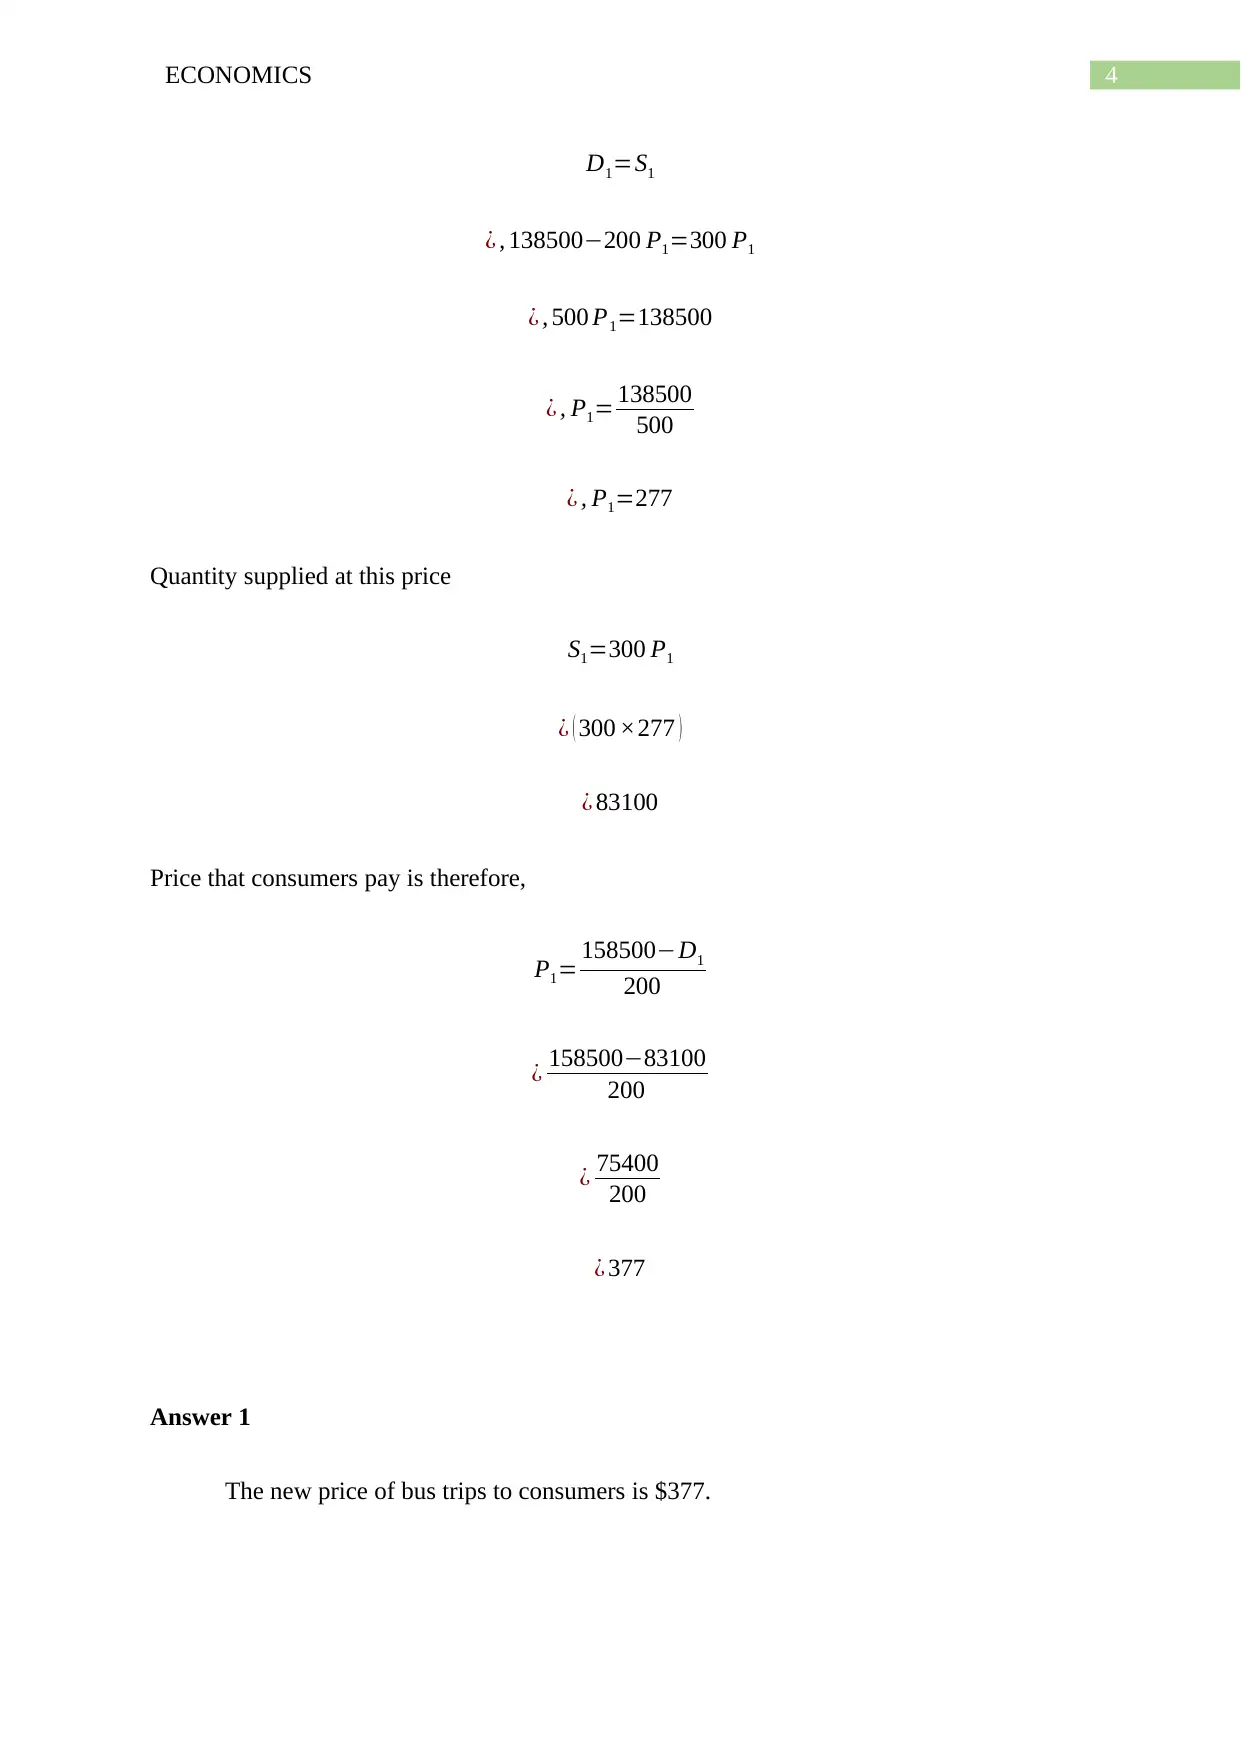
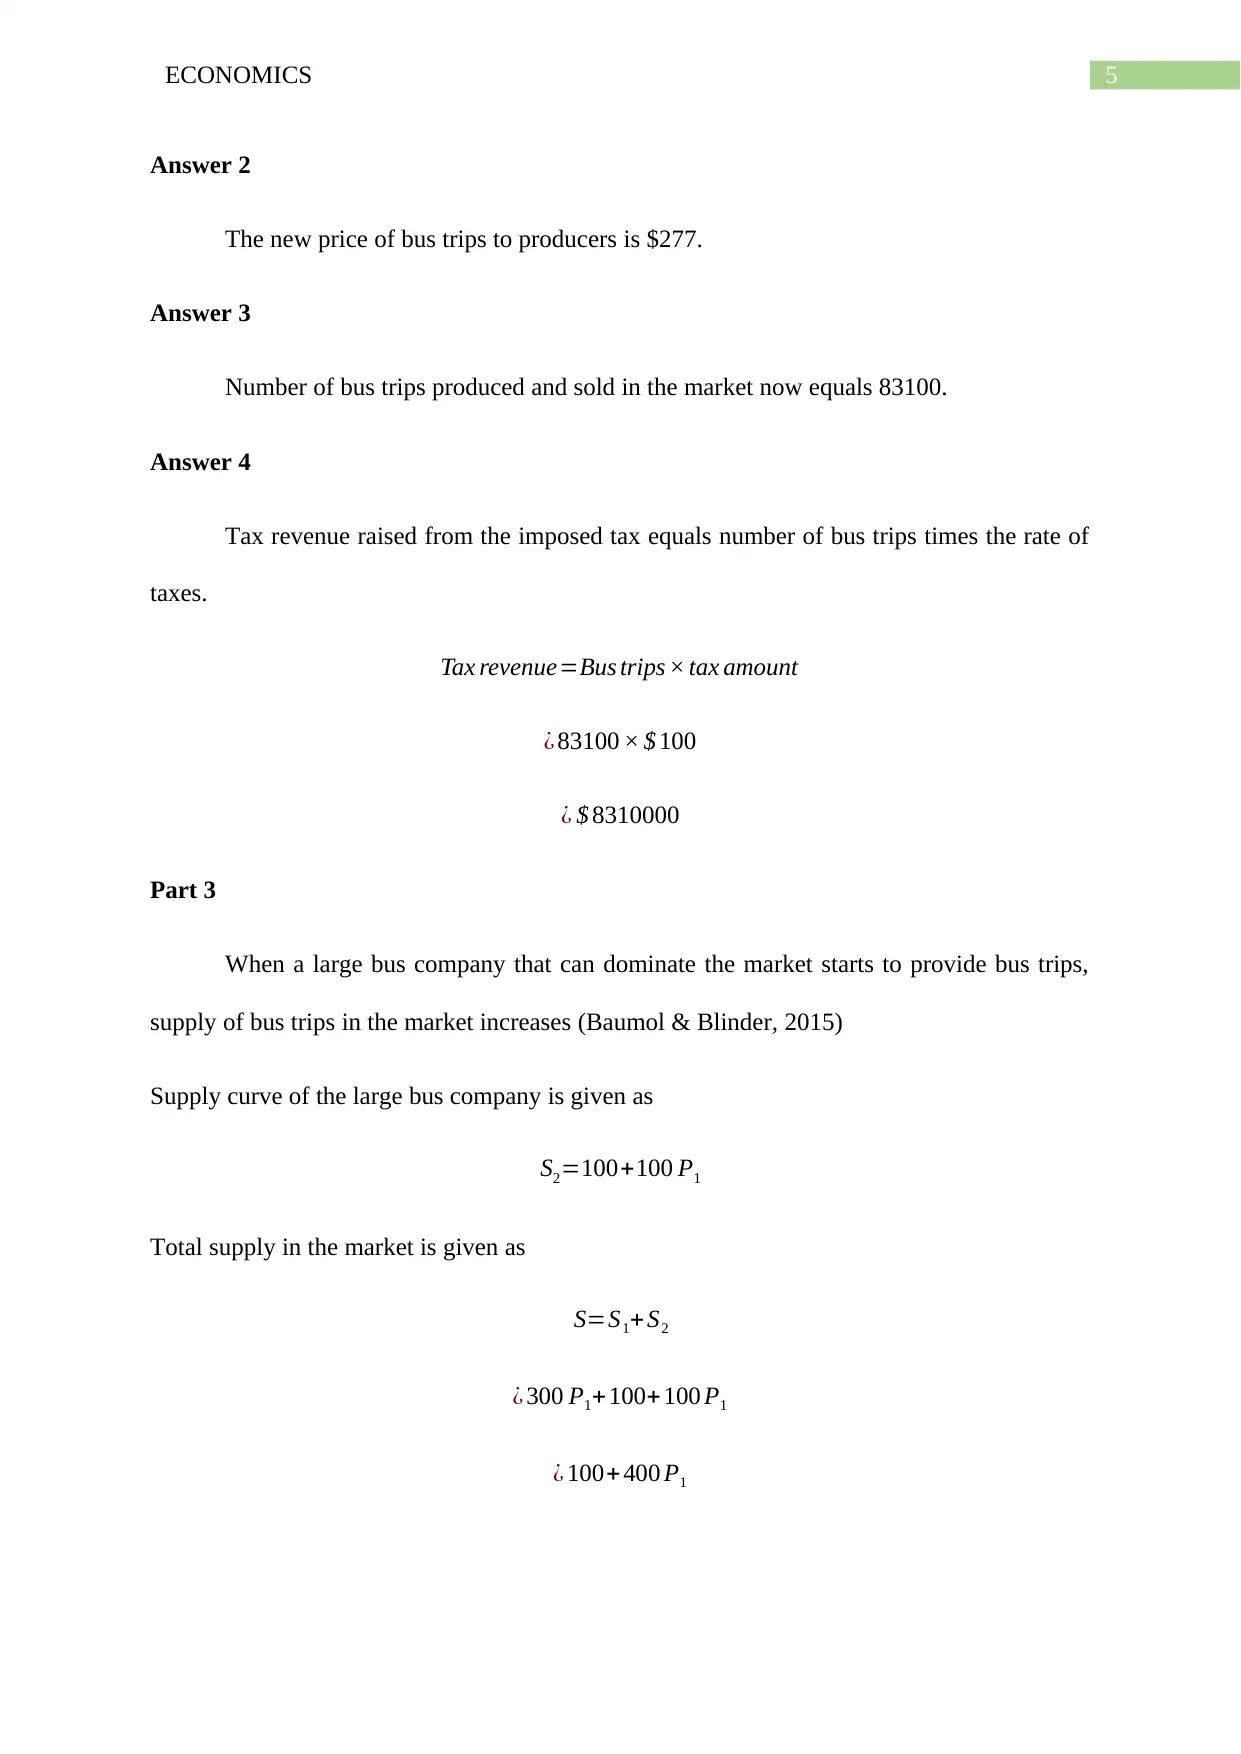
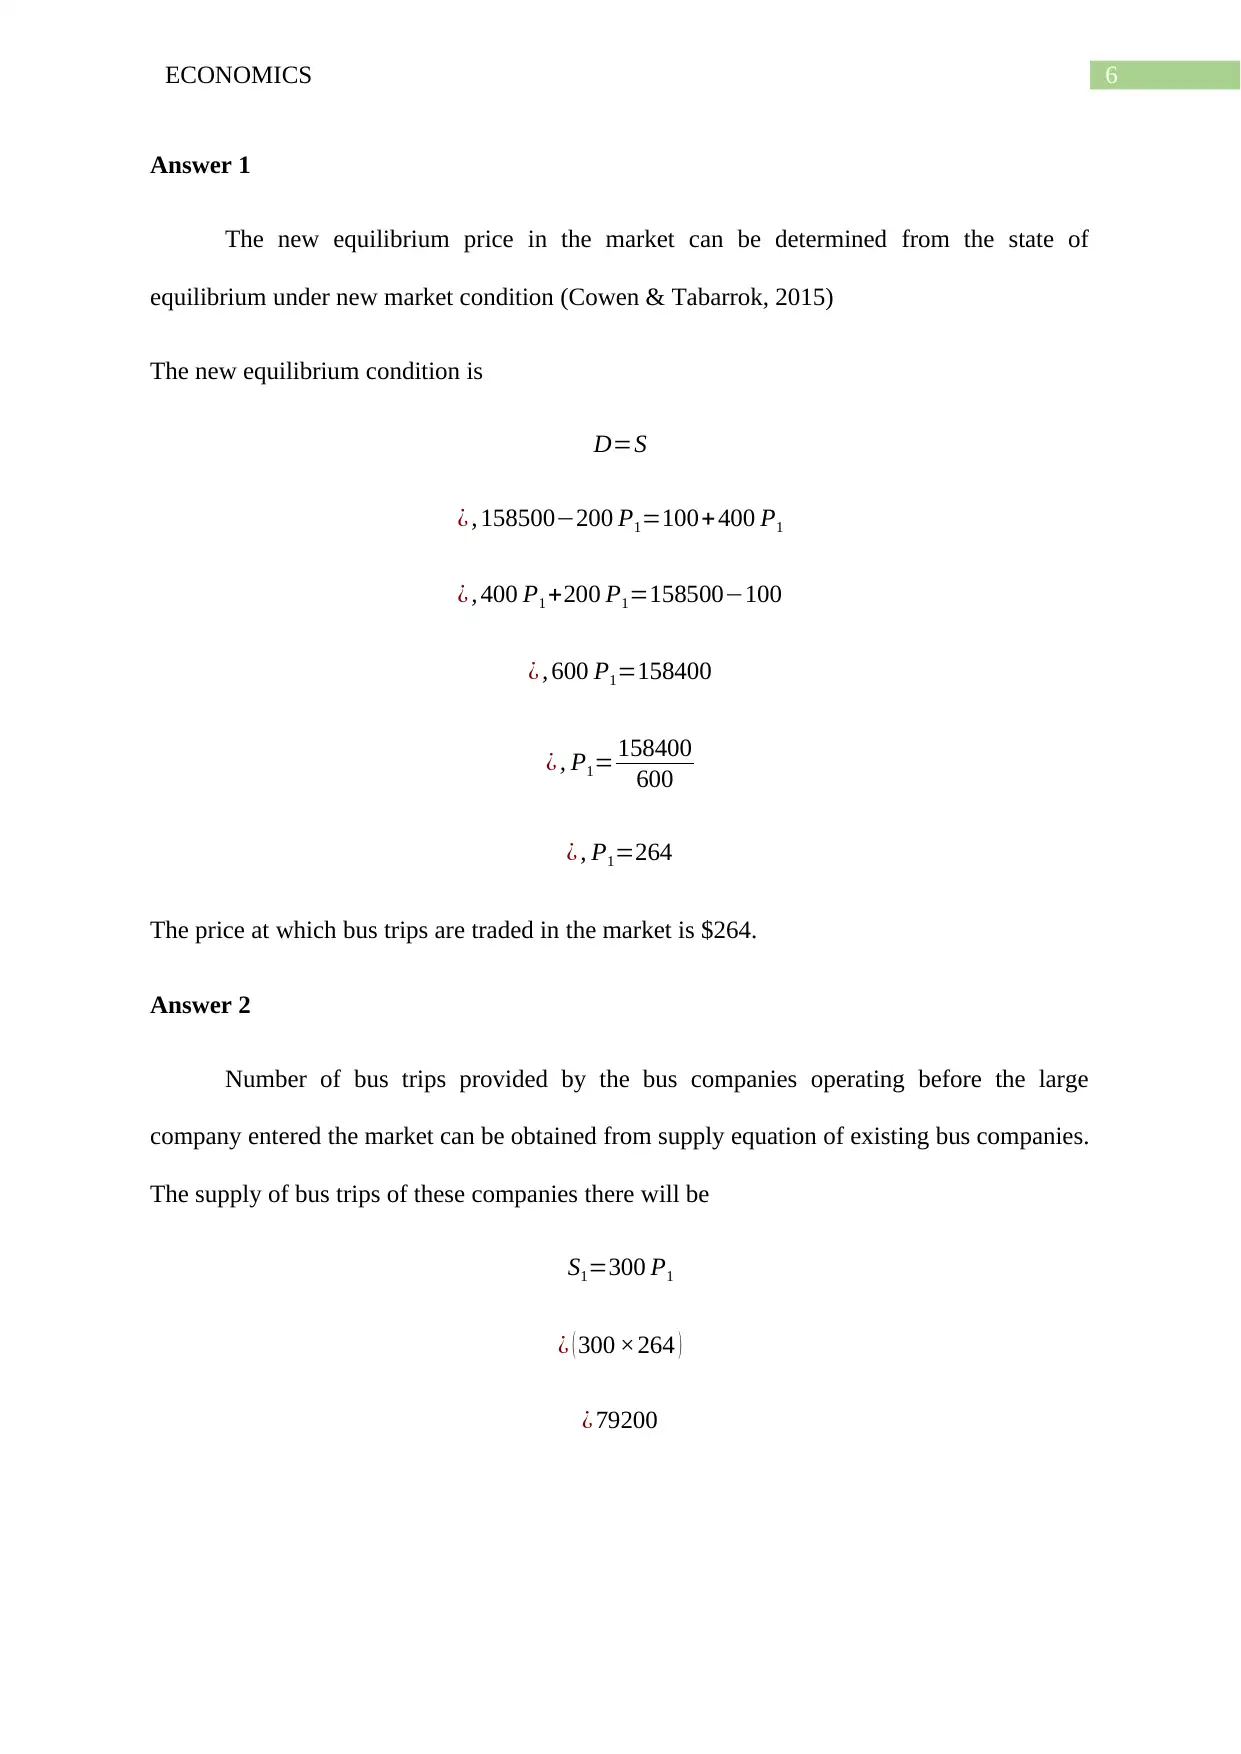
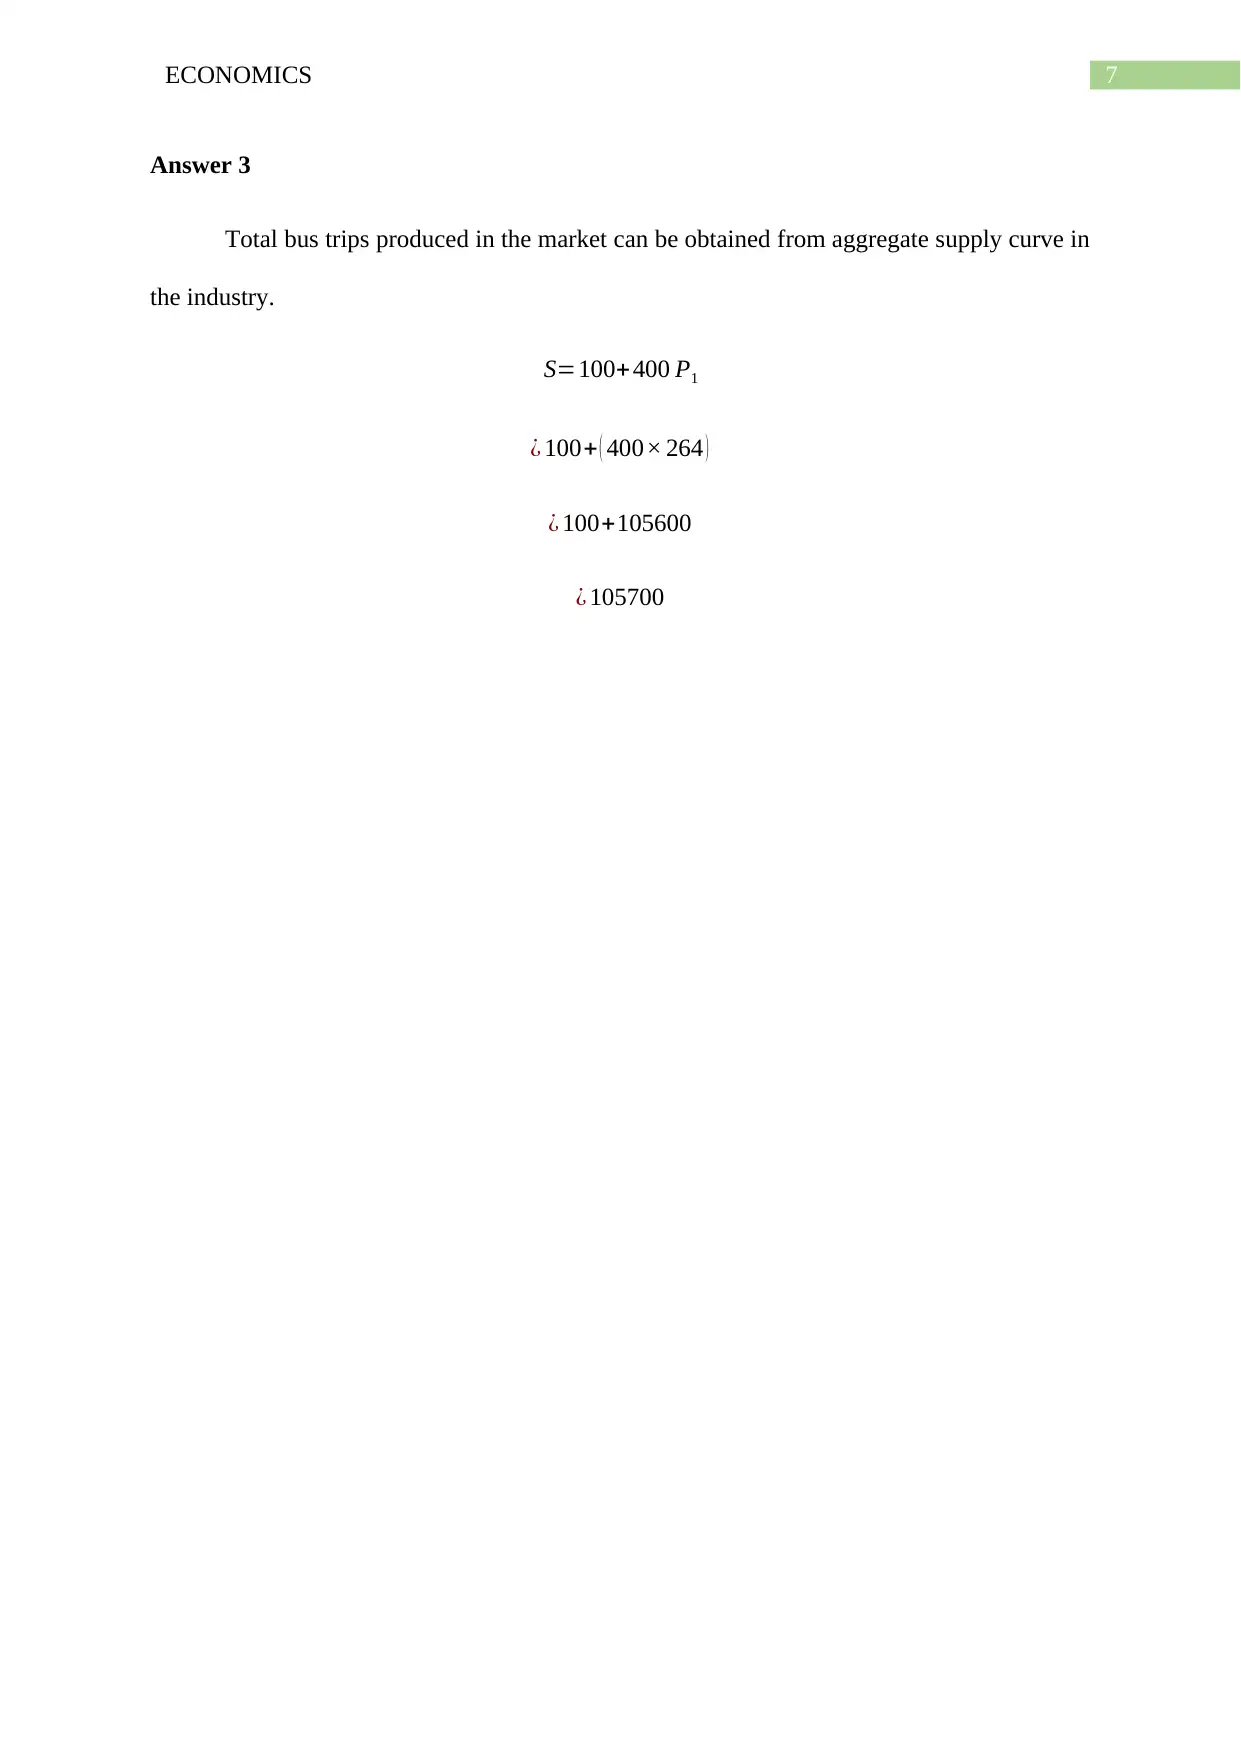
This economics assignment analyzes the market for bus trips, considering them as substitutes for train trips. The solution first determines the equilibrium price and quantity, and then calculates producer surplus. The assignment then explores the impact of a $100 tax on bus trips, analyzing the new price paid by consumers and received by producers, the quantity sold, and the tax revenue generated. Finally, the assignment examines the effects of a large bus company entering the market, determining the new equilibrium price and the supply from existing companies. The analysis utilizes demand and supply functions, incorporating concepts of market equilibrium, producer surplus, and the impact of government intervention and market structure changes.
Document Page
Running head: ECONOMICS
Economics
Name of the Student
Name of the University
Course ID
tabler-icon-diamond-filled.svg

Paraphrase This Document

Need a fresh take? Get an instant paraphrase of this document with our AI Paraphraser
Document Page
1ECONOMICS
Table of Contents
Part 1..........................................................................................................................................2
Answer 1................................................................................................................................3
Answer 2................................................................................................................................3
Answer 3................................................................................................................................3
Part 2..........................................................................................................................................3
Answer 1................................................................................................................................4
Answer 2................................................................................................................................5
Answer 3................................................................................................................................5
Answer 4................................................................................................................................5
Part 3..........................................................................................................................................5
Answer 1................................................................................................................................6
Answer 2................................................................................................................................6
Answer 3................................................................................................................................7
References..................................................................................................................................8
Document Page
2ECONOMICS
Part 1
The demand function for bus trips is given as
D1=2000200 P1+50 P2 +2 Y
D1: Annual demand for bus trips
P1: Price of bus trips
P2: Price of train trips
Y: average annual income
Given that annual average income is $70, 000 and the price of train trips is $330, the demand
function for bus trips is given as
D1=2000200 P1+ ( 50 × 330 ) + ( 2× 70,000 )
¿ 2000200 P1 +16500+140000
¿ 158500200 P1
The supply of bus trips is given as
S1=300 P1
Equilibrium in the market for bus trips occurs where demand matches with supply (Kreps,
2019). That is
D1=S1
¿ , 158500200 P1=300 P1
¿ , 500 P1=158500
¿ , P1=317
Document Page
3ECONOMICS
Answer 1
The equilibrium price of bus trips is $317.
Answer 2
The equilibrium number of bus trips provided and purchased are obtained as
S1=300 P1
¿ ( 300 ×317 )
¿ 95100
Answer 3
Producer surplus of the bus companies can be obtained as
Producer surplus= 1
2 × 317× 95100
¿ 15073350
Part 2
If government puts a $100 tax on each bus trips, sellers charge $100 higher for each bus trips
(Cowell, 2018).
The new demand equation
D1=158500200 ( P1+100 )
¿ 158500200 P120000
¿ 138500200 P1
Taking into consideration equilibrium condition,
tabler-icon-diamond-filled.svg

Paraphrase This Document

Need a fresh take? Get an instant paraphrase of this document with our AI Paraphraser
Document Page
4ECONOMICS
D1=S1
¿ , 138500200 P1=300 P1
¿ , 500 P1=138500
¿ , P1= 138500
500
¿ , P1=277
Quantity supplied at this price
S1=300 P1
¿ ( 300 ×277 )
¿ 83100
Price that consumers pay is therefore,
P1= 158500D1
200
¿ 15850083100
200
¿ 75400
200
¿ 377
Answer 1
The new price of bus trips to consumers is $377.
Document Page
5ECONOMICS
Answer 2
The new price of bus trips to producers is $277.
Answer 3
Number of bus trips produced and sold in the market now equals 83100.
Answer 4
Tax revenue raised from the imposed tax equals number of bus trips times the rate of
taxes.
Tax revenue=Bus trips × tax amount
¿ 83100 × $ 100
¿ $ 8310000
Part 3
When a large bus company that can dominate the market starts to provide bus trips,
supply of bus trips in the market increases (Baumol & Blinder, 2015)
Supply curve of the large bus company is given as
S2=100+100 P1
Total supply in the market is given as
S=S1+ S2
¿ 300 P1+ 100+ 100 P1
¿ 100+ 400 P1
Document Page
6ECONOMICS
Answer 1
The new equilibrium price in the market can be determined from the state of
equilibrium under new market condition (Cowen & Tabarrok, 2015)
The new equilibrium condition is
D=S
¿ , 158500200 P1=100+400 P1
¿ , 400 P1 +200 P1=158500100
¿ , 600 P1=158400
¿ , P1= 158400
600
¿ , P1=264
The price at which bus trips are traded in the market is $264.
Answer 2
Number of bus trips provided by the bus companies operating before the large
company entered the market can be obtained from supply equation of existing bus companies.
The supply of bus trips of these companies there will be
S1=300 P1
¿ ( 300 ×264 )
¿ 79200
tabler-icon-diamond-filled.svg

Paraphrase This Document

Need a fresh take? Get an instant paraphrase of this document with our AI Paraphraser
Document Page
7ECONOMICS
Answer 3
Total bus trips produced in the market can be obtained from aggregate supply curve in
the industry.
S=100+400 P1
¿ 100+ ( 400× 264 )
¿ 100+105600
¿ 105700
Document Page
8ECONOMICS
References
Baumol, W. J., & Blinder, A. S. (2015). Microeconomics: Principles and policy. Nelson
Education.
Cowell, F. (2018). Microeconomics: principles and analysis. Oxford University Press.
Cowen, T., & Tabarrok, A. (2015). Modern principles of microeconomics. Macmillan
International Higher Education.
Kreps, D. M. (2019). Microeconomics for managers. Princeton University Press.
chevron_up_icon
1 out of 9
circle_padding
hide_on_mobile
zoom_out_icon
[object Object]