BUS105 Computing Assignment: Statistical Analysis and Interpretation

Verified

Added on  2019/11/08

|15
|2313
|1534
Homework Assignment
AI Summary
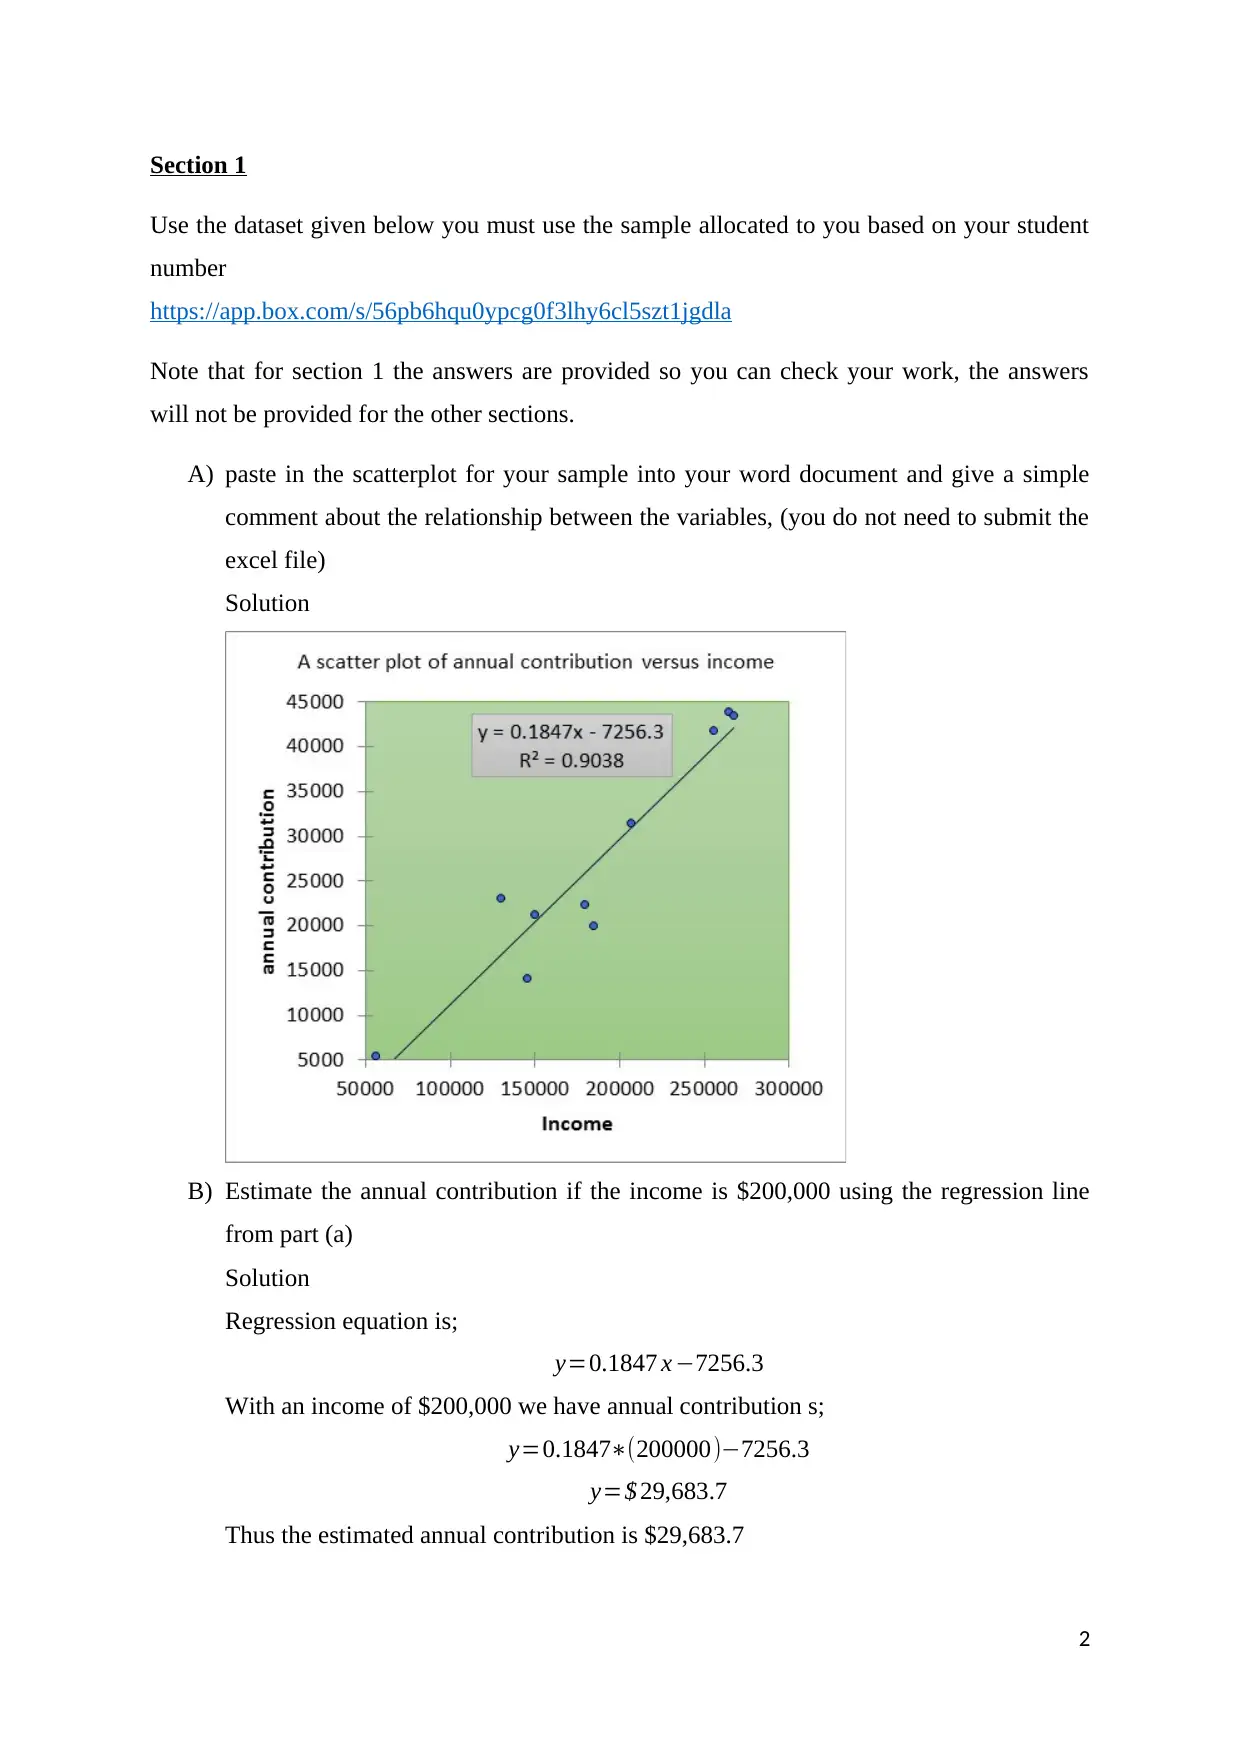
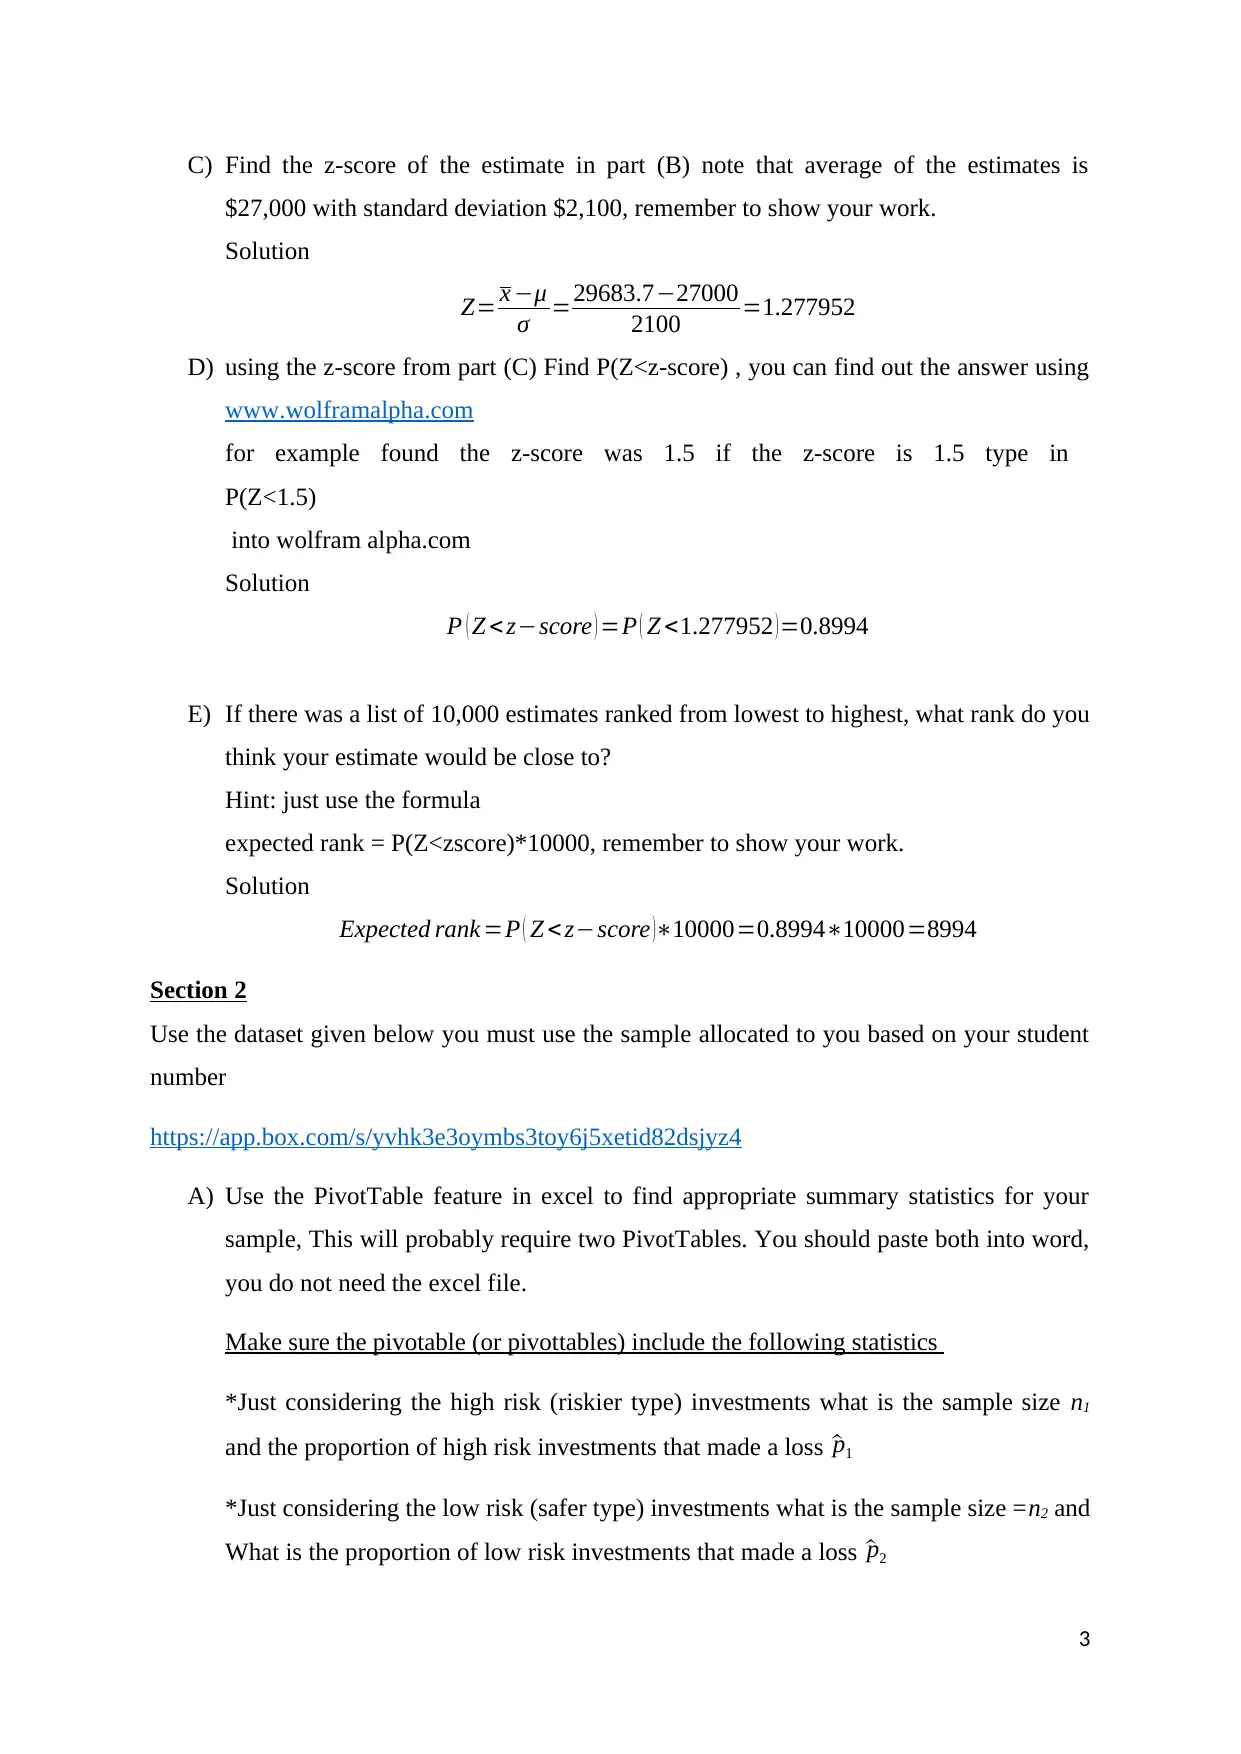
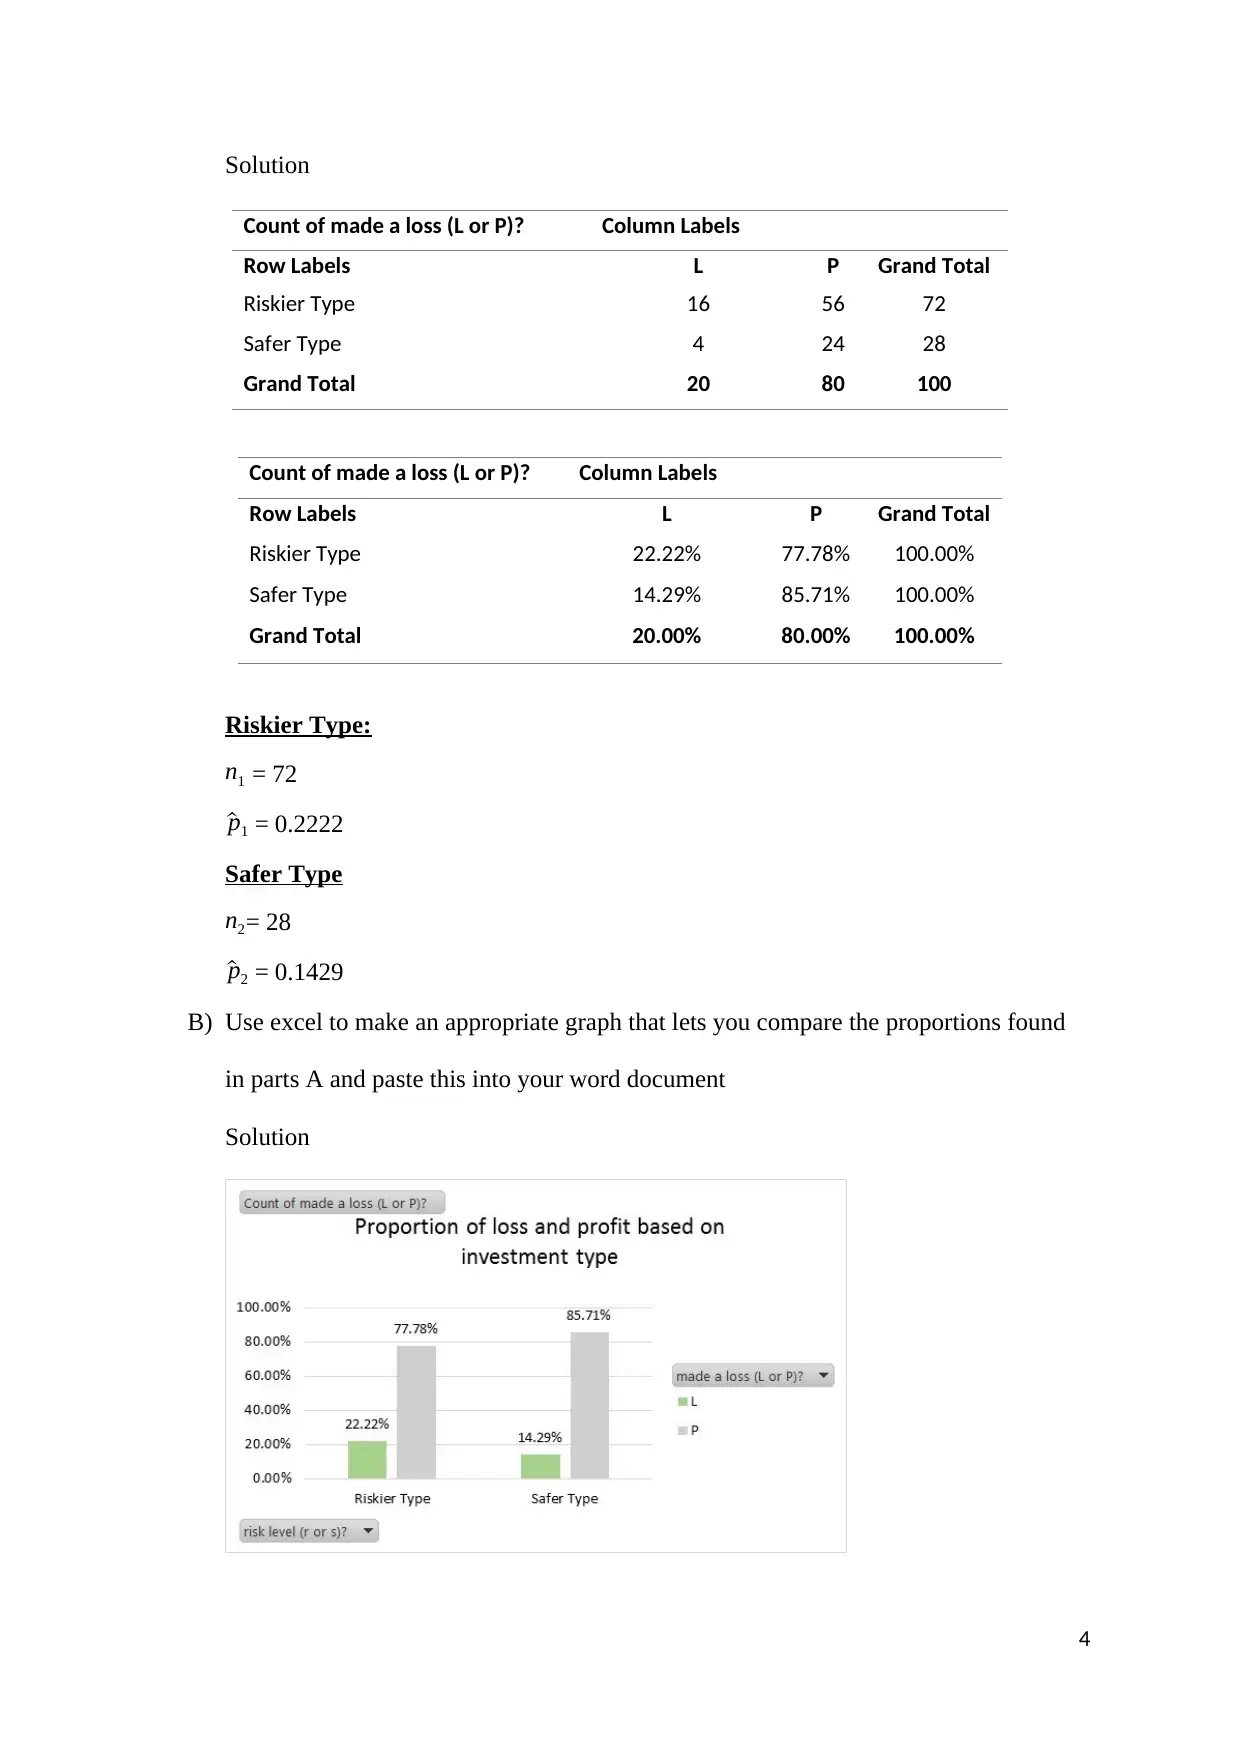
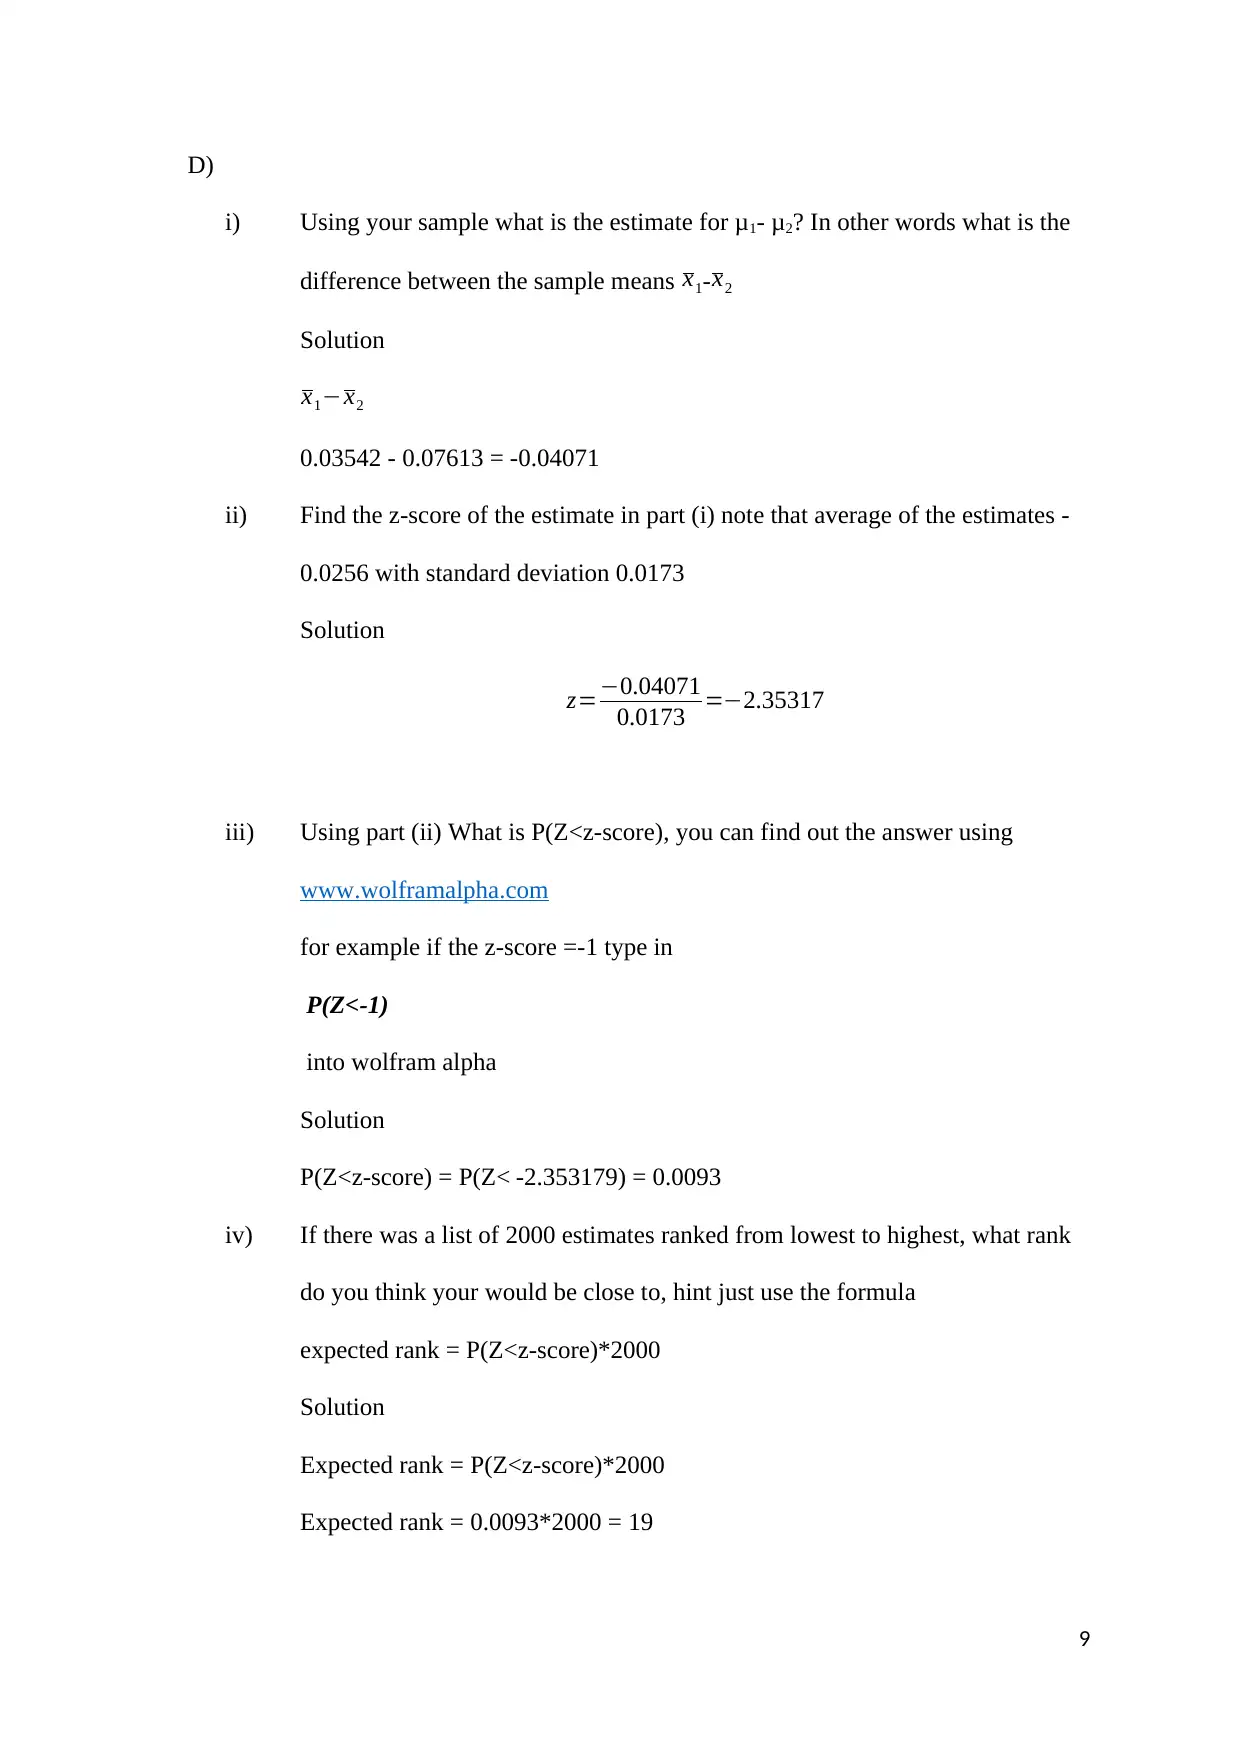
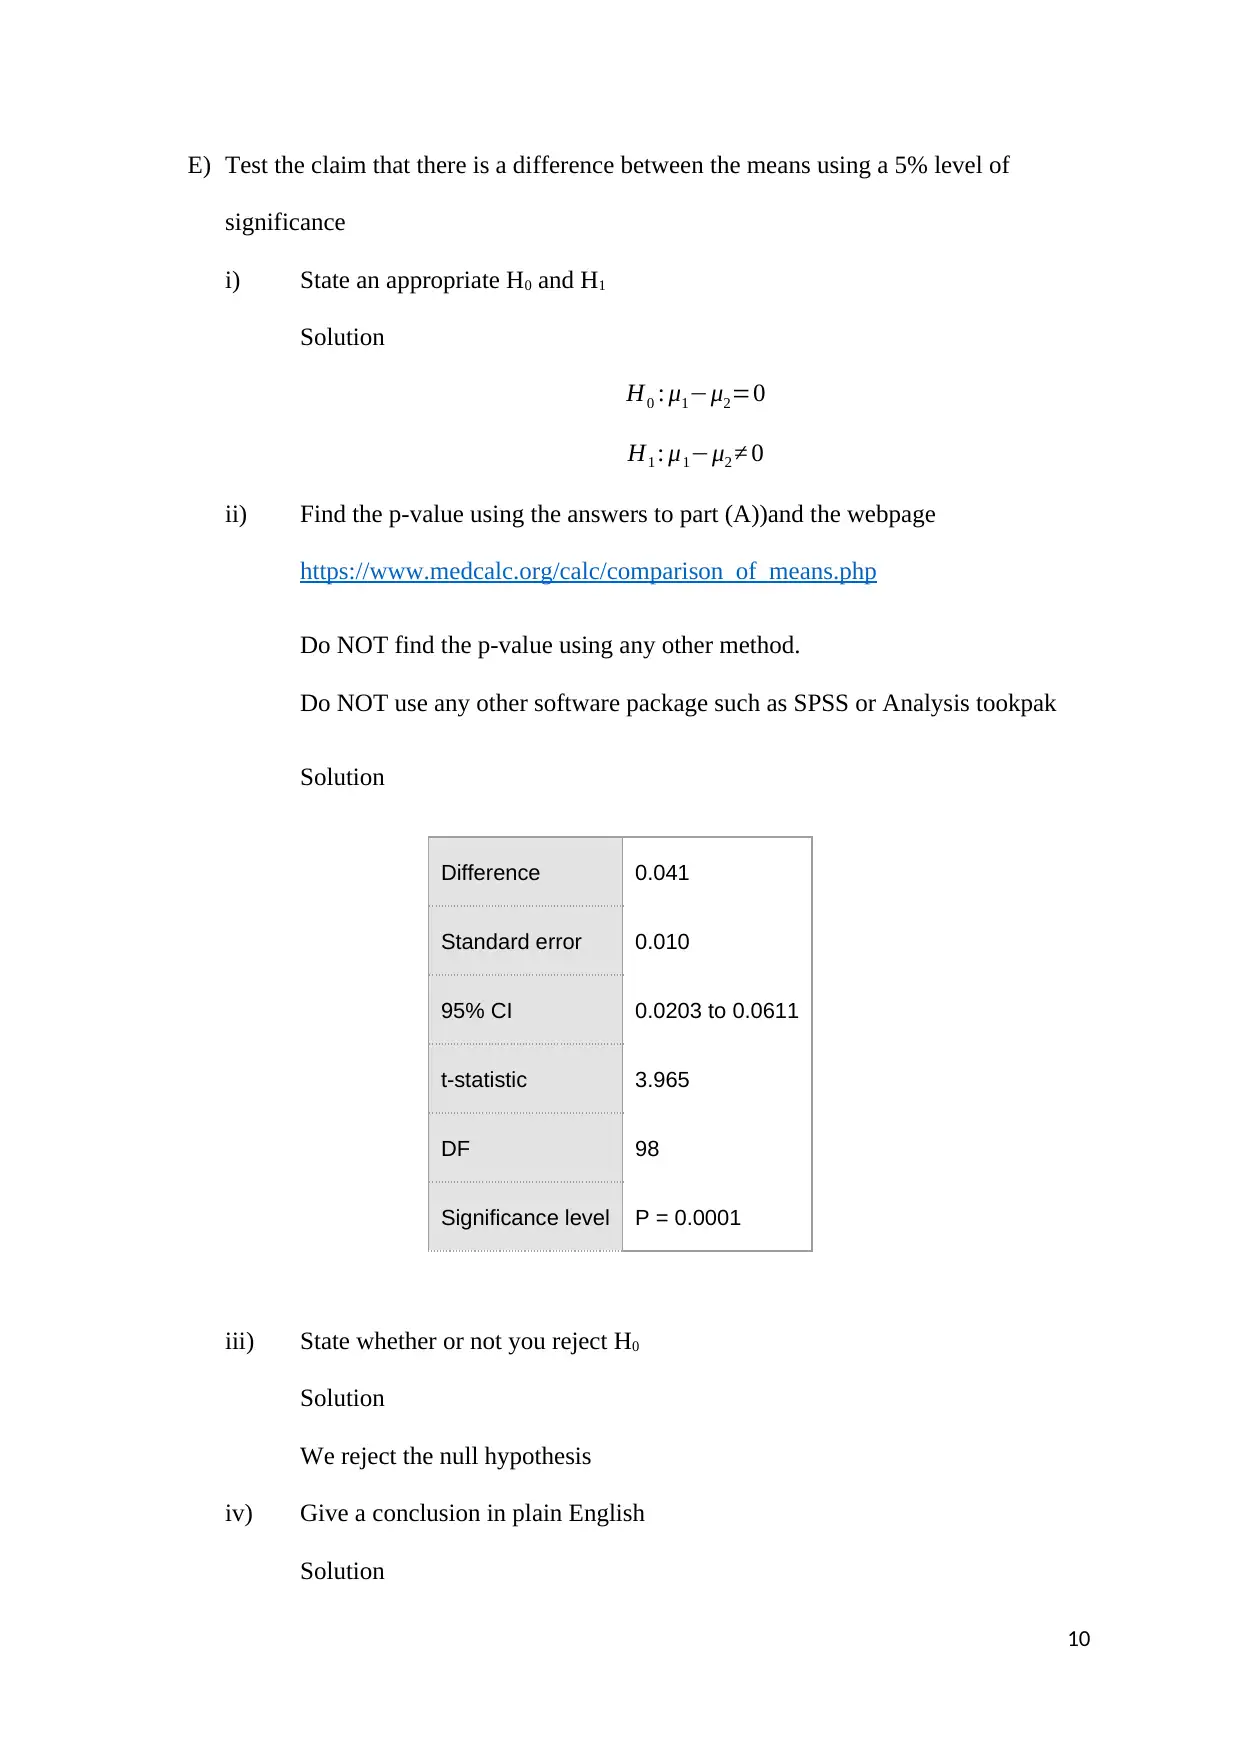
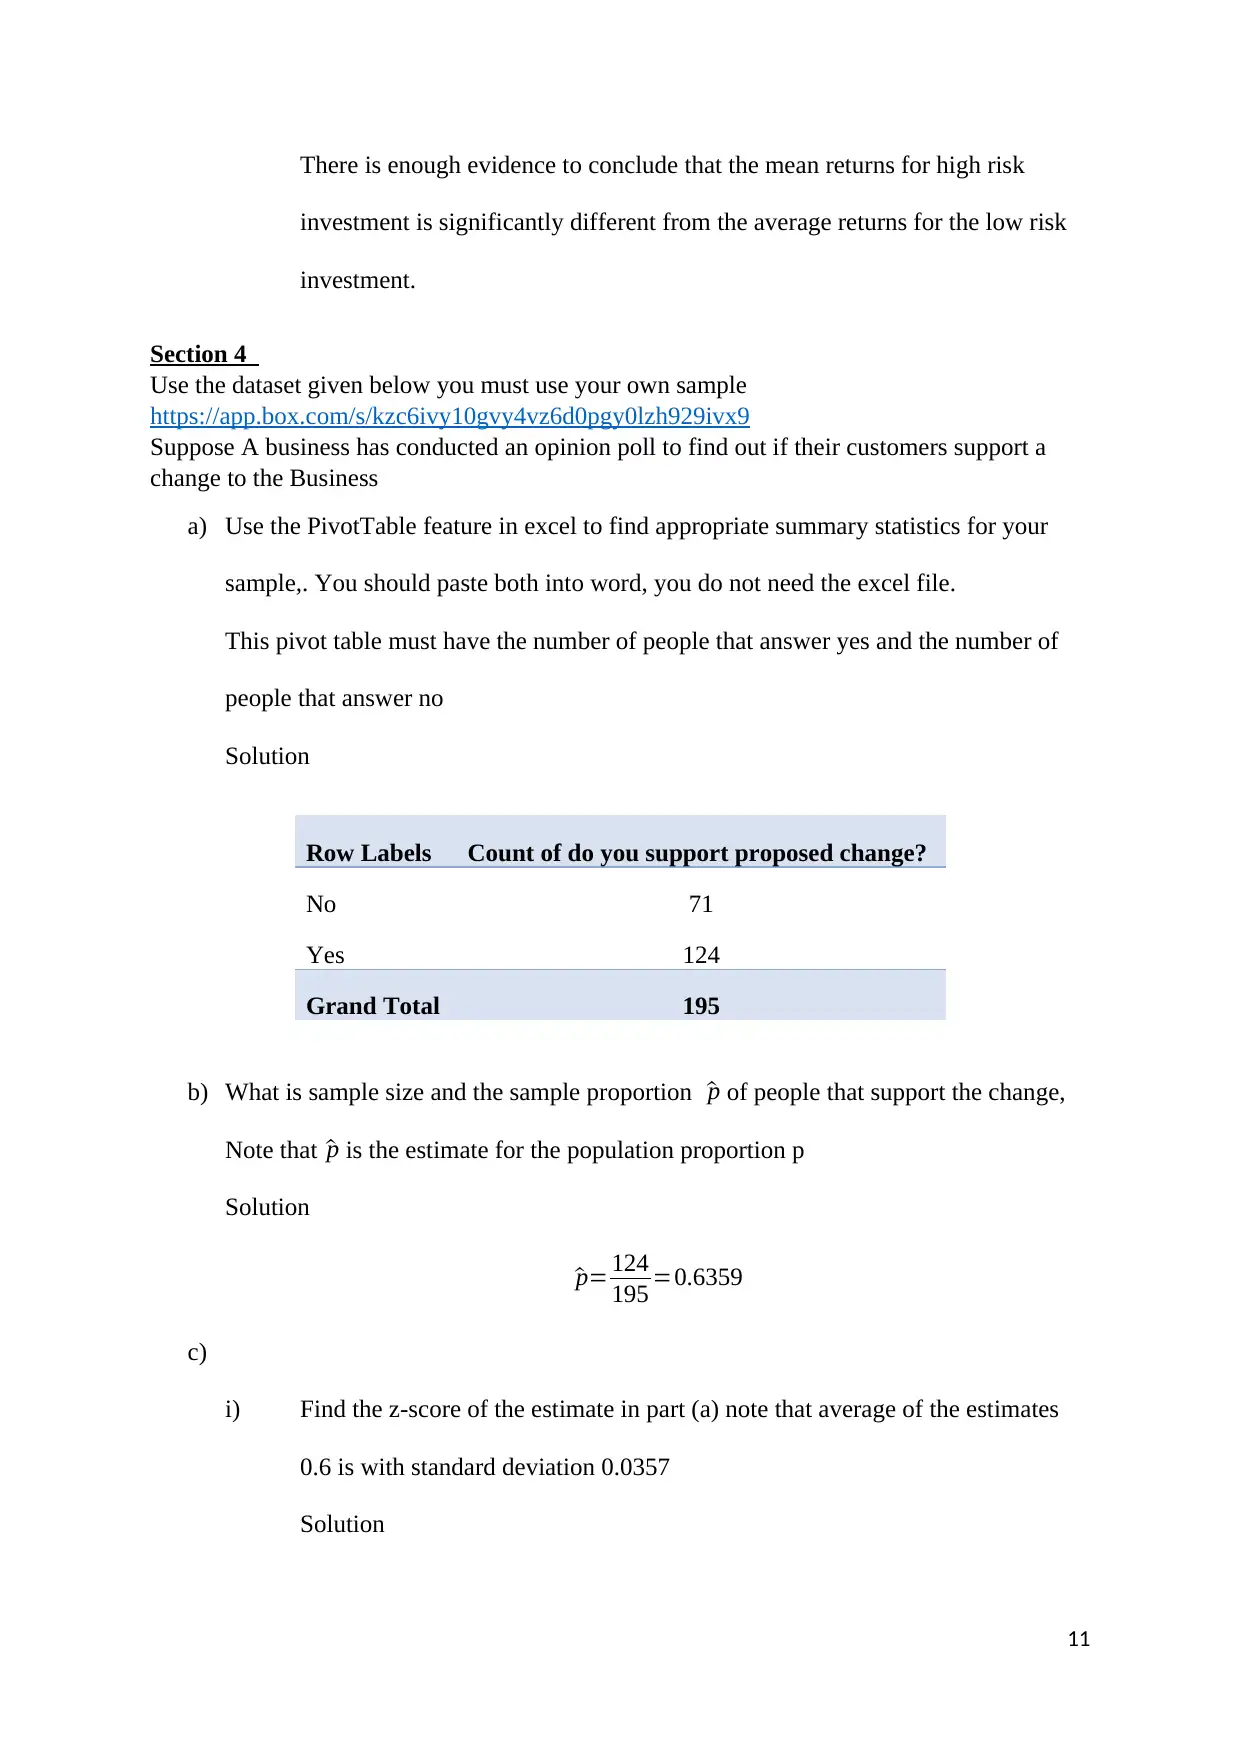
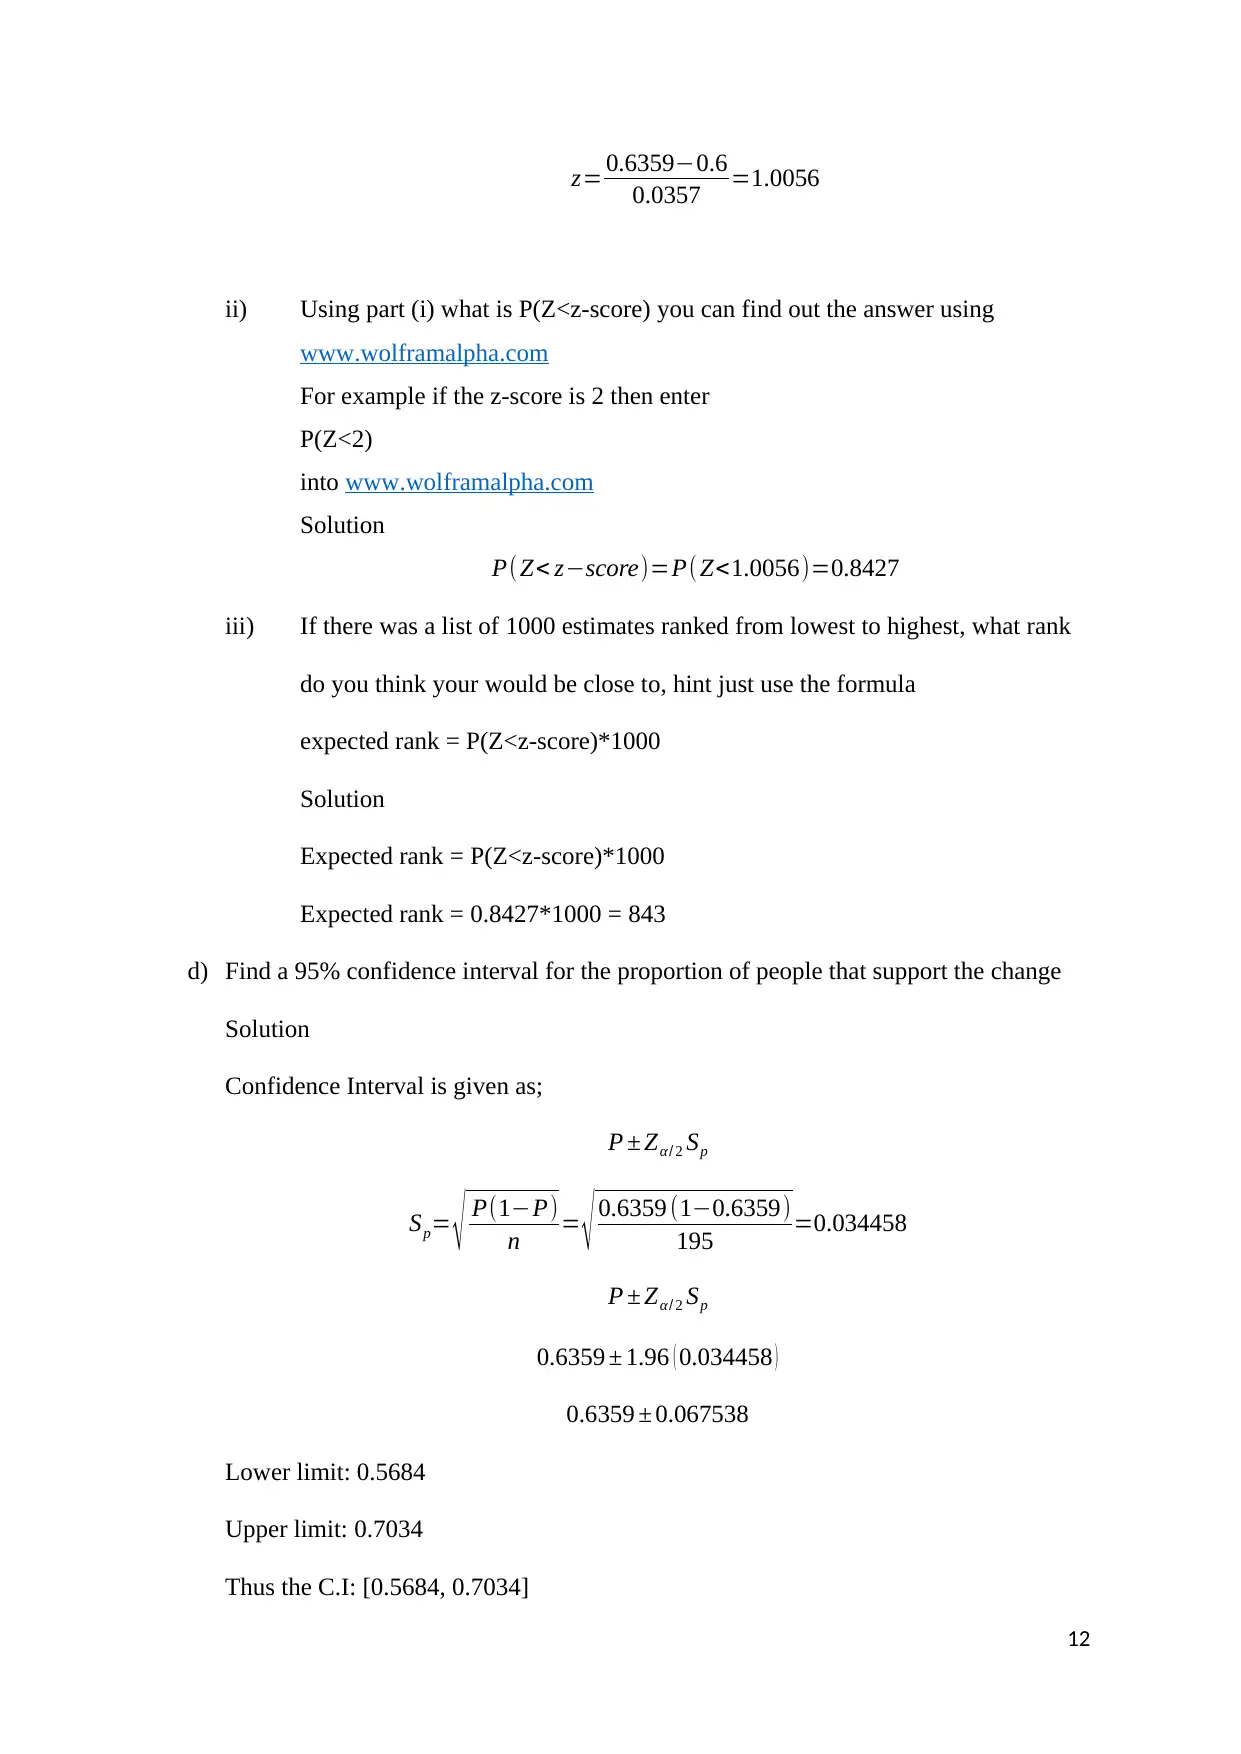
This assignment solution addresses a BUS105 computing assignment involving statistical analysis and data interpretation. The assignment is divided into multiple sections, each focusing on different statistical concepts. Section 1 requires the student to analyze a dataset using a provided sample, create a scatterplot, and interpret the relationship between variables. It then calculates regression equations, z-scores, and ranks estimates. Section 2 utilizes pivot tables to summarize data, compares proportions of risky and safe investments, and performs hypothesis testing. Section 3 continues with pivot table analysis, calculates mean differences, z-scores, and conducts hypothesis testing. Section 4 focuses on opinion polls, calculating sample proportions, z-scores, confidence intervals, and expected ranks. Section 5 requires the student to create their own dataset, summarize variables using pivot tables, and provide a brief comment. Finally, Section 6 summarizes a YouTube video on risk and returns, covering concepts like standard deviation and rate of return.
Document Page
Title: bus105 computing assignment semester 2, 2017
Name:
Student number:
Allocated sample: 18
tabler-icon-diamond-filled.svg

Paraphrase This Document

Need a fresh take? Get an instant paraphrase of this document with our AI Paraphraser
Document Page
Section 1
Use the dataset given below you must use the sample allocated to you based on your student
number
https://app.box.com/s/56pb6hqu0ypcg0f3lhy6cl5szt1jgdla
Note that for section 1 the answers are provided so you can check your work, the answers
will not be provided for the other sections.
A) paste in the scatterplot for your sample into your word document and give a simple
comment about the relationship between the variables, (you do not need to submit the
excel file)
Solution
B) Estimate the annual contribution if the income is $200,000 using the regression line
from part (a)
Solution
Regression equation is;
y=0.1847 x 7256.3
With an income of $200,000 we have annual contribution s;
y=0.1847(200000)7256.3
y=$ 29,683.7
Thus the estimated annual contribution is $29,683.7
2
Document Page
C) Find the z-score of the estimate in part (B) note that average of the estimates is
$27,000 with standard deviation $2,100, remember to show your work.
Solution
Z= x μ
σ =29683.727000
2100 =1.277952
D) using the z-score from part (C) Find P(Z<z-score) , you can find out the answer using
www.wolframalpha.com
for example found the z-score was 1.5 if the z-score is 1.5 type in
P(Z<1.5)
into wolfram alpha.com
Solution
P ( Z < zscore ) =P ( Z <1.277952 )=0.8994
E) If there was a list of 10,000 estimates ranked from lowest to highest, what rank do you
think your estimate would be close to?
Hint: just use the formula
expected rank = P(Z<zscore)*10000, remember to show your work.
Solution
Expected rank =P ( Z < zscore )10000=0.899410000=8994
Section 2
Use the dataset given below you must use the sample allocated to you based on your student
number
https://app.box.com/s/yvhk3e3oymbs3toy6j5xetid82dsjyz4
A) Use the PivotTable feature in excel to find appropriate summary statistics for your
sample, This will probably require two PivotTables. You should paste both into word,
you do not need the excel file.
Make sure the pivotable (or pivottables) include the following statistics
*Just considering the high risk (riskier type) investments what is the sample size n1
and the proportion of high risk investments that made a loss ^p1
*Just considering the low risk (safer type) investments what is the sample size =n2 and
What is the proportion of low risk investments that made a loss ^p2
3
Document Page
Solution
Count of made a loss (L or P)? Column Labels
Row Labels L P Grand Total
Riskier Type 16 56 72
Safer Type 4 24 28
Grand Total 20 80 100
Count of made a loss (L or P)? Column Labels
Row Labels L P Grand Total
Riskier Type 22.22% 77.78% 100.00%
Safer Type 14.29% 85.71% 100.00%
Grand Total 20.00% 80.00% 100.00%
Riskier Type:
n1 = 72
^p1 = 0.2222
Safer Type
n2= 28
^p2 = 0.1429
B) Use excel to make an appropriate graph that lets you compare the proportions found
in parts A and paste this into your word document
Solution
4
tabler-icon-diamond-filled.svg

Paraphrase This Document

Need a fresh take? Get an instant paraphrase of this document with our AI Paraphraser
Document Page
C) Looking at your answers to parts (A) and (B) Make a simple comment about the
relationship between the variables
investment type (risky or safe ) and
Made a profit (made a profit/made a loss)
Solution
Based on results in parts (A) and (B), it is true that both types of investments made
profits and losses. However, safer type investment (85.71%) made profits compared
to the riskier type investments (77.78%)
D)
i) Using your sample what is the estimate for p1- p2? In other words what is the
difference between the sample proportions ^p1 - ^p2
Solution
^p1 ^p2=0.22220.1429=0.0793
ii) Find the z-score of the estimate in part (i) note that average of the estimates is
0.1 with standard deviation 0.0743
Solution
z= 0.07930.1
0.0743 =0.2786
iii) Using part (ii) find P(Z<z-score) using www.wolframalpha.com
for example if the z-score is 0.5 type in
P(Z<0.5)”
into wolframalpha.com
Solution
P ( Z <zscore ) =P ( Z 0.2786 )=0.3903
iv) IF there was a list of 4000 estimates ranked from lowest to highest, roughly
what rank do you expect your estimate to have?
5
Document Page
Hint: just use the formula
expected rank = P(Z<z-score)*4000
Solution
Expected rank =P ( Z <zscore )10000=0.39034000=1561
E) Test the claim there is a difference in the proportions use a 5% level of significance
i) State an appropriate H0 and H1
Solution
ii) Find the p-value Only using the answers to part (A) and the webpage
http://epitools.ausvet.com.au/content.php?page=z-test-2
Do NOT use any other method to find the p-value
Do NOT use any other software package such as SPSS or Analysis tookpak
Solution
Sample 1 Sample 2 Difference
Sample proportion 0.2222 0.1429 0.0793
95% CI (asymptotic) 0.1262 - 0.3182 0.0133 - 0.2725 -0.0953 - 0.2539
z-value 0.9
P-value 0.3734
Interpretation
Not significant,
accept null hypothesis that
sample proportions are equal
n by pi n * pi <=5, test inappropriate
iii) State whether or not you reject the H0
Solution
We fail to reject the null hypothesis
iv) Give a conclusion in plain English
Solution
6
Document Page
There is no evidence that the proportion of loss of the two types of
investments is different at 5% level of significance.
Section 3
Use the dataset given below you must use your own sample
https://app.box.com/s/z0mbtcfsdqxz1rm7rhw3p9sb75aq7174
A) Use the pivot table feature in excel to find appropriate summary statistics for your
sample. The following sample statistics must be found
Just considering the low risk investments, what is the sample size n1 , the sample
average return of low risk investments x1 , and the sample standard deviation s1
Just considering the high risk investments , what is the sample size n2 , the sample
average return of high risk investments x2 , and the sample standard deviation s2
Paste the pivot table into the word document you do not need to submit the excel file
Solution
Row Labels Count of High risk?
Low risk investment 69
High risk investment 31
Grand Total 100
Row Labels Average of return
Low risk investment 0.03542
High risk investment 0.07613
Grand Total 0.04804
Row Labels StdDev of return
Low risk investment 0.00311
High risk investment 0.08570
Grand Total 0.05090
Low risk investments
7
tabler-icon-diamond-filled.svg

Paraphrase This Document

Need a fresh take? Get an instant paraphrase of this document with our AI Paraphraser
Document Page
n1 = 69
x1 = 0.03542
s1 = 0.00311
High risk investments
n2 = 31
x2 = 0.07613
s2 = 0.08570
B) Give an appropriate graph that shows the relationship between variables, Note that the
information in part A is NOT Suitable for a graph you have to get different
information
Solution
C) Make a simple comment about the relationship between the variables using the
answers to (A) and (B)
The highest proportion of investments (69%) is the low risk investment, high
investment was represented by 31%. However, the high risk investment had the
highest average returns (0.07613) compared to the low risk investment (0.03542).
8
Document Page
D)
i) Using your sample what is the estimate for μ1- μ2? In other words what is the
difference between the sample means x1- x2
Solution
x1x2
0.03542 - 0.07613 = -0.04071
ii) Find the z-score of the estimate in part (i) note that average of the estimates -
0.0256 with standard deviation 0.0173
Solution
z=0.04071
0.0173 =2.35317
iii) Using part (ii) What is P(Z<z-score), you can find out the answer using
www.wolframalpha.com
for example if the z-score =-1 type in
P(Z<-1)
into wolfram alpha
Solution
P(Z<z-score) = P(Z< -2.353179) = 0.0093
iv) If there was a list of 2000 estimates ranked from lowest to highest, what rank
do you think your would be close to, hint just use the formula
expected rank = P(Z<z-score)*2000
Solution
Expected rank = P(Z<z-score)*2000
Expected rank = 0.0093*2000 = 19
9
Document Page
E) Test the claim that there is a difference between the means using a 5% level of
significance
i) State an appropriate H0 and H1
Solution
H0 : μ1μ2=0
H1 : μ1μ2 0
ii) Find the p-value using the answers to part (A))and the webpage
https://www.medcalc.org/calc/comparison_of_means.php
Do NOT find the p-value using any other method.
Do NOT use any other software package such as SPSS or Analysis tookpak
Solution
Difference 0.041
Standard error 0.010
95% CI 0.0203 to 0.0611
t-statistic 3.965
DF 98
Significance level P = 0.0001
iii) State whether or not you reject H0
Solution
We reject the null hypothesis
iv) Give a conclusion in plain English
Solution
10
tabler-icon-diamond-filled.svg

Paraphrase This Document

Need a fresh take? Get an instant paraphrase of this document with our AI Paraphraser
Document Page
There is enough evidence to conclude that the mean returns for high risk
investment is significantly different from the average returns for the low risk
investment.
Section 4
Use the dataset given below you must use your own sample
https://app.box.com/s/kzc6ivy10gvy4vz6d0pgy0lzh929ivx9
Suppose A business has conducted an opinion poll to find out if their customers support a
change to the Business
a) Use the PivotTable feature in excel to find appropriate summary statistics for your
sample,. You should paste both into word, you do not need the excel file.
This pivot table must have the number of people that answer yes and the number of
people that answer no
Solution
Row Labels Count of do you support proposed change?
No 71
Yes 124
Grand Total 195
b) What is sample size and the sample proportion ^p of people that support the change,
Note that ^p is the estimate for the population proportion p
Solution
^p= 124
195 =0.6359
c)
i) Find the z-score of the estimate in part (a) note that average of the estimates
0.6 is with standard deviation 0.0357
Solution
11
Document Page
z= 0.63590.6
0.0357 =1.0056
ii) Using part (i) what is P(Z<z-score) you can find out the answer using
www.wolframalpha.com
For example if the z-score is 2 then enter
P(Z<2)
into www.wolframalpha.com
Solution
P(Z< zscore)=P( Z<1.0056)=0.8427
iii) If there was a list of 1000 estimates ranked from lowest to highest, what rank
do you think your would be close to, hint just use the formula
expected rank = P(Z<z-score)*1000
Solution
Expected rank = P(Z<z-score)*1000
Expected rank = 0.8427*1000 = 843
d) Find a 95% confidence interval for the proportion of people that support the change
Solution
Confidence Interval is given as;
P ± Zα/ 2 Sp
Sp= P(1P)
n = 0.6359 (10.6359)
195 =0.034458
P ± Zα/ 2 Sp
0.6359 ± 1.96 ( 0.034458 )
0.6359 ± 0.067538
Lower limit: 0.5684
Upper limit: 0.7034
Thus the C.I: [0.5684, 0.7034]
12
chevron_up_icon
1 out of 15
circle_padding
hide_on_mobile
zoom_out_icon
[object Object]