BUS105: Statistics Computing Assignment Semester 2, 2017 Analysis
VerifiedAdded on 2020/04/07
|13
|1478
|353
Homework Assignment
AI Summary
This document presents a comprehensive solution to a BUS105 statistics computing assignment from semester 2, 2017. The assignment analyzes various datasets, including income contributions, investment risk levels, and student accommodation types. It involves calculating z-scores, proportions, and expected ranks, along with hypothesis testing to compare investment returns and support for proposed changes. The analysis includes the use of tables, figures, and pivot tables to summarize data and draw conclusions. The document also includes a guide to summarizing datasets, detailing methods for handling categorical and numerical variables, and provides insights into interpreting statistical results and drawing meaningful conclusions from the analyzed data.

Running Head: STATISTICS
Title :BUS105 computing assignment semester 2, 2017
Name:
Student number: 11700564
Allocated sample: 165
Title :BUS105 computing assignment semester 2, 2017
Name:
Student number: 11700564
Allocated sample: 165
Paraphrase This Document
Need a fresh take? Get an instant paraphrase of this document with our AI Paraphraser
1STATISTICS
Table of Contents
Section 1..........................................................................................................................................3
Part A...........................................................................................................................................3
Part B............................................................................................................................................3
Part C............................................................................................................................................3
Part D...........................................................................................................................................3
Part E............................................................................................................................................4
Section 2..........................................................................................................................................4
Part A...........................................................................................................................................4
Part B............................................................................................................................................5
Part C............................................................................................................................................5
Part D...........................................................................................................................................5
Part i.........................................................................................................................................5
Part ii........................................................................................................................................5
Part iii.......................................................................................................................................6
Part iv.......................................................................................................................................6
Part E............................................................................................................................................6
Part i.........................................................................................................................................6
Part ii........................................................................................................................................6
Part iii.......................................................................................................................................7
Part iv.......................................................................................................................................7
Section 3..........................................................................................................................................7
Part A...........................................................................................................................................7
Part B............................................................................................................................................7
Part C............................................................................................................................................7
Part D...........................................................................................................................................8
Part i.........................................................................................................................................8
Part ii........................................................................................................................................8
Part iii.......................................................................................................................................8
2STATISTICS
Part iv.......................................................................................................................................8
Part E............................................................................................................................................8
Part i.........................................................................................................................................8
Part ii........................................................................................................................................9
Part iii.......................................................................................................................................9
Part iv.......................................................................................................................................9
Section 4..........................................................................................................................................9
Part A...........................................................................................................................................9
Part B............................................................................................................................................9
Part C..........................................................................................................................................10
Part i.......................................................................................................................................10
Part ii......................................................................................................................................10
Part iii.....................................................................................................................................10
Part D.........................................................................................................................................10
Section 5........................................................................................................................................11
Section 6........................................................................................................................................11
⊘ This is a preview!⊘
Do you want full access?
Subscribe today to unlock all pages.
Trusted by 1+ million students worldwide
3STATISTICS
Section 1
Part A
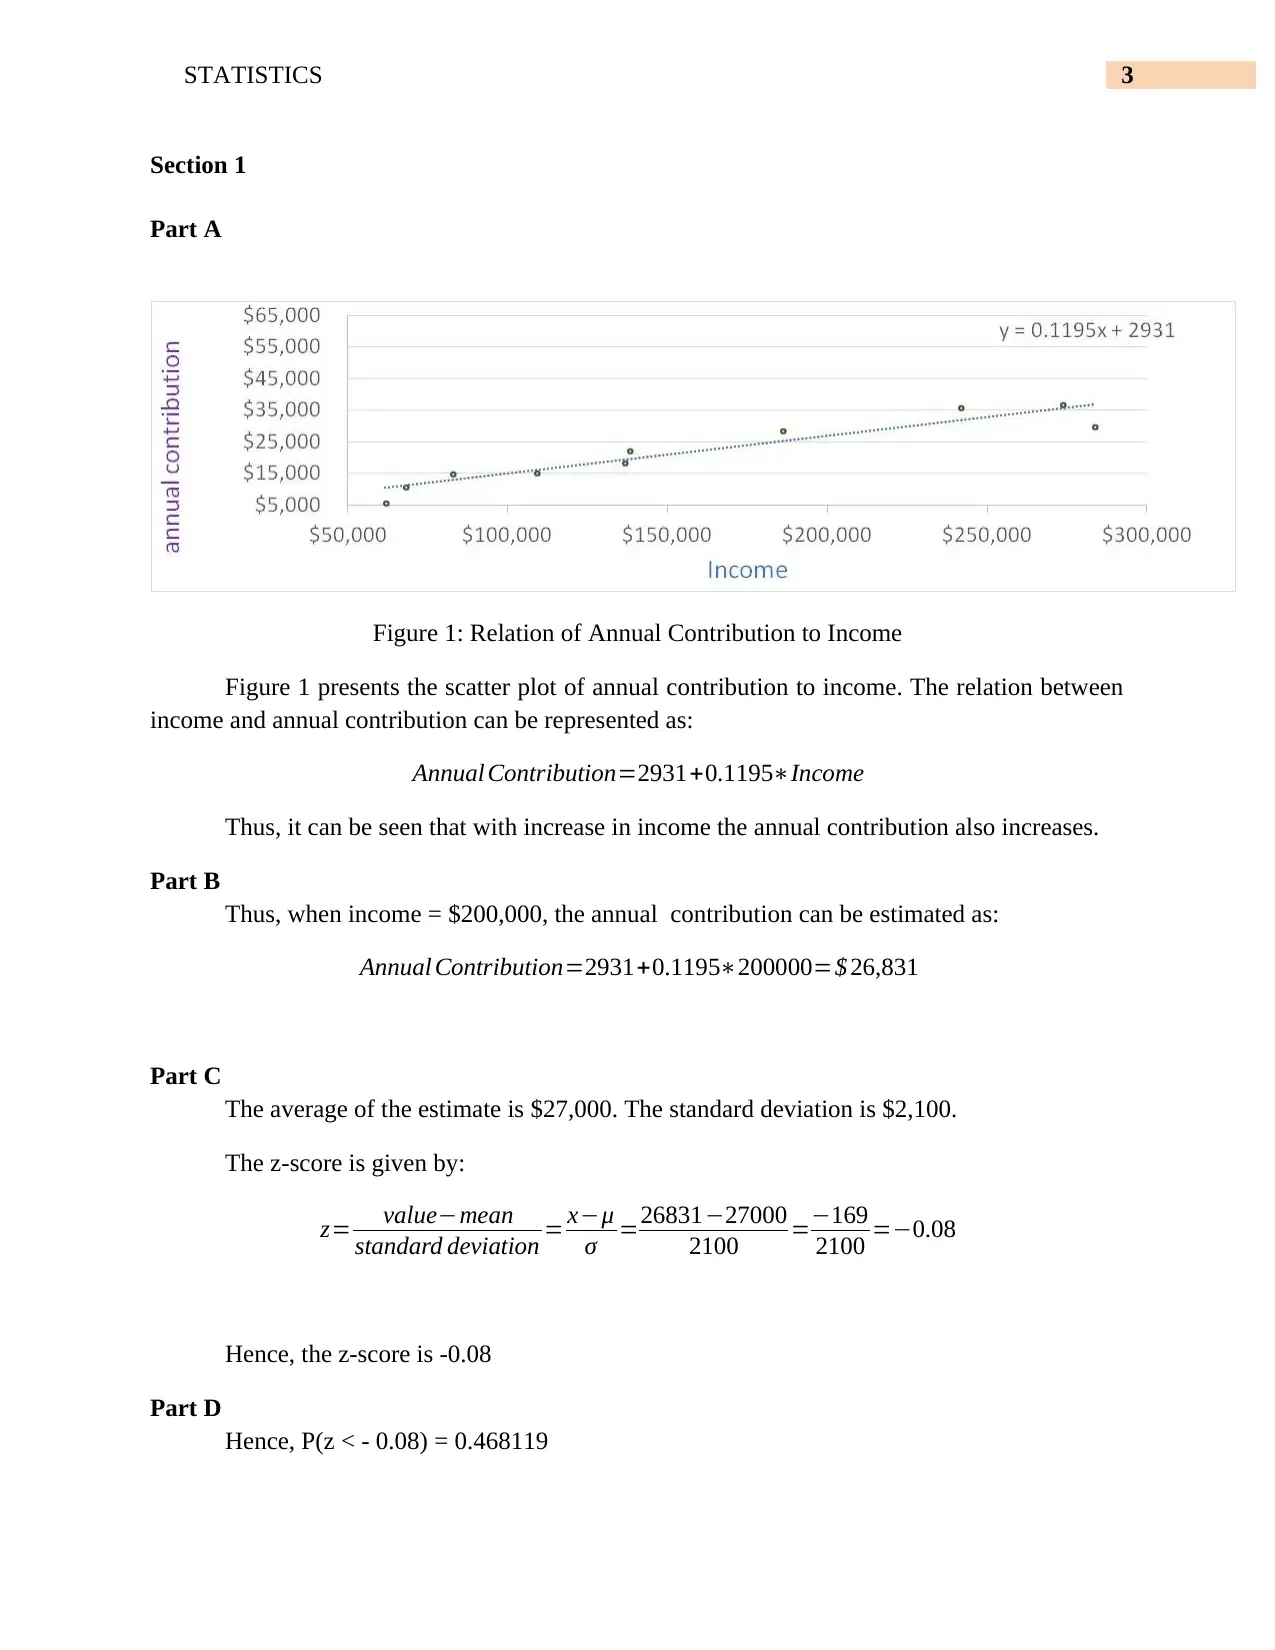
Figure 1: Relation of Annual Contribution to Income
Figure 1 presents the scatter plot of annual contribution to income. The relation between
income and annual contribution can be represented as:
Annual Contribution=2931+0.1195∗Income
Thus, it can be seen that with increase in income the annual contribution also increases.
Part B
Thus, when income = $200,000, the annual contribution can be estimated as:
Annual Contribution=2931+0.1195∗200000=$ 26,831
Part C
The average of the estimate is $27,000. The standard deviation is $2,100.
The z-score is given by:
z= value−mean
standard deviation = x−μ
σ =26831−27000
2100 =−169
2100 =−0.08
Hence, the z-score is -0.08
Part D
Hence, P(z < - 0.08) = 0.468119
Section 1
Part A
Figure 1: Relation of Annual Contribution to Income
Figure 1 presents the scatter plot of annual contribution to income. The relation between
income and annual contribution can be represented as:
Annual Contribution=2931+0.1195∗Income
Thus, it can be seen that with increase in income the annual contribution also increases.
Part B
Thus, when income = $200,000, the annual contribution can be estimated as:
Annual Contribution=2931+0.1195∗200000=$ 26,831
Part C
The average of the estimate is $27,000. The standard deviation is $2,100.
The z-score is given by:
z= value−mean
standard deviation = x−μ
σ =26831−27000
2100 =−169
2100 =−0.08
Hence, the z-score is -0.08
Part D
Hence, P(z < - 0.08) = 0.468119
Paraphrase This Document
Need a fresh take? Get an instant paraphrase of this document with our AI Paraphraser
4STATISTICS
Part E
Thus, the Expected Rank = P(z < -0.08) *10,000 = 0.468119*10,000 = 4681.19
Thus, the expected rank = 4681
Section 2
Part A
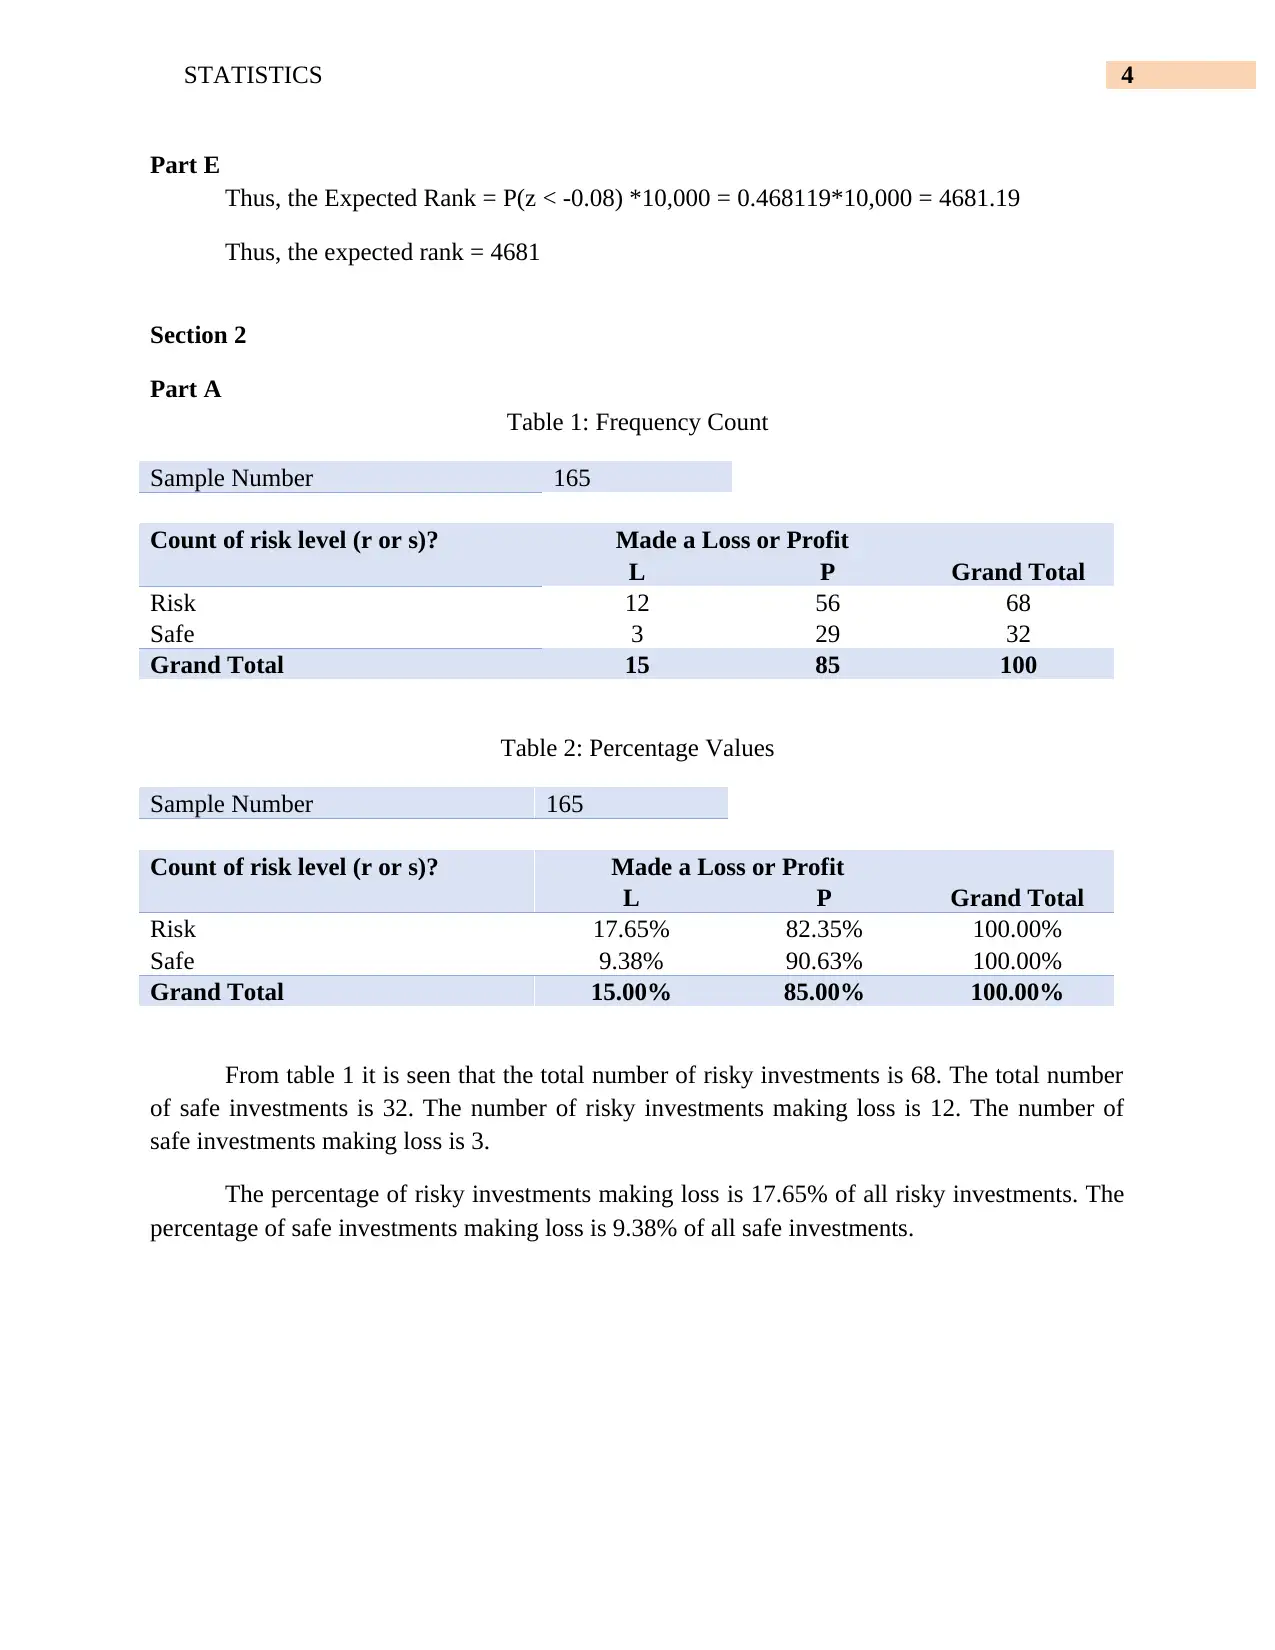
Table 1: Frequency Count
Sample Number 165
Count of risk level (r or s)? Made a Loss or Profit
L P Grand Total
Risk 12 56 68
Safe 3 29 32
Grand Total 15 85 100
Table 2: Percentage Values
Sample Number 165
Count of risk level (r or s)? Made a Loss or Profit
L P Grand Total
Risk 17.65% 82.35% 100.00%
Safe 9.38% 90.63% 100.00%
Grand Total 15.00% 85.00% 100.00%
From table 1 it is seen that the total number of risky investments is 68. The total number
of safe investments is 32. The number of risky investments making loss is 12. The number of
safe investments making loss is 3.
The percentage of risky investments making loss is 17.65% of all risky investments. The
percentage of safe investments making loss is 9.38% of all safe investments.
Part E
Thus, the Expected Rank = P(z < -0.08) *10,000 = 0.468119*10,000 = 4681.19
Thus, the expected rank = 4681
Section 2
Part A
Table 1: Frequency Count
Sample Number 165
Count of risk level (r or s)? Made a Loss or Profit
L P Grand Total
Risk 12 56 68
Safe 3 29 32
Grand Total 15 85 100
Table 2: Percentage Values
Sample Number 165
Count of risk level (r or s)? Made a Loss or Profit
L P Grand Total
Risk 17.65% 82.35% 100.00%
Safe 9.38% 90.63% 100.00%
Grand Total 15.00% 85.00% 100.00%
From table 1 it is seen that the total number of risky investments is 68. The total number
of safe investments is 32. The number of risky investments making loss is 12. The number of
safe investments making loss is 3.
The percentage of risky investments making loss is 17.65% of all risky investments. The
percentage of safe investments making loss is 9.38% of all safe investments.
5STATISTICS
Part B
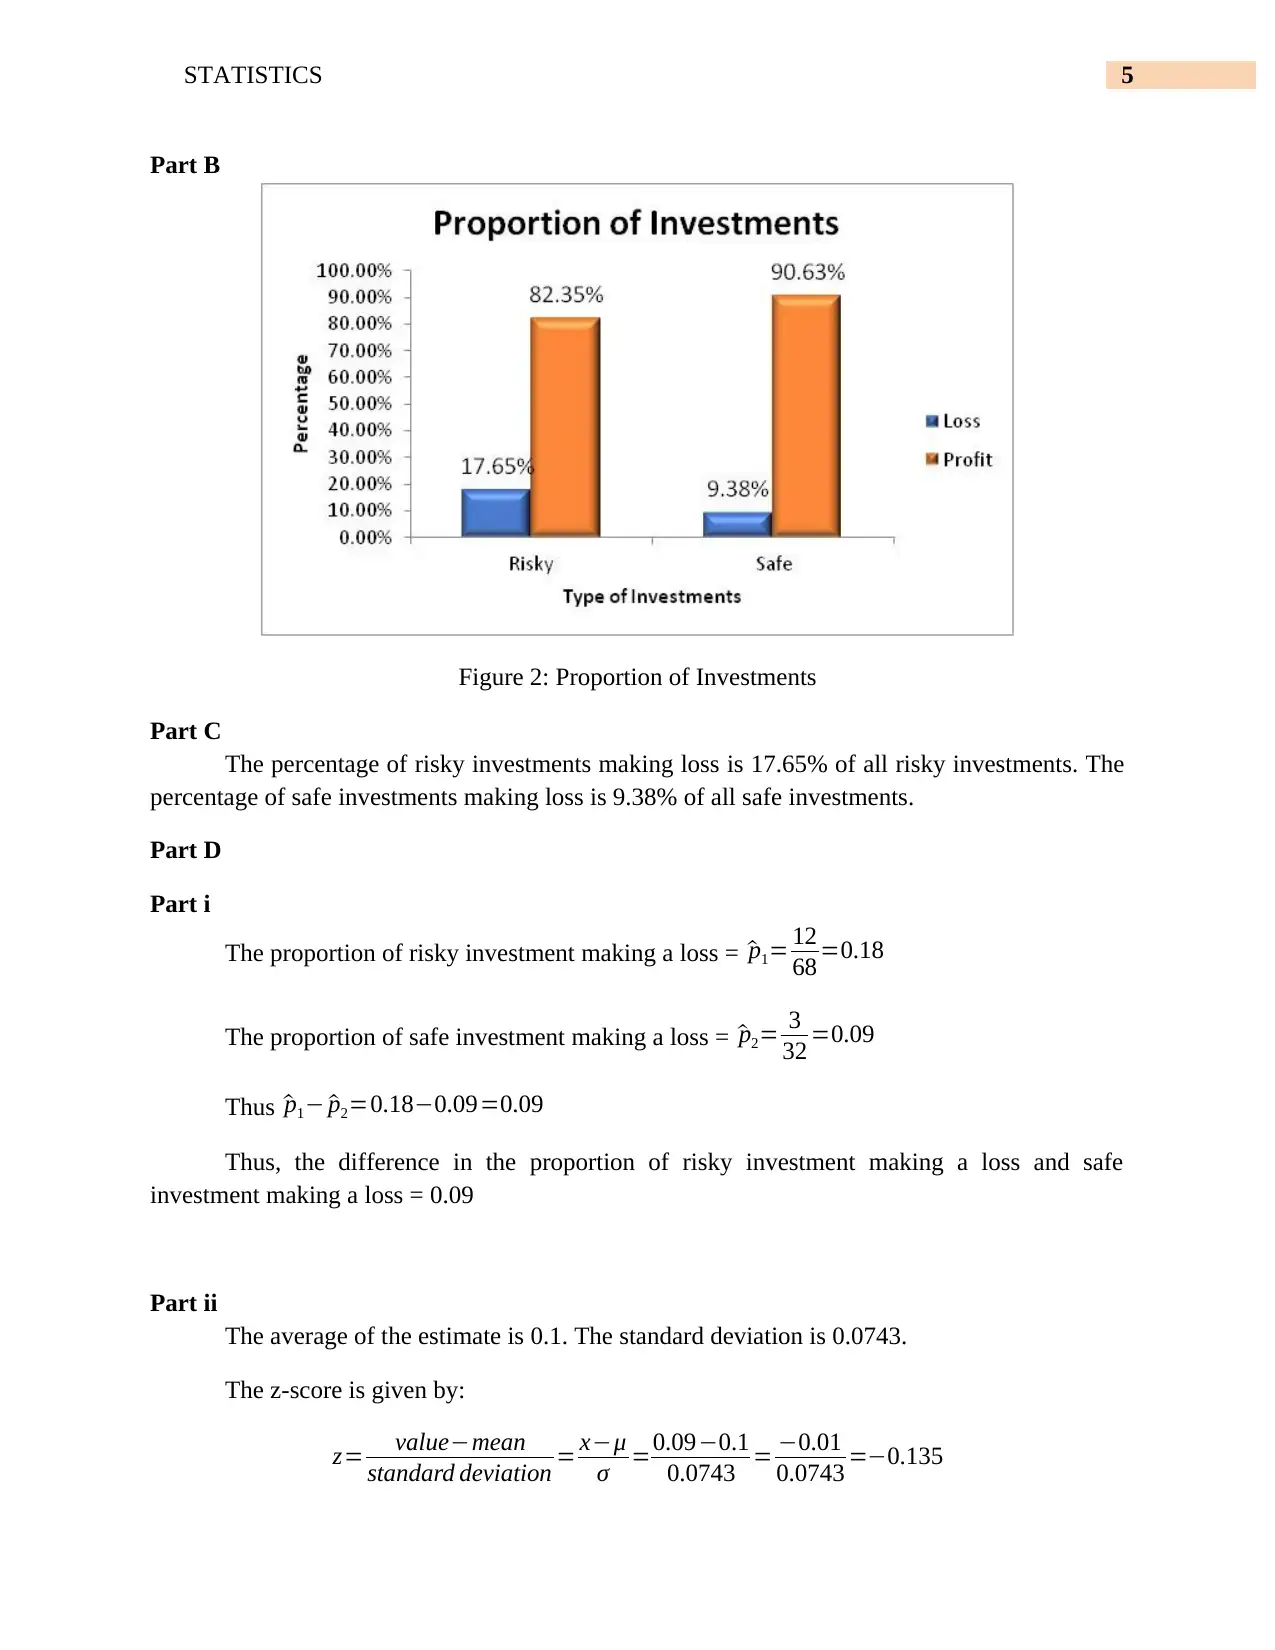
Figure 2: Proportion of Investments
Part C
The percentage of risky investments making loss is 17.65% of all risky investments. The
percentage of safe investments making loss is 9.38% of all safe investments.
Part D
Part i
The proportion of risky investment making a loss = ^p1= 12
68 =0.18
The proportion of safe investment making a loss = ^p2= 3
32 =0.09
Thus ^p1− ^p2=0.18−0.09=0.09
Thus, the difference in the proportion of risky investment making a loss and safe
investment making a loss = 0.09
Part ii
The average of the estimate is 0.1. The standard deviation is 0.0743.
The z-score is given by:
z= value−mean
standard deviation = x−μ
σ =0.09−0.1
0.0743 = −0.01
0.0743 =−0.135
Part B
Figure 2: Proportion of Investments
Part C
The percentage of risky investments making loss is 17.65% of all risky investments. The
percentage of safe investments making loss is 9.38% of all safe investments.
Part D
Part i
The proportion of risky investment making a loss = ^p1= 12
68 =0.18
The proportion of safe investment making a loss = ^p2= 3
32 =0.09
Thus ^p1− ^p2=0.18−0.09=0.09
Thus, the difference in the proportion of risky investment making a loss and safe
investment making a loss = 0.09
Part ii
The average of the estimate is 0.1. The standard deviation is 0.0743.
The z-score is given by:
z= value−mean
standard deviation = x−μ
σ =0.09−0.1
0.0743 = −0.01
0.0743 =−0.135
⊘ This is a preview!⊘
Do you want full access?
Subscribe today to unlock all pages.
Trusted by 1+ million students worldwide
6STATISTICS
Thus the z-score is -0.135
Part iii
Hence, P(z < -0.135) = 0.446306
Part iv
Hence, Expected Rank = P(z < -0.135) = 0.446306*4000 = 1785.224 ≈ 1785
Hence, expected Rank = 1785.
Part E
Part i
The hypothesis:
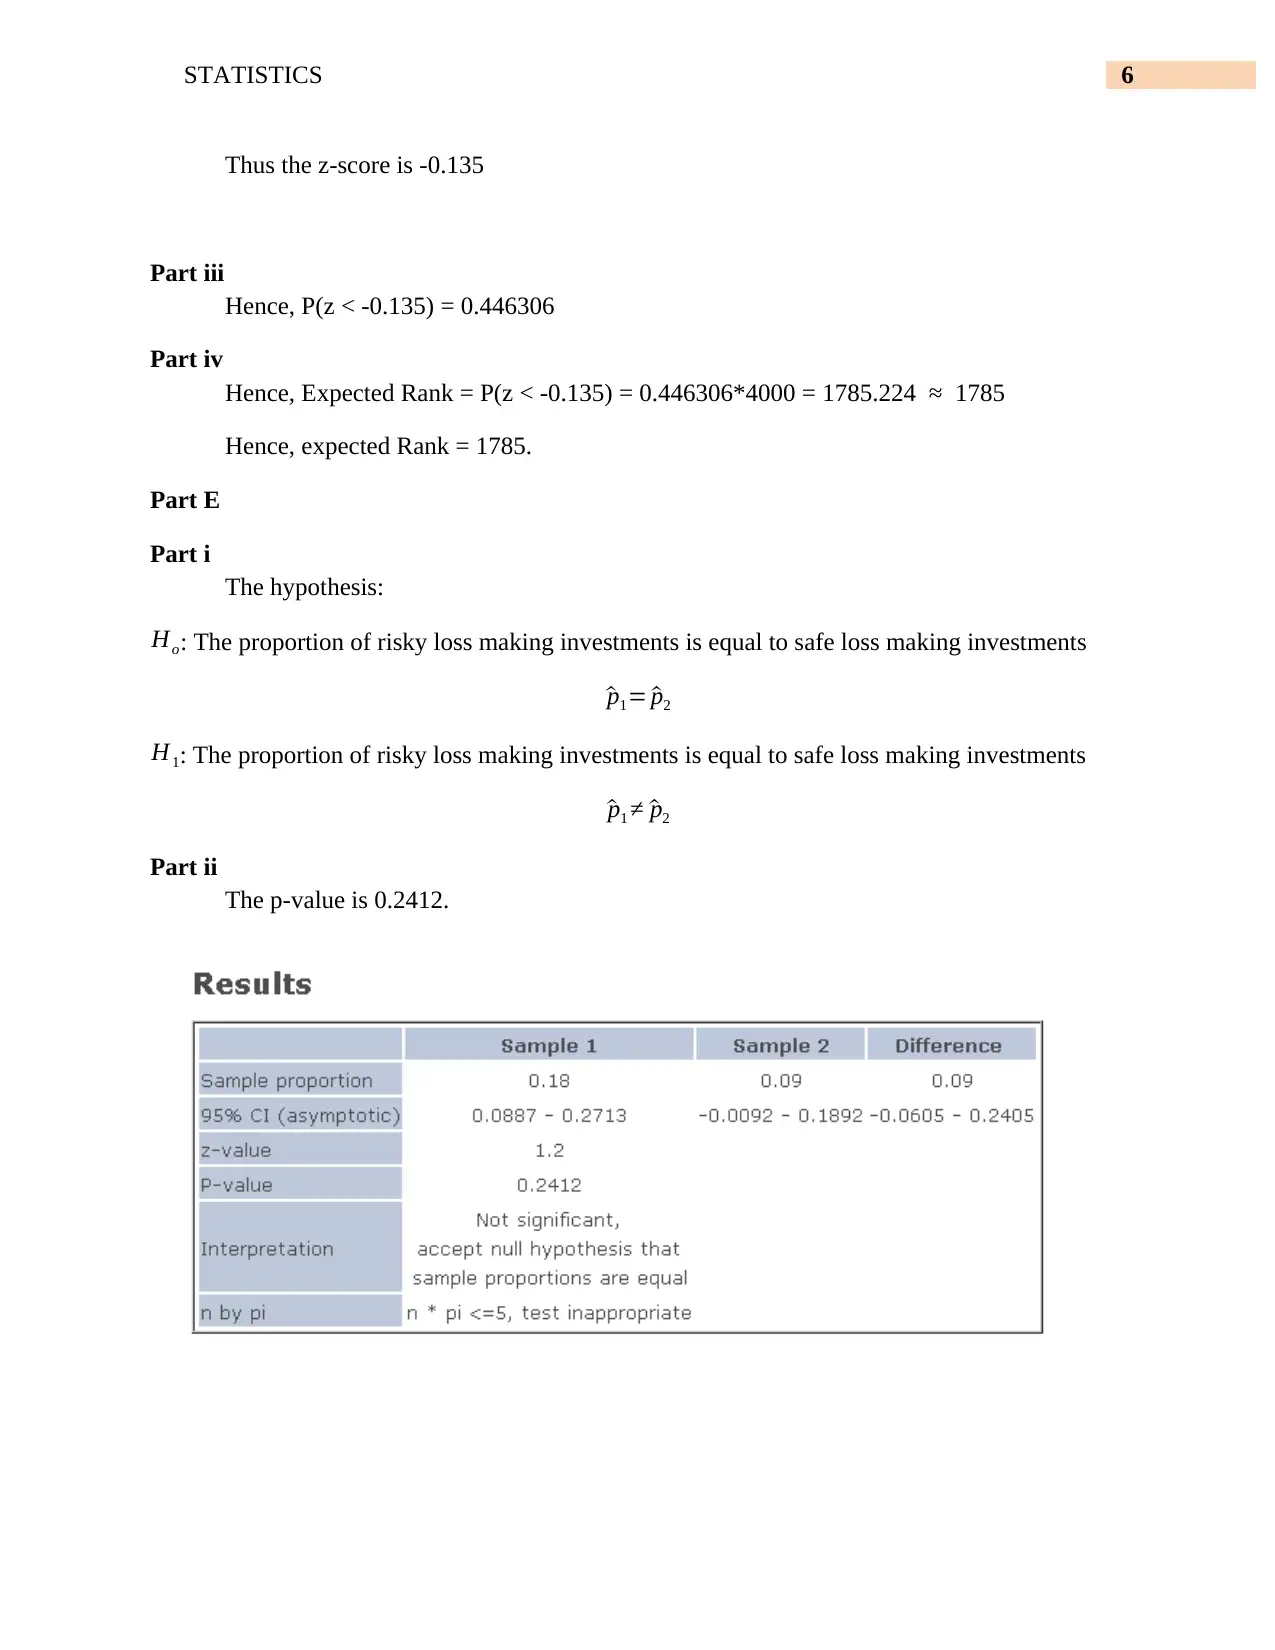
Ho: The proportion of risky loss making investments is equal to safe loss making investments
^p1= ^p2
H1: The proportion of risky loss making investments is equal to safe loss making investments
^p1 ≠ ^p2
Part ii
The p-value is 0.2412.
Thus the z-score is -0.135
Part iii
Hence, P(z < -0.135) = 0.446306
Part iv
Hence, Expected Rank = P(z < -0.135) = 0.446306*4000 = 1785.224 ≈ 1785
Hence, expected Rank = 1785.
Part E
Part i
The hypothesis:
Ho: The proportion of risky loss making investments is equal to safe loss making investments
^p1= ^p2
H1: The proportion of risky loss making investments is equal to safe loss making investments
^p1 ≠ ^p2
Part ii
The p-value is 0.2412.
Paraphrase This Document
Need a fresh take? Get an instant paraphrase of this document with our AI Paraphraser
7STATISTICS
Part iii
From, the p-value I accept the null hypothesis.
Part iv
Hence, I can say that the proportion of risky loss making investments is equal to safe loss
making investments.
Section 3
Part A
Table 3: Summary of Investments
Sample Number 165
Values
Count Count of High risk ? Average of return StdDev of return
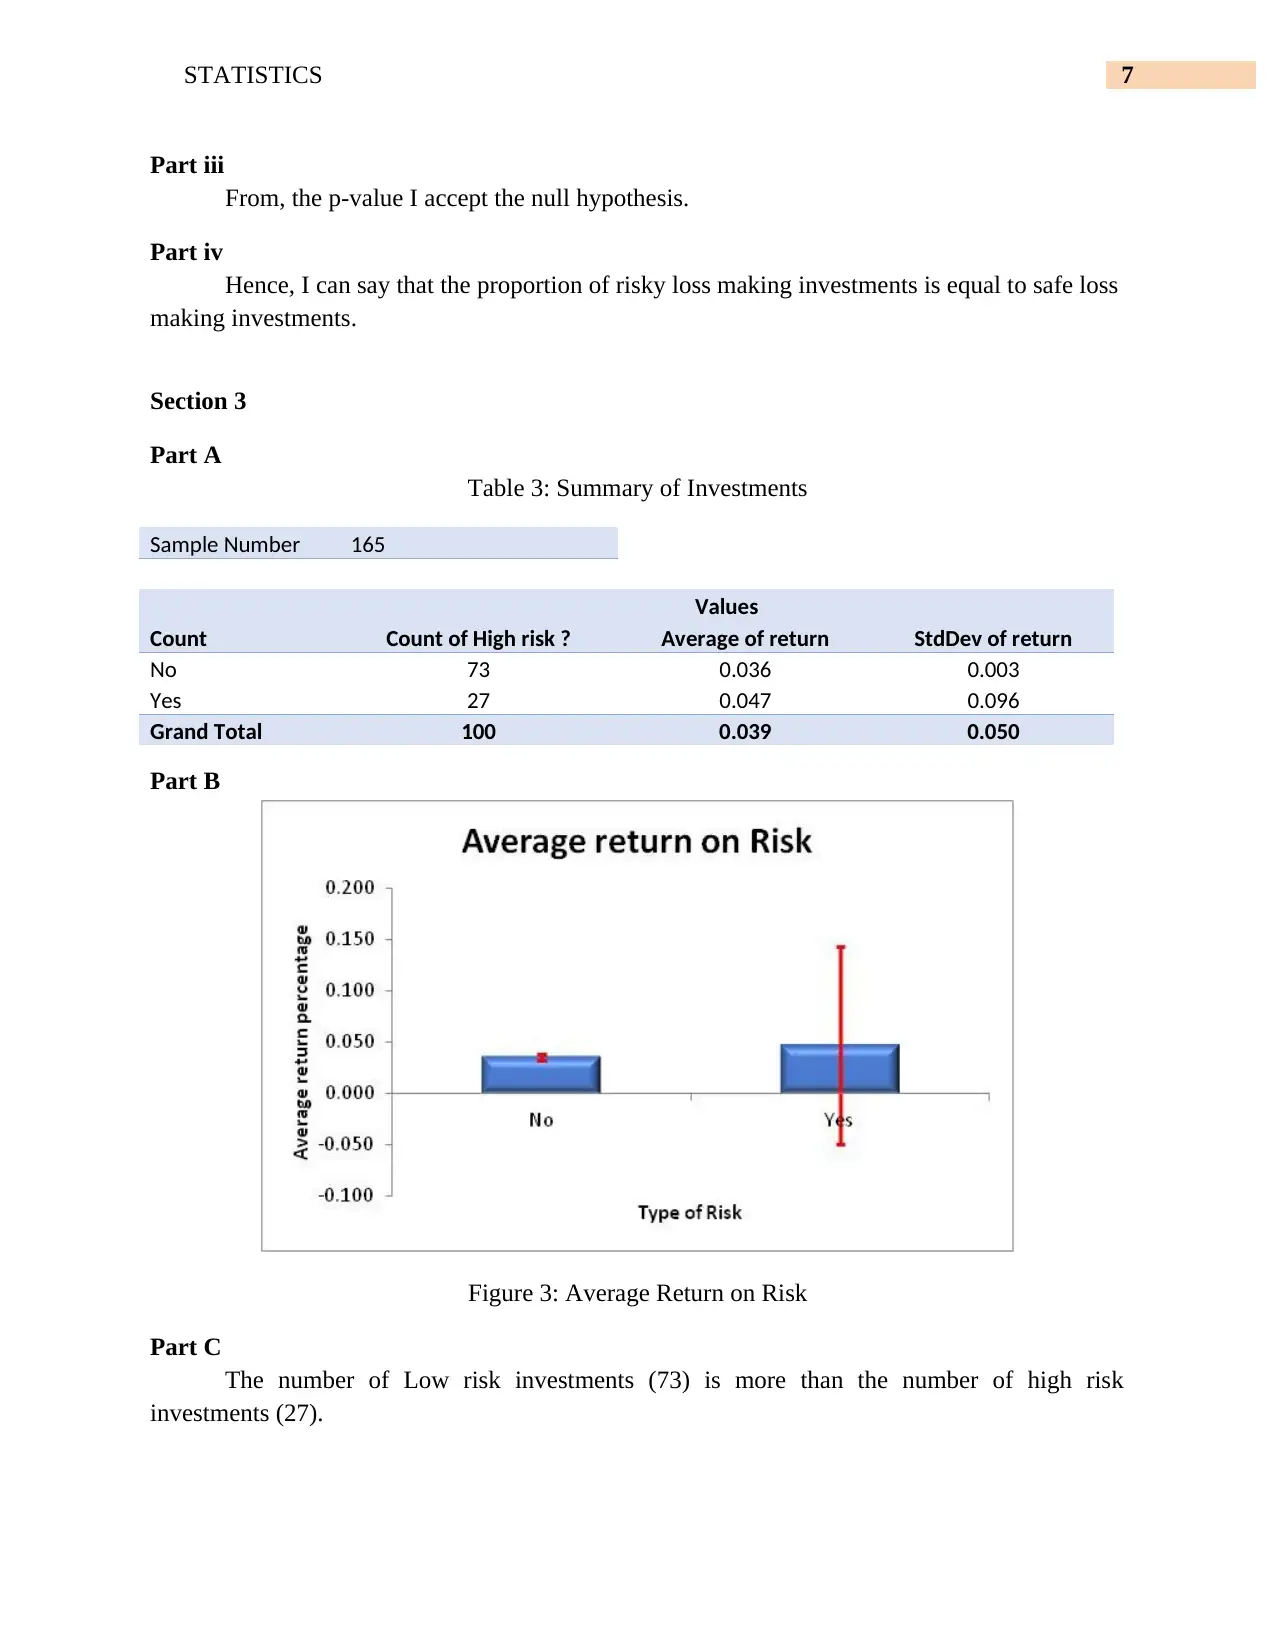
No 73 0.036 0.003
Yes 27 0.047 0.096
Grand Total 100 0.039 0.050
Part B
Figure 3: Average Return on Risk
Part C
The number of Low risk investments (73) is more than the number of high risk
investments (27).
Part iii
From, the p-value I accept the null hypothesis.
Part iv
Hence, I can say that the proportion of risky loss making investments is equal to safe loss
making investments.
Section 3
Part A
Table 3: Summary of Investments
Sample Number 165
Values
Count Count of High risk ? Average of return StdDev of return
No 73 0.036 0.003
Yes 27 0.047 0.096
Grand Total 100 0.039 0.050
Part B
Figure 3: Average Return on Risk
Part C
The number of Low risk investments (73) is more than the number of high risk
investments (27).
8STATISTICS
Part D
Part i
The sample average return on low risk investments (x1) = 0.036
The sample average return on high risk investments ( x2 ) = 0.047
The difference in sample estimate x1−x1=¿0.036 – 0.047= -0.011
Part ii
The average of the estimate is -0.0256. The standard deviation is 0.0173.
The z-score is given by:
z= value−mean
standard deviation = x−μ
σ =−0.011−(−0.0256)
0.0173 = 0.0146
0.0173
= 0.8439
Thus the z-score is 0.8439
Part iii
Thus, P(z < 0.8439) = 0.800637
Part iv
Thus, the Expected Rank = P(z < 0.8439) = 0.800637*2000 = 1601.274
Hence, expected Rank = 1601.
Part E
Part i
The hypothesis:
Ho: The average return of low risk investment is equal to the average return of high risk
investment
x1=x1
H1: The average return of low risk investment is not equal to the average return of high risk
investment
x1 ≠ x1
⊘ This is a preview!⊘
Do you want full access?
Subscribe today to unlock all pages.
Trusted by 1+ million students worldwide
9STATISTICS
Part ii
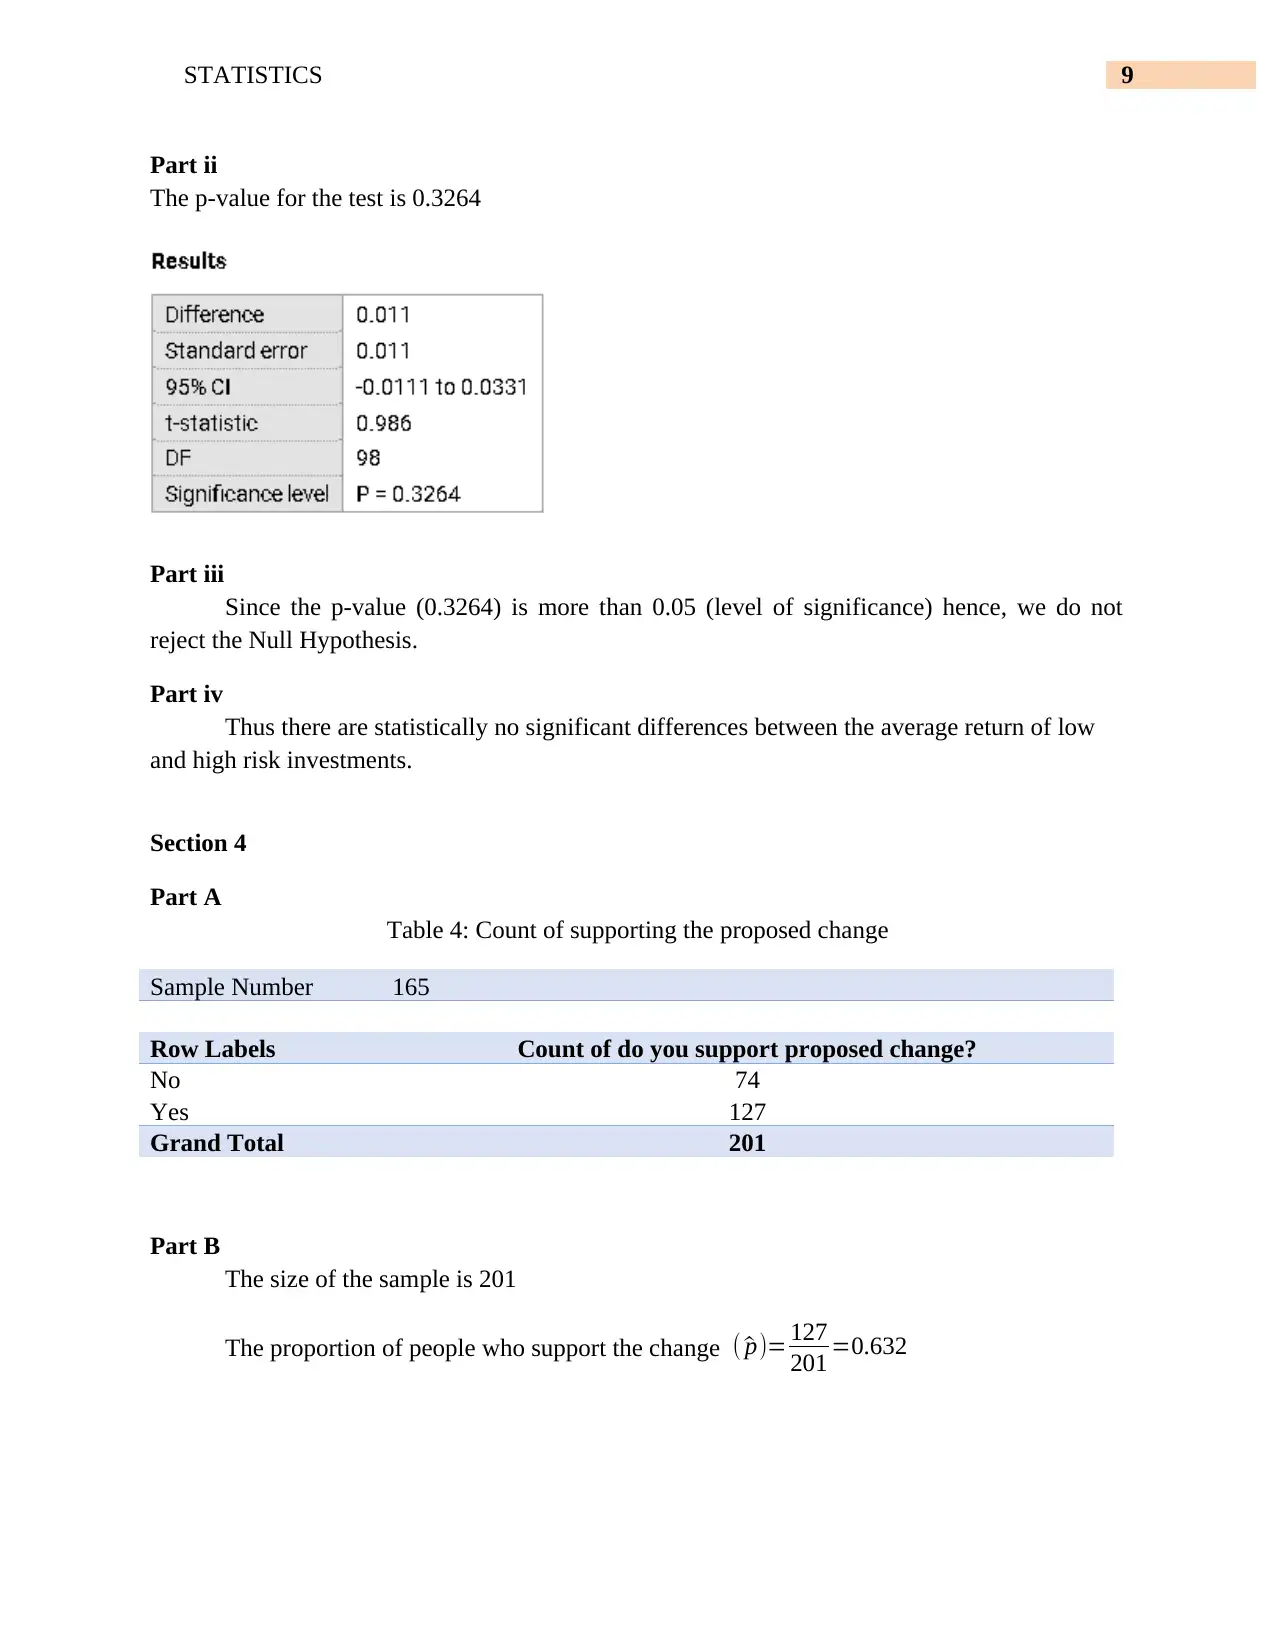
The p-value for the test is 0.3264
Part iii
Since the p-value (0.3264) is more than 0.05 (level of significance) hence, we do not
reject the Null Hypothesis.
Part iv
Thus there are statistically no significant differences between the average return of low
and high risk investments.
Section 4
Part A
Table 4: Count of supporting the proposed change
Sample Number 165
Row Labels Count of do you support proposed change?
No 74
Yes 127
Grand Total 201
Part B
The size of the sample is 201
The proportion of people who support the change ( ^p)= 127
201 =0.632
Part ii
The p-value for the test is 0.3264
Part iii
Since the p-value (0.3264) is more than 0.05 (level of significance) hence, we do not
reject the Null Hypothesis.
Part iv
Thus there are statistically no significant differences between the average return of low
and high risk investments.
Section 4
Part A
Table 4: Count of supporting the proposed change
Sample Number 165
Row Labels Count of do you support proposed change?
No 74
Yes 127
Grand Total 201
Part B
The size of the sample is 201
The proportion of people who support the change ( ^p)= 127
201 =0.632
Paraphrase This Document
Need a fresh take? Get an instant paraphrase of this document with our AI Paraphraser
10STATISTICS
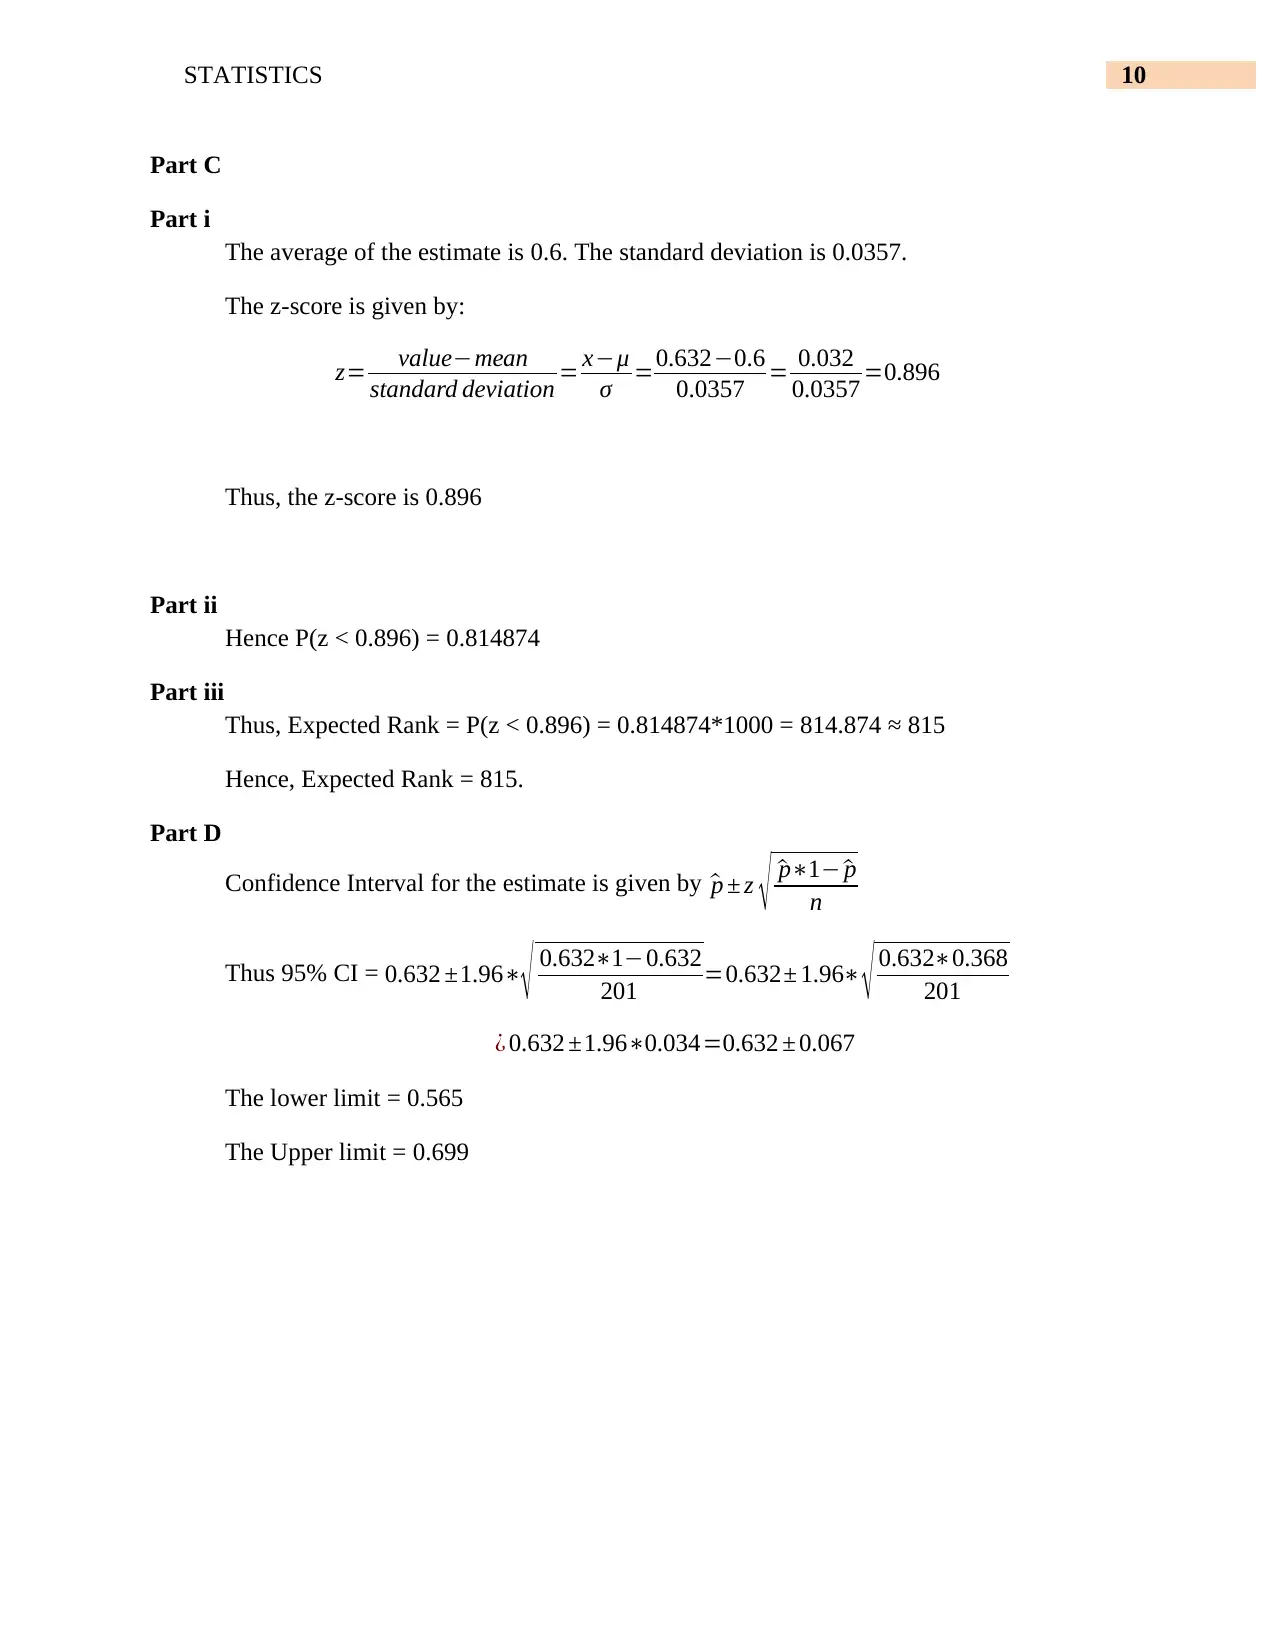
Part C
Part i
The average of the estimate is 0.6. The standard deviation is 0.0357.
The z-score is given by:
z= value−mean
standard deviation = x−μ
σ =0.632−0.6
0.0357 = 0.032
0.0357 =0.896
Thus, the z-score is 0.896
Part ii
Hence P(z < 0.896) = 0.814874
Part iii
Thus, Expected Rank = P(z < 0.896) = 0.814874*1000 = 814.874 ≈ 815
Hence, Expected Rank = 815.
Part D
Confidence Interval for the estimate is given by ^p ± z √ ^p∗1− ^p
n
Thus 95% CI = 0.632 ±1.96∗
√ 0.632∗1−0.632
201 =0.632± 1.96∗ √ 0.632∗0.368
201
¿ 0.632 ±1.96∗0.034=0.632 ± 0.067
The lower limit = 0.565
The Upper limit = 0.699
11STATISTICS
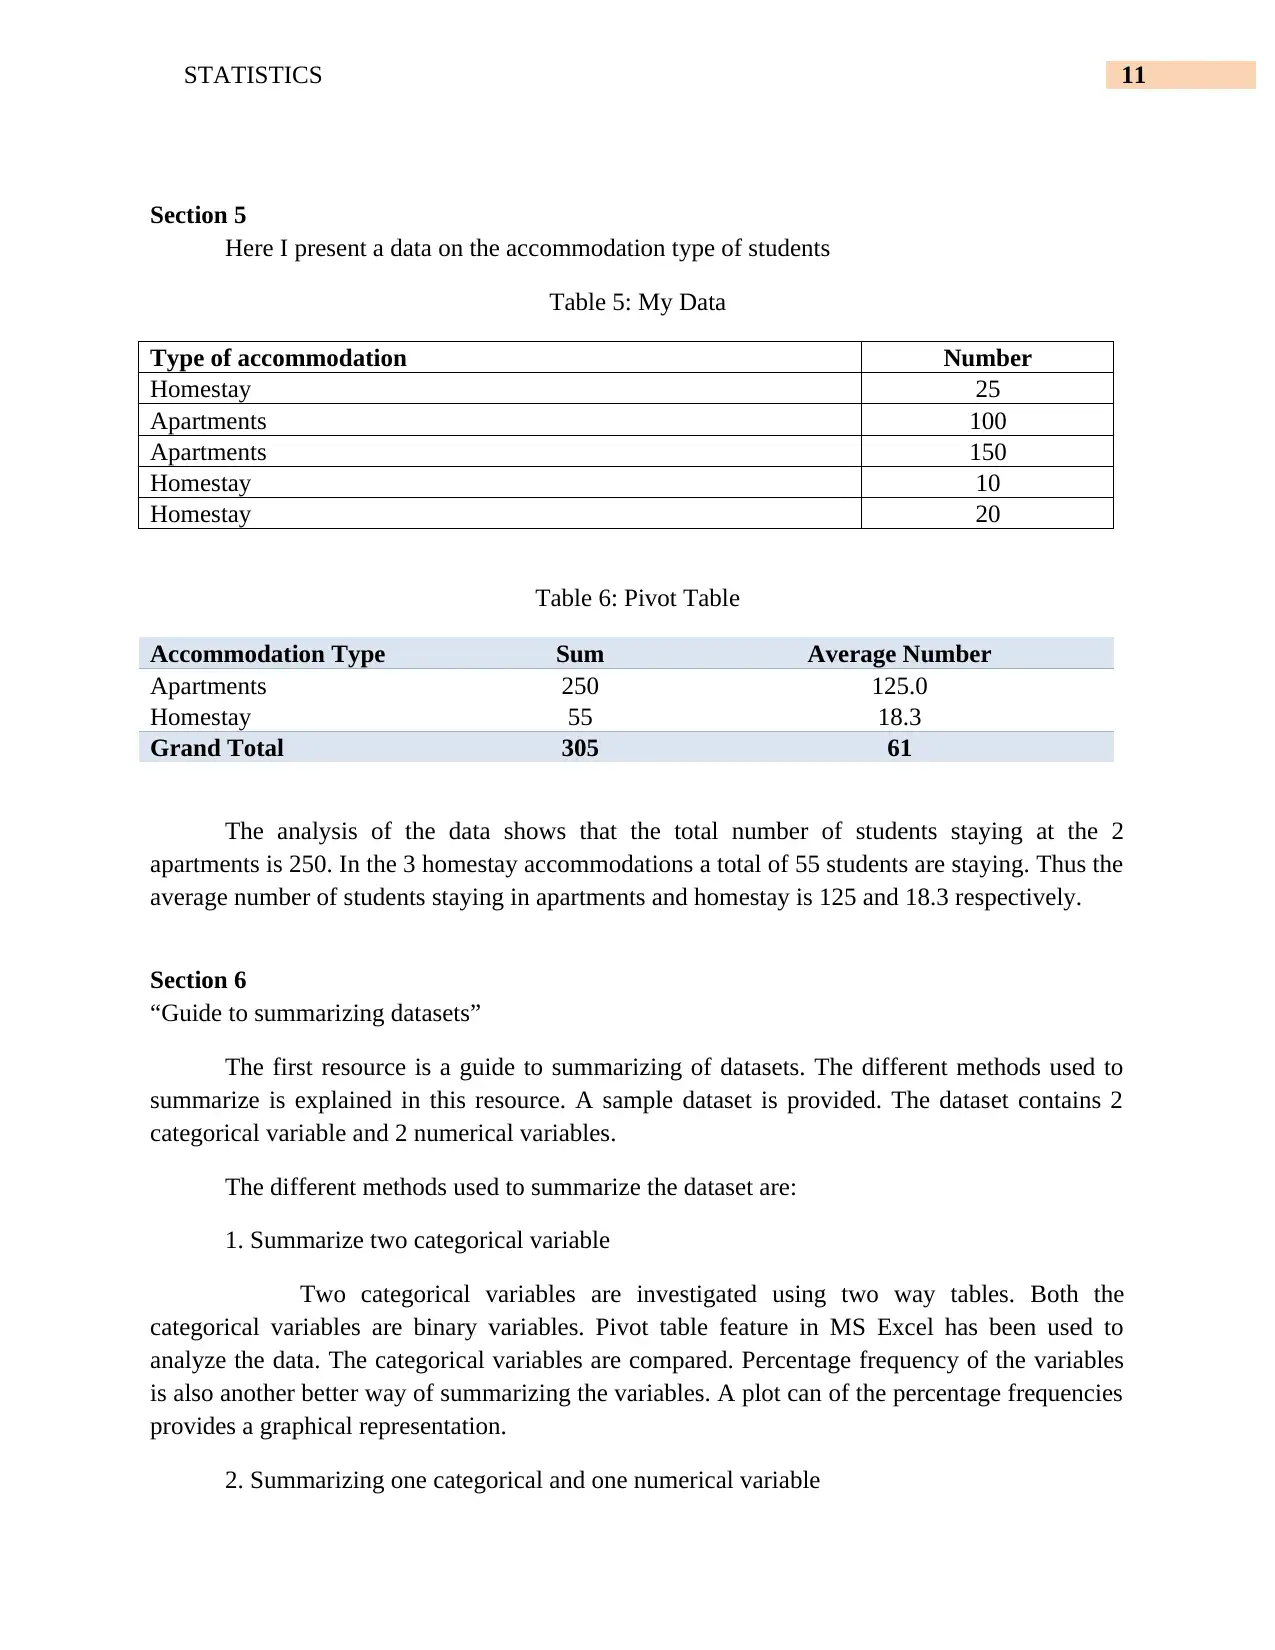
Section 5
Here I present a data on the accommodation type of students
Table 5: My Data
Type of accommodation Number
Homestay 25
Apartments 100
Apartments 150
Homestay 10
Homestay 20
Table 6: Pivot Table
Accommodation Type Sum Average Number
Apartments 250 125.0
Homestay 55 18.3
Grand Total 305 61
The analysis of the data shows that the total number of students staying at the 2
apartments is 250. In the 3 homestay accommodations a total of 55 students are staying. Thus the
average number of students staying in apartments and homestay is 125 and 18.3 respectively.
Section 6
“Guide to summarizing datasets”
The first resource is a guide to summarizing of datasets. The different methods used to
summarize is explained in this resource. A sample dataset is provided. The dataset contains 2
categorical variable and 2 numerical variables.
The different methods used to summarize the dataset are:
1. Summarize two categorical variable
Two categorical variables are investigated using two way tables. Both the
categorical variables are binary variables. Pivot table feature in MS Excel has been used to
analyze the data. The categorical variables are compared. Percentage frequency of the variables
is also another better way of summarizing the variables. A plot can of the percentage frequencies
provides a graphical representation.
2. Summarizing one categorical and one numerical variable
⊘ This is a preview!⊘
Do you want full access?
Subscribe today to unlock all pages.
Trusted by 1+ million students worldwide
1 out of 13
Related Documents


Your All-in-One AI-Powered Toolkit for Academic Success.
+13062052269
info@desklib.com
Available 24*7 on WhatsApp / Email
![[object Object]](/_next/static/media/star-bottom.7253800d.svg)
Unlock your academic potential
Copyright © 2020–2026 A2Z Services. All Rights Reserved. Developed and managed by ZUCOL.