BUS105 Statistics Assignment Report: Singapore Life Satisfaction

Verified

Added on  2022/08/15

|10
|1957
|13
Report
AI Summary
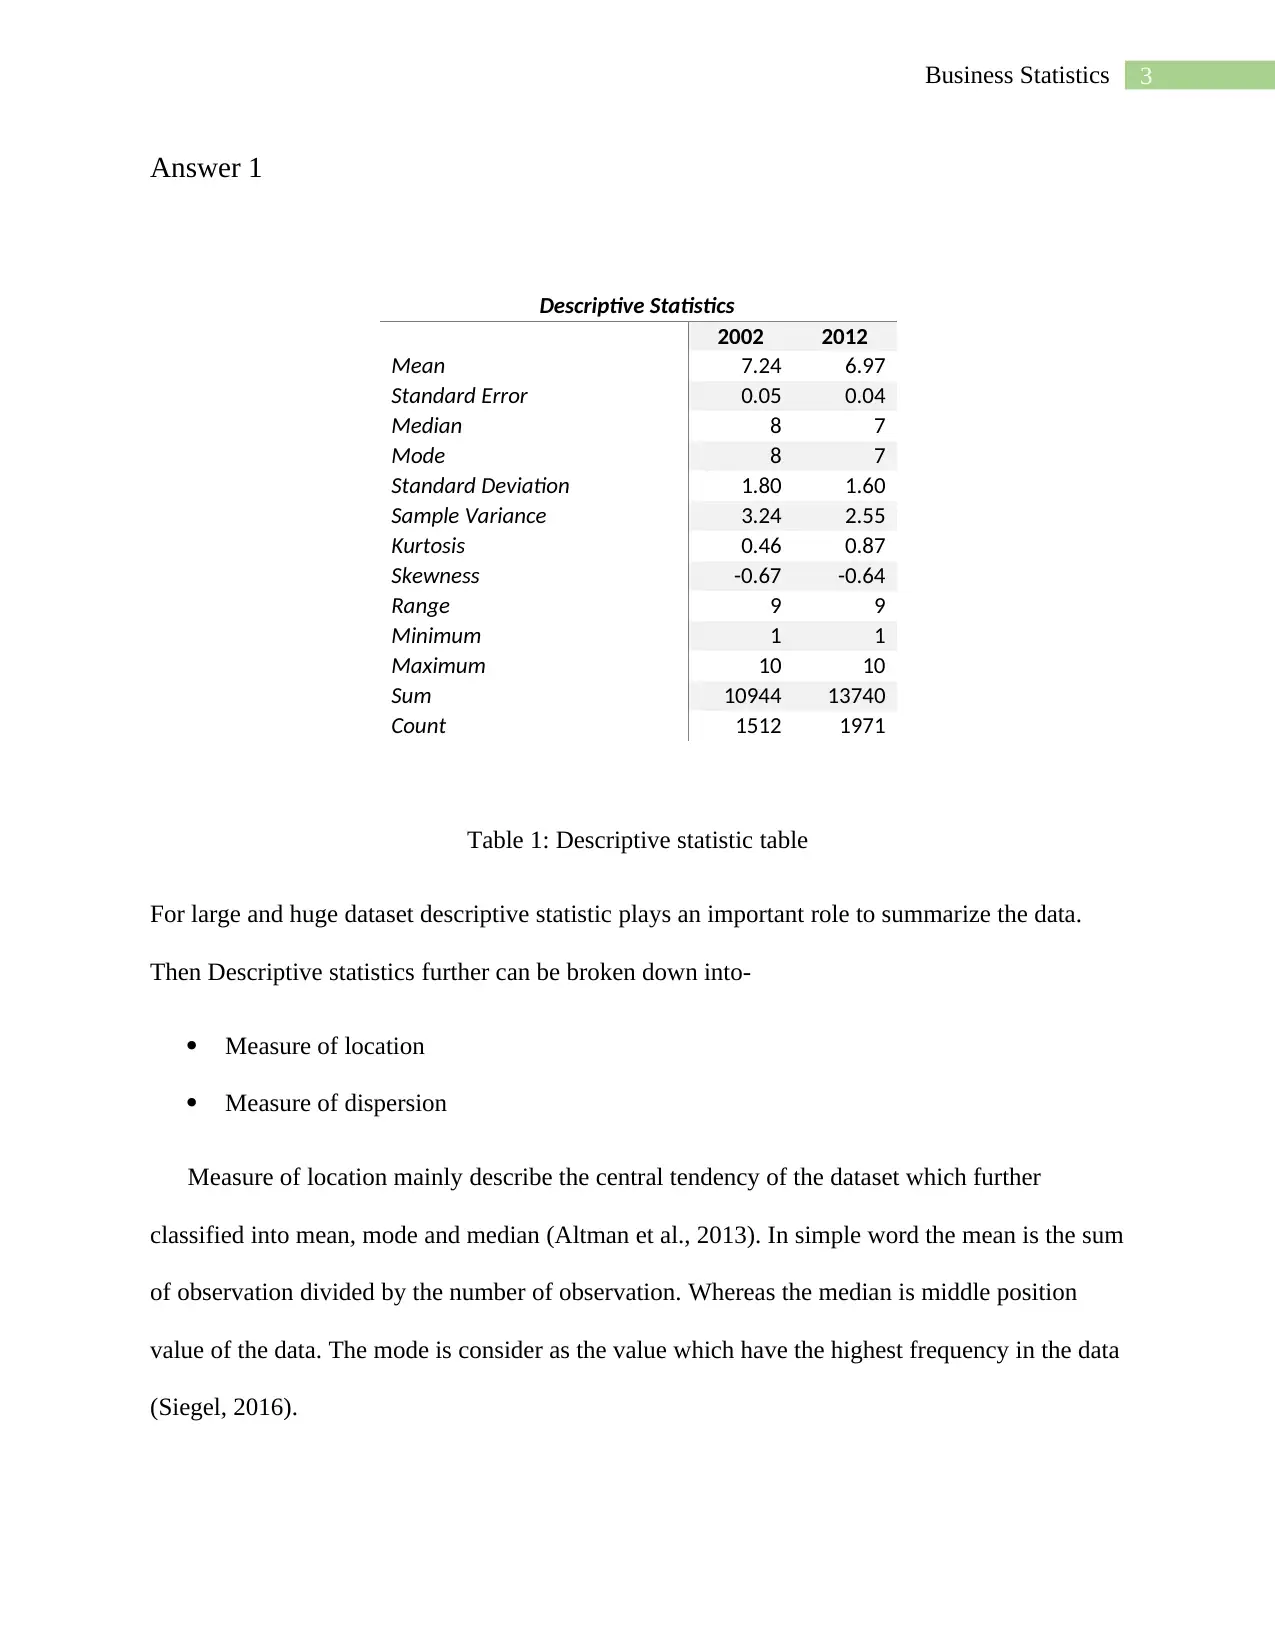
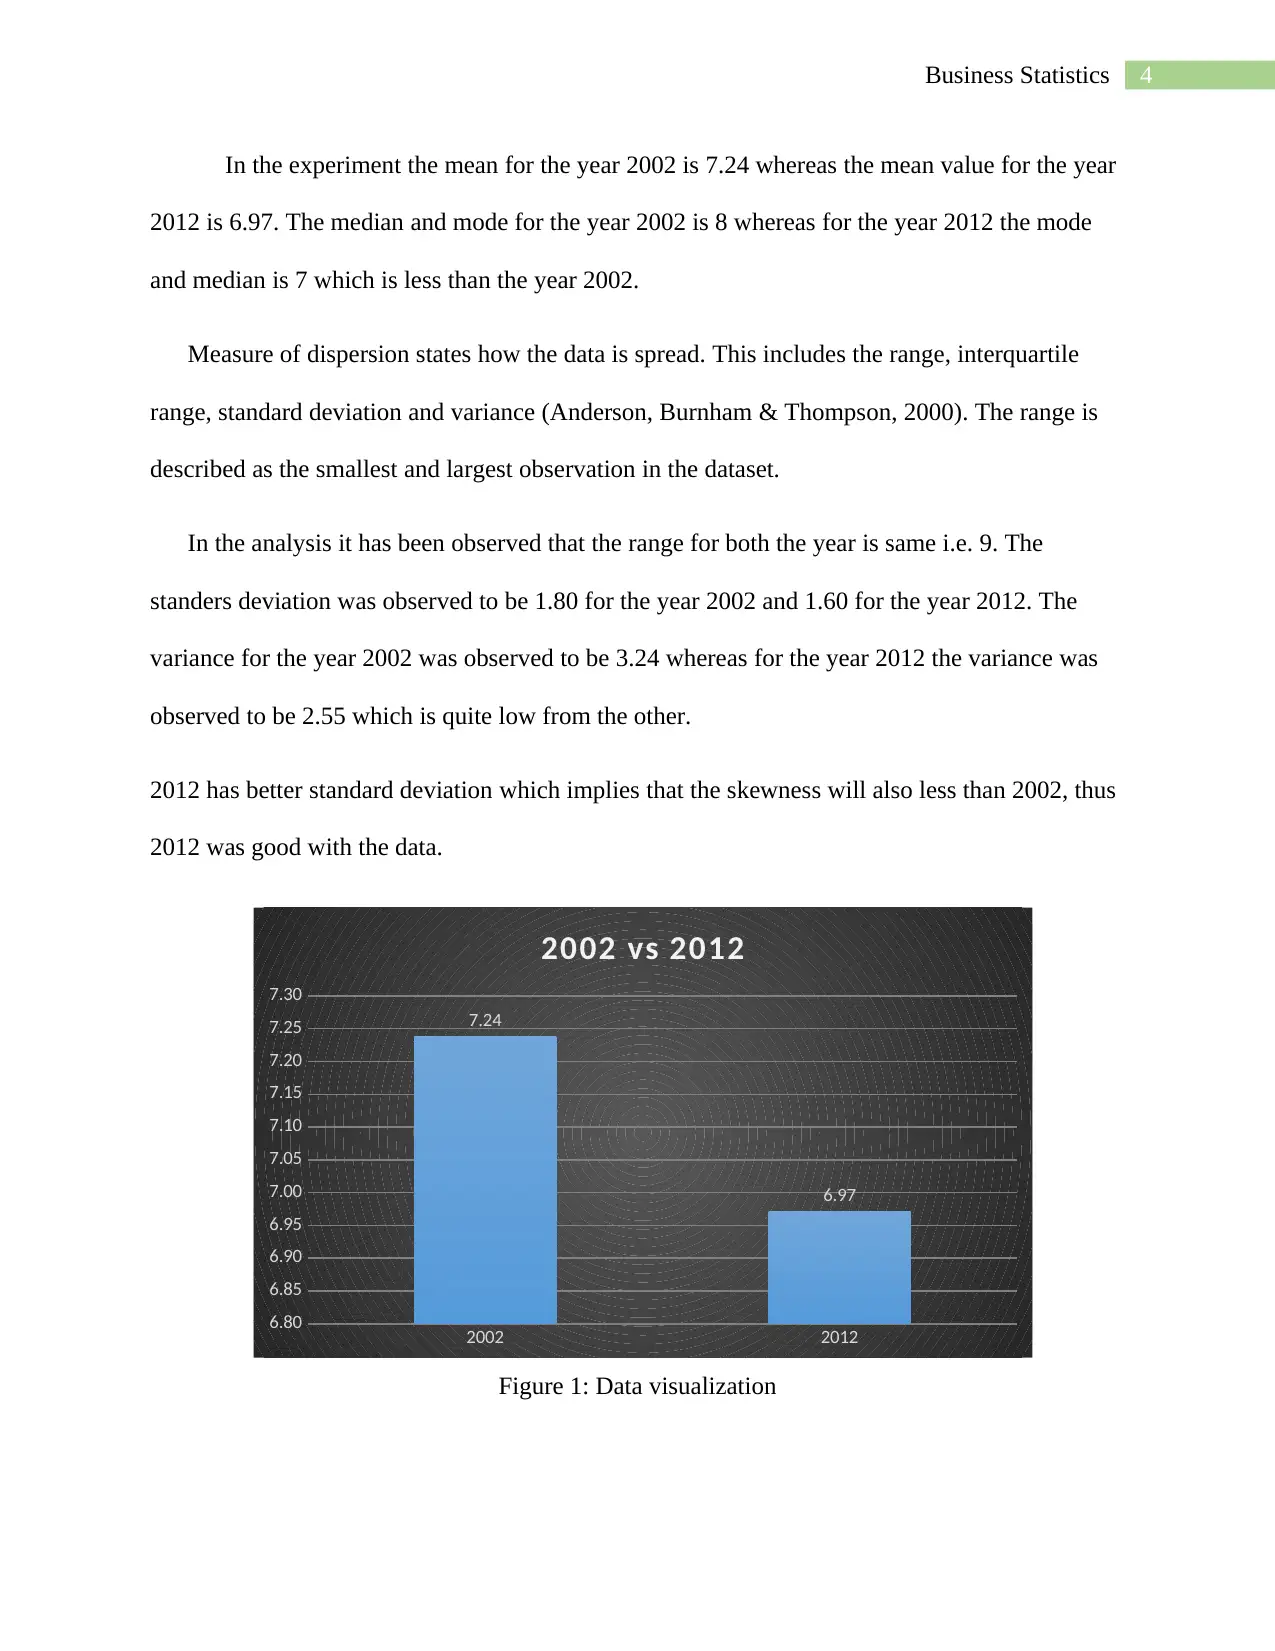
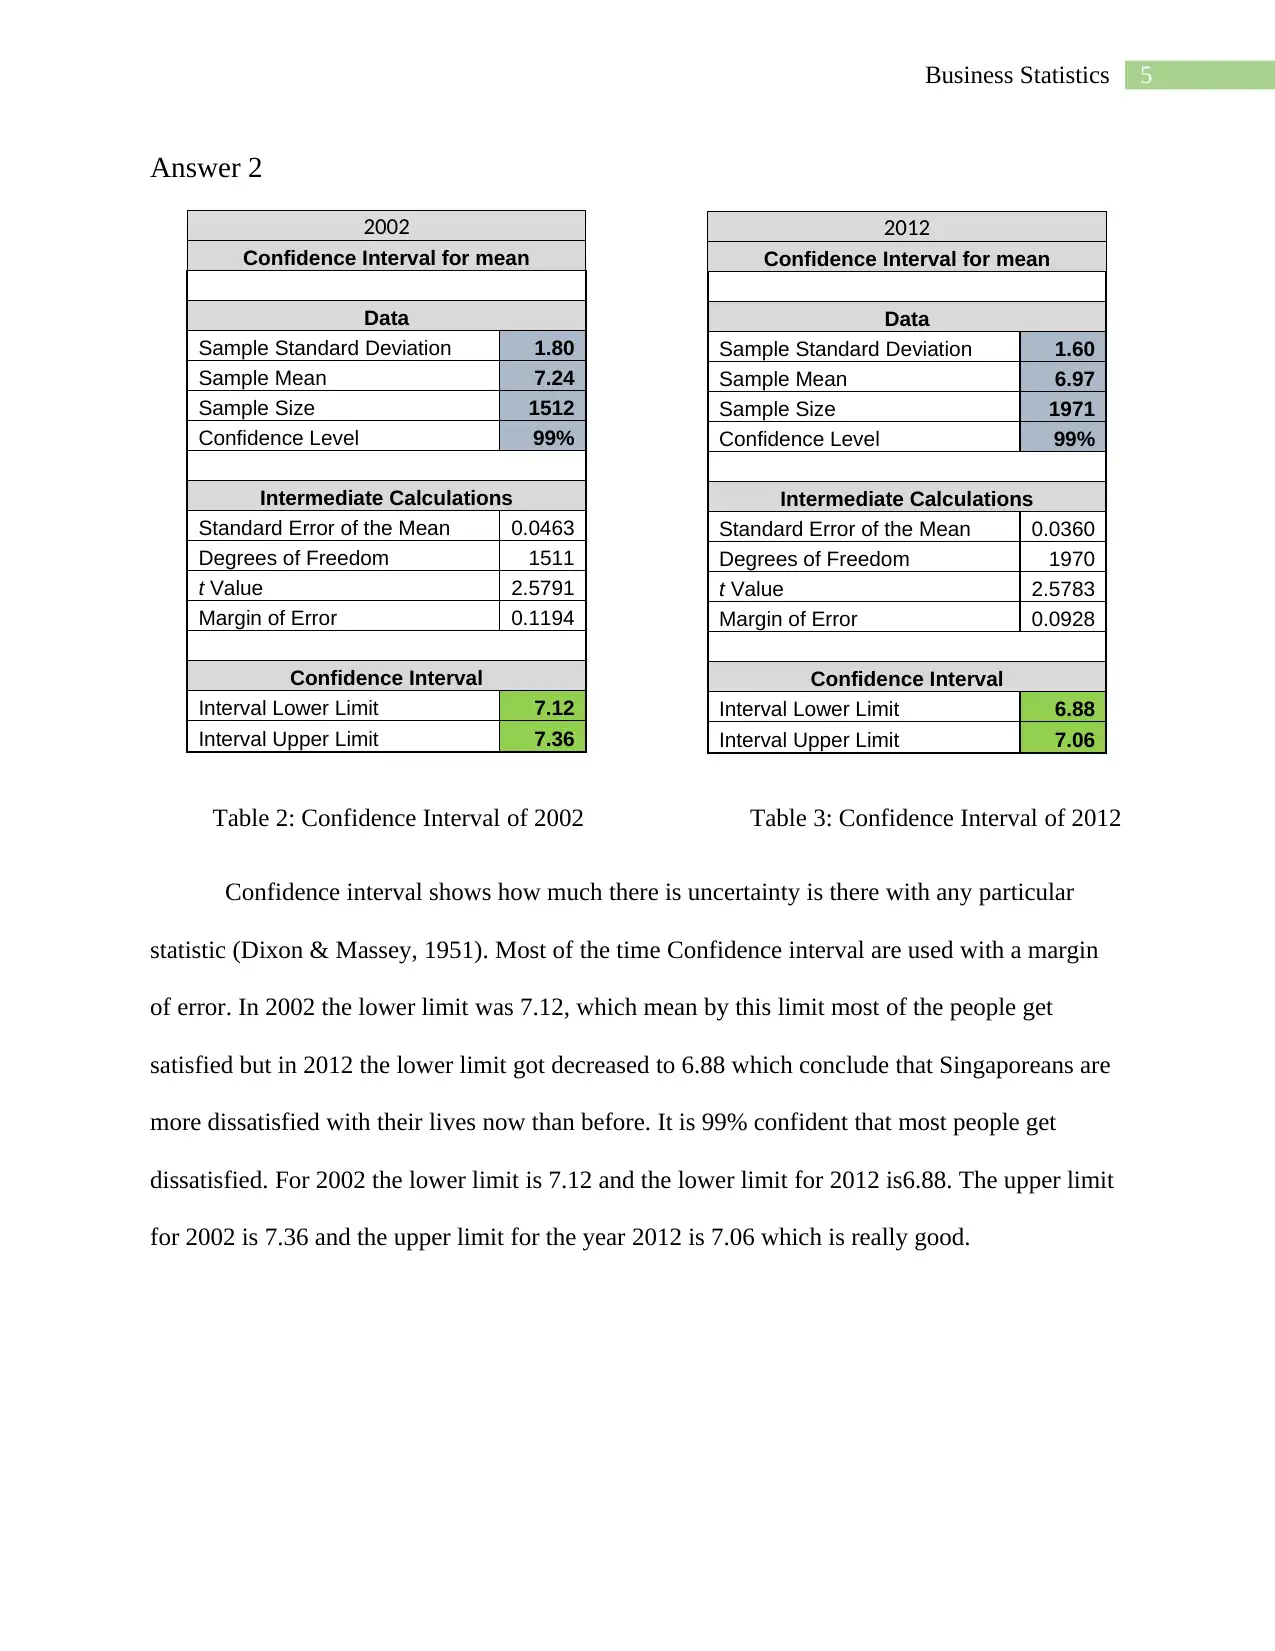
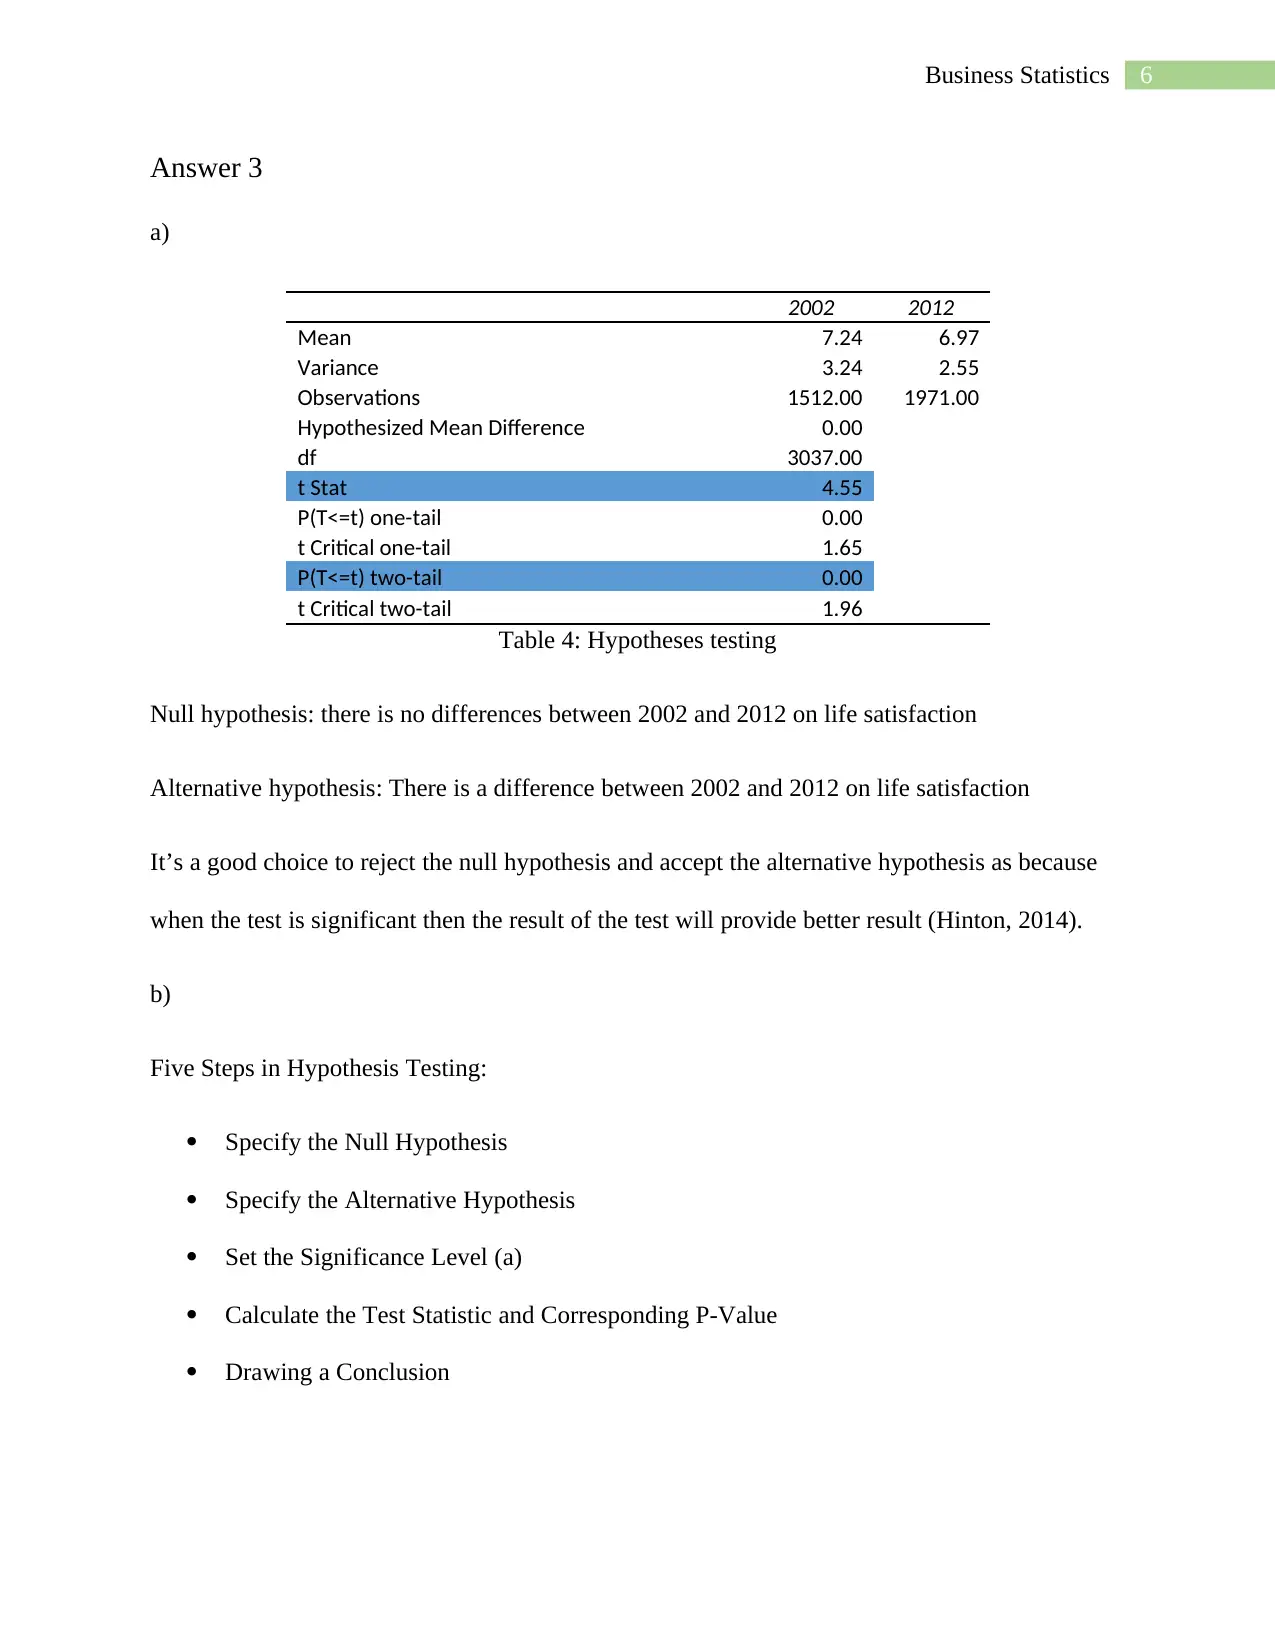
This report presents a statistical analysis of Singapore's life satisfaction levels, comparing data from 2002 and 2012. The analysis encompasses descriptive statistics, including mean, median, mode, standard deviation, and variance, to summarize the datasets. Confidence intervals are calculated to assess the uncertainty associated with the sample means, and hypothesis testing is performed to determine if there is a statistically significant difference in life satisfaction between the two years. The report also includes data visualization and a discussion of the data's characteristics, such as skewness and range, to provide a comprehensive understanding of the trends. The findings suggest a decline in life satisfaction among Singaporeans during the observed period, attributed to various factors. The report concludes with recommendations for future data analysis and highlights the importance of statistical methods in drawing meaningful conclusions from survey data.
tabler-icon-diamond-filled.svg

Contribute Materials

Your contribution can guide someone’s learning journey. Share your documents today.
Document Page
Running head: Business Statistics
Business Statistics
Student Name:
Student ID:
University Name:
Course ID:
tabler-icon-diamond-filled.svg

Secure Best Marks with AI Grader

Need help grading? Try our AI Grader for instant feedback on your assignments.
Document Page
2Business Statistics
Table of Contents
Answer 1..........................................................................................................................................3
Answer 2..........................................................................................................................................5
Answer 3..........................................................................................................................................6
Answer 4..........................................................................................................................................7
Answer 5..........................................................................................................................................8
References......................................................................................................................................10
Document Page
3Business Statistics
Answer 1
Descriptive Statistics
2002 2012
Mean 7.24 6.97
Standard Error 0.05 0.04
Median 8 7
Mode 8 7
Standard Deviation 1.80 1.60
Sample Variance 3.24 2.55
Kurtosis 0.46 0.87
Skewness -0.67 -0.64
Range 9 9
Minimum 1 1
Maximum 10 10
Sum 10944 13740
Count 1512 1971
Table 1: Descriptive statistic table
For large and huge dataset descriptive statistic plays an important role to summarize the data.
Then Descriptive statistics further can be broken down into-
Measure of location
Measure of dispersion
Measure of location mainly describe the central tendency of the dataset which further
classified into mean, mode and median (Altman et al., 2013). In simple word the mean is the sum
of observation divided by the number of observation. Whereas the median is middle position
value of the data. The mode is consider as the value which have the highest frequency in the data
(Siegel, 2016).
Document Page
4Business Statistics
In the experiment the mean for the year 2002 is 7.24 whereas the mean value for the year
2012 is 6.97. The median and mode for the year 2002 is 8 whereas for the year 2012 the mode
and median is 7 which is less than the year 2002.
Measure of dispersion states how the data is spread. This includes the range, interquartile
range, standard deviation and variance (Anderson, Burnham & Thompson, 2000). The range is
described as the smallest and largest observation in the dataset.
In the analysis it has been observed that the range for both the year is same i.e. 9. The
standers deviation was observed to be 1.80 for the year 2002 and 1.60 for the year 2012. The
variance for the year 2002 was observed to be 3.24 whereas for the year 2012 the variance was
observed to be 2.55 which is quite low from the other.
2012 has better standard deviation which implies that the skewness will also less than 2002, thus
2012 was good with the data.
Figure 1: Data visualization
2002 2012
6.80
6.85
6.90
6.95
7.00
7.05
7.10
7.15
7.20
7.25
7.30
7.24
6.97
2002 vs 2012
tabler-icon-diamond-filled.svg

Secure Best Marks with AI Grader

Need help grading? Try our AI Grader for instant feedback on your assignments.
Document Page
5Business Statistics
Answer 2
Table 2: Confidence Interval of 2002 Table 3: Confidence Interval of 2012
Confidence interval shows how much there is uncertainty is there with any particular
statistic (Dixon & Massey, 1951). Most of the time Confidence interval are used with a margin
of error. In 2002 the lower limit was 7.12, which mean by this limit most of the people get
satisfied but in 2012 the lower limit got decreased to 6.88 which conclude that Singaporeans are
more dissatisfied with their lives now than before. It is 99% confident that most people get
dissatisfied. For 2002 the lower limit is 7.12 and the lower limit for 2012 is6.88. The upper limit
for 2002 is 7.36 and the upper limit for the year 2012 is 7.06 which is really good.
2002
Confidence Interval for mean
Data
Sample Standard Deviation 1.80
Sample Mean 7.24
Sample Size 1512
Confidence Level 99%
Intermediate Calculations
Standard Error of the Mean 0.0463
Degrees of Freedom 1511
t Value 2.5791
Margin of Error 0.1194
Confidence Interval
Interval Lower Limit 7.12
Interval Upper Limit 7.36
2012
Confidence Interval for mean
Data
Sample Standard Deviation 1.60
Sample Mean 6.97
Sample Size 1971
Confidence Level 99%
Intermediate Calculations
Standard Error of the Mean 0.0360
Degrees of Freedom 1970
t Value 2.5783
Margin of Error 0.0928
Confidence Interval
Interval Lower Limit 6.88
Interval Upper Limit 7.06
Document Page
6Business Statistics
Answer 3
a)
2002 2012
Mean 7.24 6.97
Variance 3.24 2.55
Observations 1512.00 1971.00
Hypothesized Mean Difference 0.00
df 3037.00
t Stat 4.55
P(T<=t) one-tail 0.00
t Critical one-tail 1.65
P(T<=t) two-tail 0.00
t Critical two-tail 1.96
Table 4: Hypotheses testing
Null hypothesis: there is no differences between 2002 and 2012 on life satisfaction
Alternative hypothesis: There is a difference between 2002 and 2012 on life satisfaction
It’s a good choice to reject the null hypothesis and accept the alternative hypothesis as because
when the test is significant then the result of the test will provide better result (Hinton, 2014).
b)
Five Steps in Hypothesis Testing:
Specify the Null Hypothesis
Specify the Alternative Hypothesis
Set the Significance Level (a)
Calculate the Test Statistic and Corresponding P-Value
Drawing a Conclusion
Document Page
7Business Statistics
Alpha value:- 0.01 (at 1% level)
Test statistic:- 4.55
P-Value:- 0.00
Comment:- It has been observed that the p-value <alpha value. Thus the null hypothesis is
rejected and the alternative hypothesis is accepted. Hence it can be summarized that there is a
difference between 2002 and 2012 on life satisfaction.
c)
The data should be normal
The dataset should be greater than equal to 30
The variance should be homogeneous
Answer 4
The dataset consist of data from two different year mainly 2002 and 2012 which have
been collected from survey conducted Singapore. The data is a secondary data where there are 8
attributes. The survey data attribute consist of year i.e. either 2002 or 2012, the gender attribute
consist of string values i.e. either male or female. The age attribute consist of age of different person.
Then the marital status which includes weather the person is married or not. Then edu_attainment
attribute which contains the highest education the person undergone. Then the work status and the
happiness attribute. Then at the end the life satisfaction which ranges from 1 to 10 which is the target
variable.
At first the target variable is separated to another sheet for the analysis purpose, then add the
add in named data analysis from the option menu for different analysis purpose. The descriptive
tabler-icon-diamond-filled.svg

Paraphrase This Document

Need a fresh take? Get an instant paraphrase of this document with our AI Paraphraser
Document Page
8Business Statistics
analysis is done on the life satisfaction level. These analysis contains information like mean, median,
mode, standard error, SD, sum, count and many other statistical information. These are some analysis
that need to understand for proper outcome.
In the analysis it has been observed that the range for both the year is same i.e. 9. The
standers deviation was observed to be 1.80 for the year 2002 and 1.60 for the year 2012. The
variance for the year 2002 was observed to be 3.24 whereas for the year 2012 the variance was
observed to be 2.55 which is quite low from the other.
2012 has better standard deviation which implies that the skewness will also less than 2002,
thus 2012 was good with the data. Hence from this analysis it can be said that in the recent time
peoples are more dissatisfied than before (Hoekstra et al., 2014). At the end the hypothesis testing
has been performed to come up with the desired conclusion by the t-test analysis. The t-test is been
perform to compare the average value of two different data set which will be from same population.
The t-test is generally used for hypothesis testing tool which eventually allows the testing of an
assumption applicable to a population.
Answer 5
Statistical analysis are performed on dataset to come up with some conclusion and can
help any individual or any organization to implement those understanding to get benefited from
the analysis (Holcomb, 2016). Thus from the analysis it can be concluded that the life
satisfaction for most of the peoples in Singapore decreases in recent time due to many factors. As
in the recent time there are many responsibilities and other stuffs which are some major cause for
such drop in the levels of life satisfaction for many Singaporeans.
The analysis part started with the standard deviation, in 2012 the standard deviation is
low which tells that most of the numbers are close to the average and in 2002 the standard
Document Page
9Business Statistics
deviation is high in comparison with 2012 which says that the numbers are more spread out
(Siegmund, 2013). The skewness refers to the asymmetry in the distribution Here the data is left
skewed thus the mean value is supposed to be lower than the median value.
Also data visualization has been performed over the mean data for the two year. Data
visualization is an important part to understand the data (Poletiek, 2013). Only bar graph has
been shown which indicates that during the year 2002 7.24 is the mean which indicates most of
the peoples were satisfied during those days but due to some factors in 2012 the satisfaction level
decreases by 0.27 levels which shows some changes occurred within the year. Hence from the
visualization it can be said that in recent time most of the peoples are less satisfied from
previous.
Confidence interval has been calculated which gives the upper and lower limit of the
sample mean within the specified interval that can be 99% confident which have been captured
the population mean (Johnson, 2014). From the lower limit interval limit of the confidence
interval it can be said that in 2002 people were highly satisfied with their life whereas in 2012
the life satisfaction rate decreases.
Thus the summary indicates that before coming to a conclusion different statistical
analysis need to be developed as the data gather from various sources are not always genuine and
are not always good for analysis purpose. The analysis includes step by step procedure including
from data gathering, data pre-processing, visualization, descriptive analysis, finding confidence
interval, hypothesis testing. And after these it has been concluded that Singaporeans have become
less satisfied with their lives over the years.
Document Page
10Business Statistics
References
Altman, D., Machin, D., Bryant, T., & Gardner, M. (Eds.). (2013). Statistics with confidence:
confidence intervals and statistical guidelines. John Wiley & Sons.
Anderson, D. R., Burnham, K. P., & Thompson, W. L. (2000). Null hypothesis testing:
problems, prevalence, and an alternative. The journal of wildlife management, 912-923.
Dixon, W. J., & Massey Jr, F. J. (1951). Introduction to statistical analysis.
Hinton, P. R. (2014). Statistics explained. Routledge.
Hoekstra, R., Morey, R. D., Rouder, J. N., & Wagenmakers, E. J. (2014). Robust
misinterpretation of confidence intervals. Psychonomic bulletin & review, 21(5), 1157-
1164.
Holcomb, Z. C. (2016). Fundamentals of descriptive statistics. Routledge.
Johnson, D. E. (2014). 14 Descriptive statistics. Research methods in linguistics, 288.
Poletiek, F. H. (2013). Hypothesis-testing behavior. Psychology Press.
Siegel, A. (2016). Practical business statistics. Academic Press.
Siegmund, D. (2013). Sequential analysis: tests and confidence intervals. Springer Science &
Business Media.
chevron_up_icon
1 out of 10
circle_padding
hide_on_mobile
zoom_out_icon
logo.png

Your All-in-One AI-Powered Toolkit for Academic Success.

Available 24*7 on WhatsApp / Email

[object Object]