BUS1BAN Major Assignment: Smartphone Demand at La Trobe Uni

Verified

Added on  2020/05/11

|19
|1711
|97
Report
AI Summary
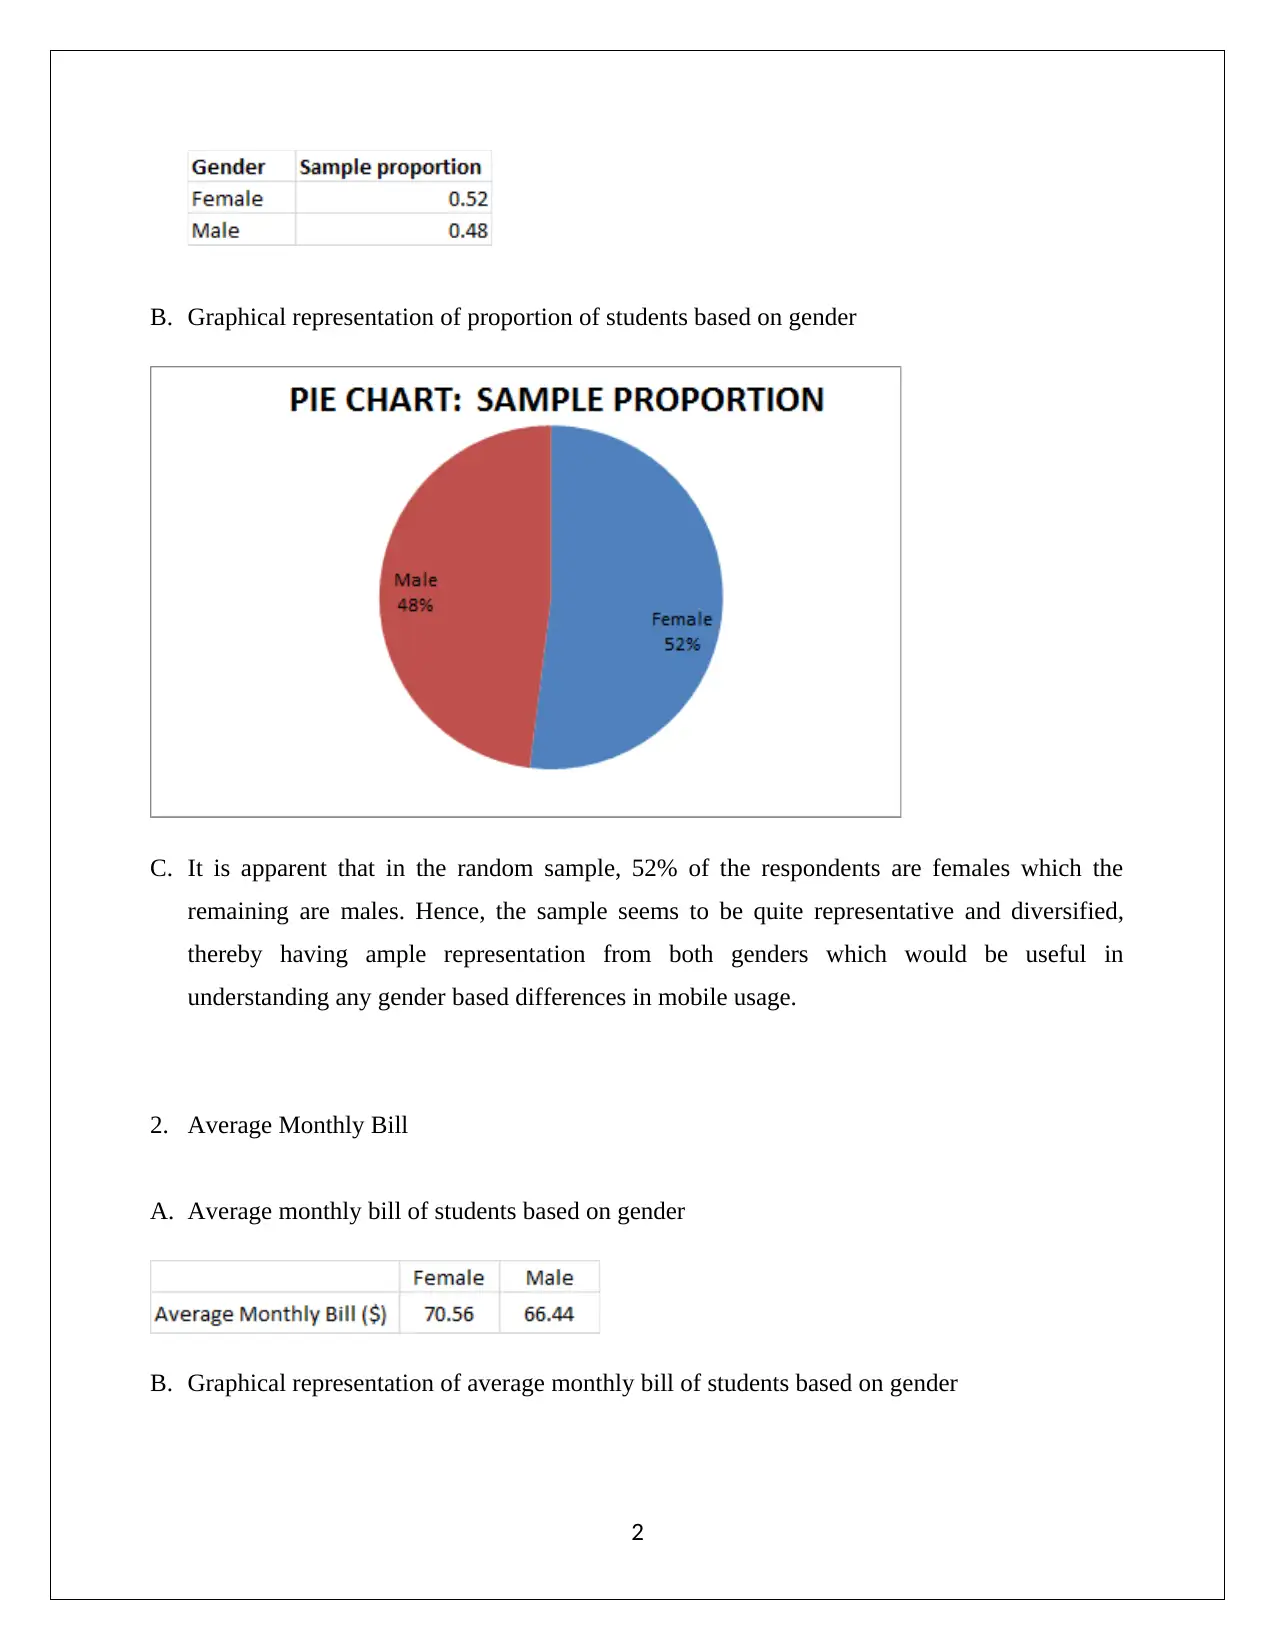
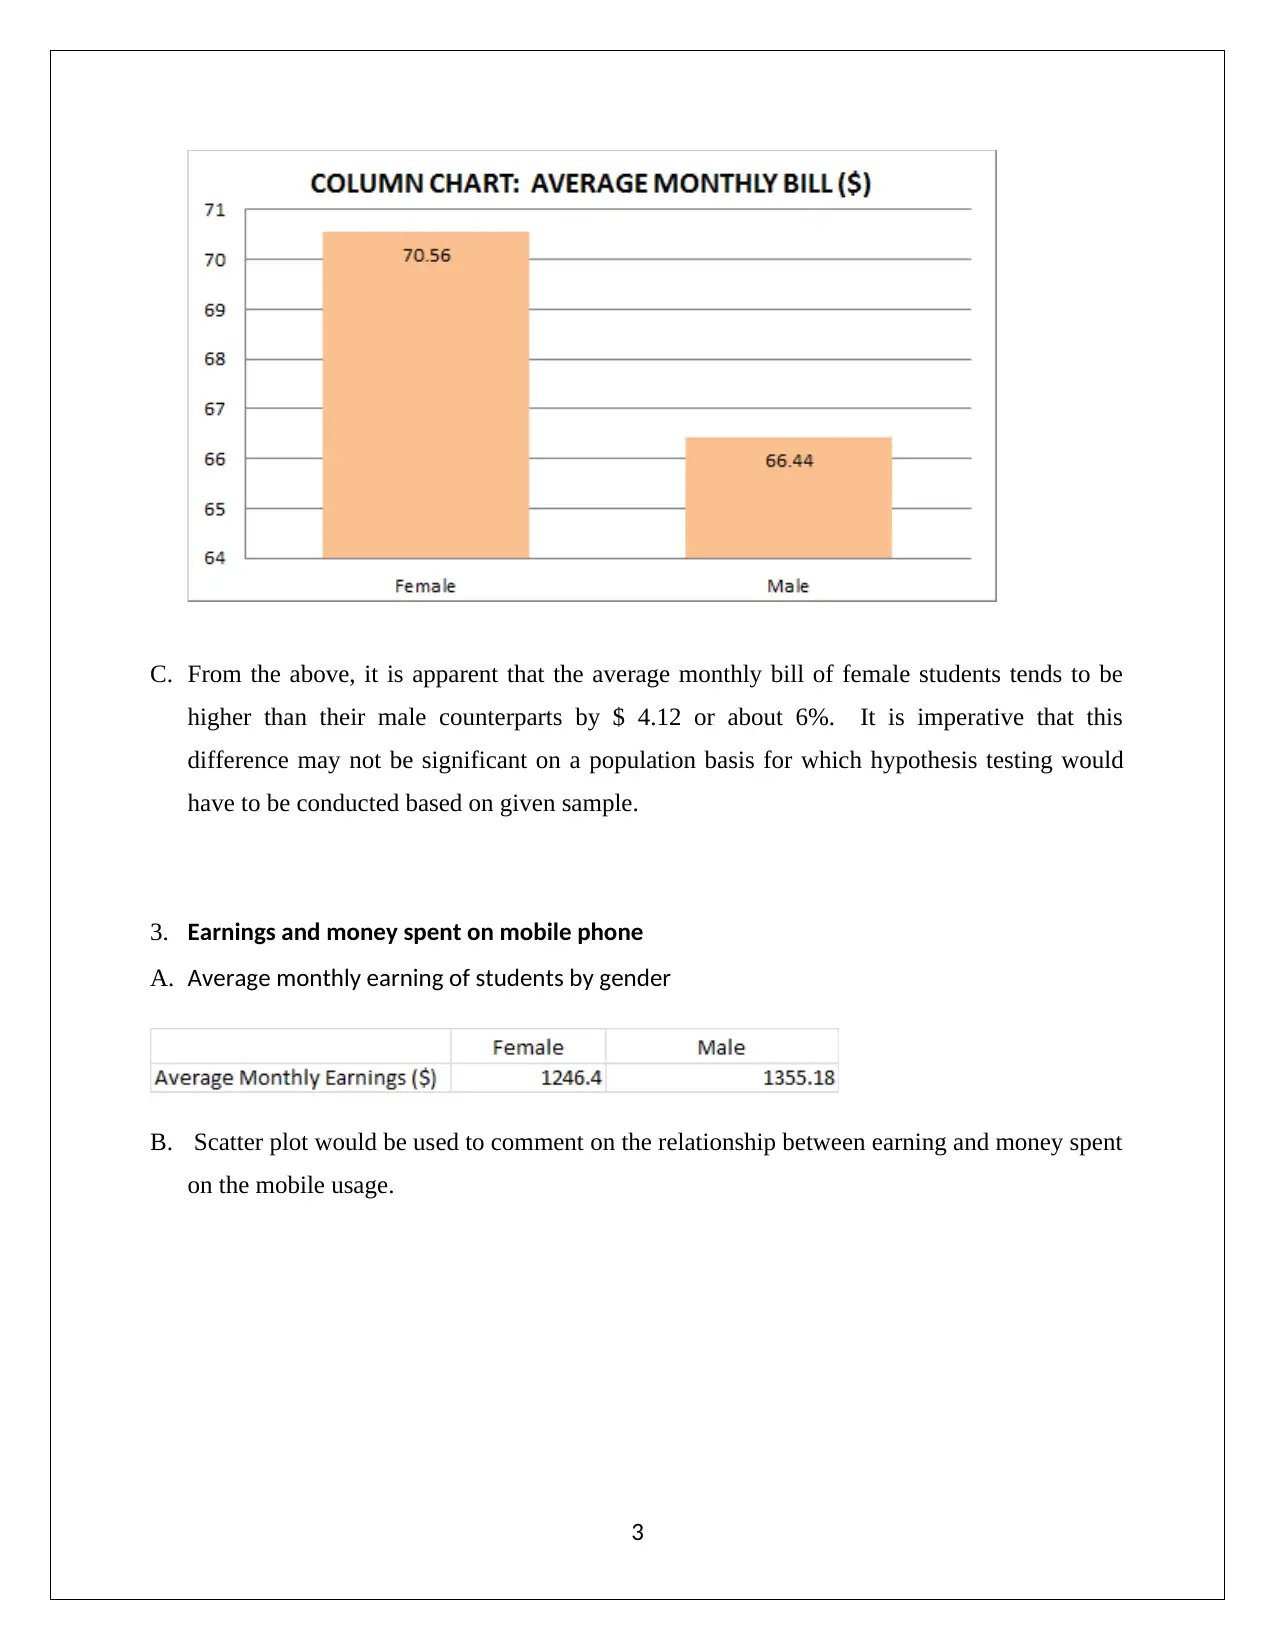
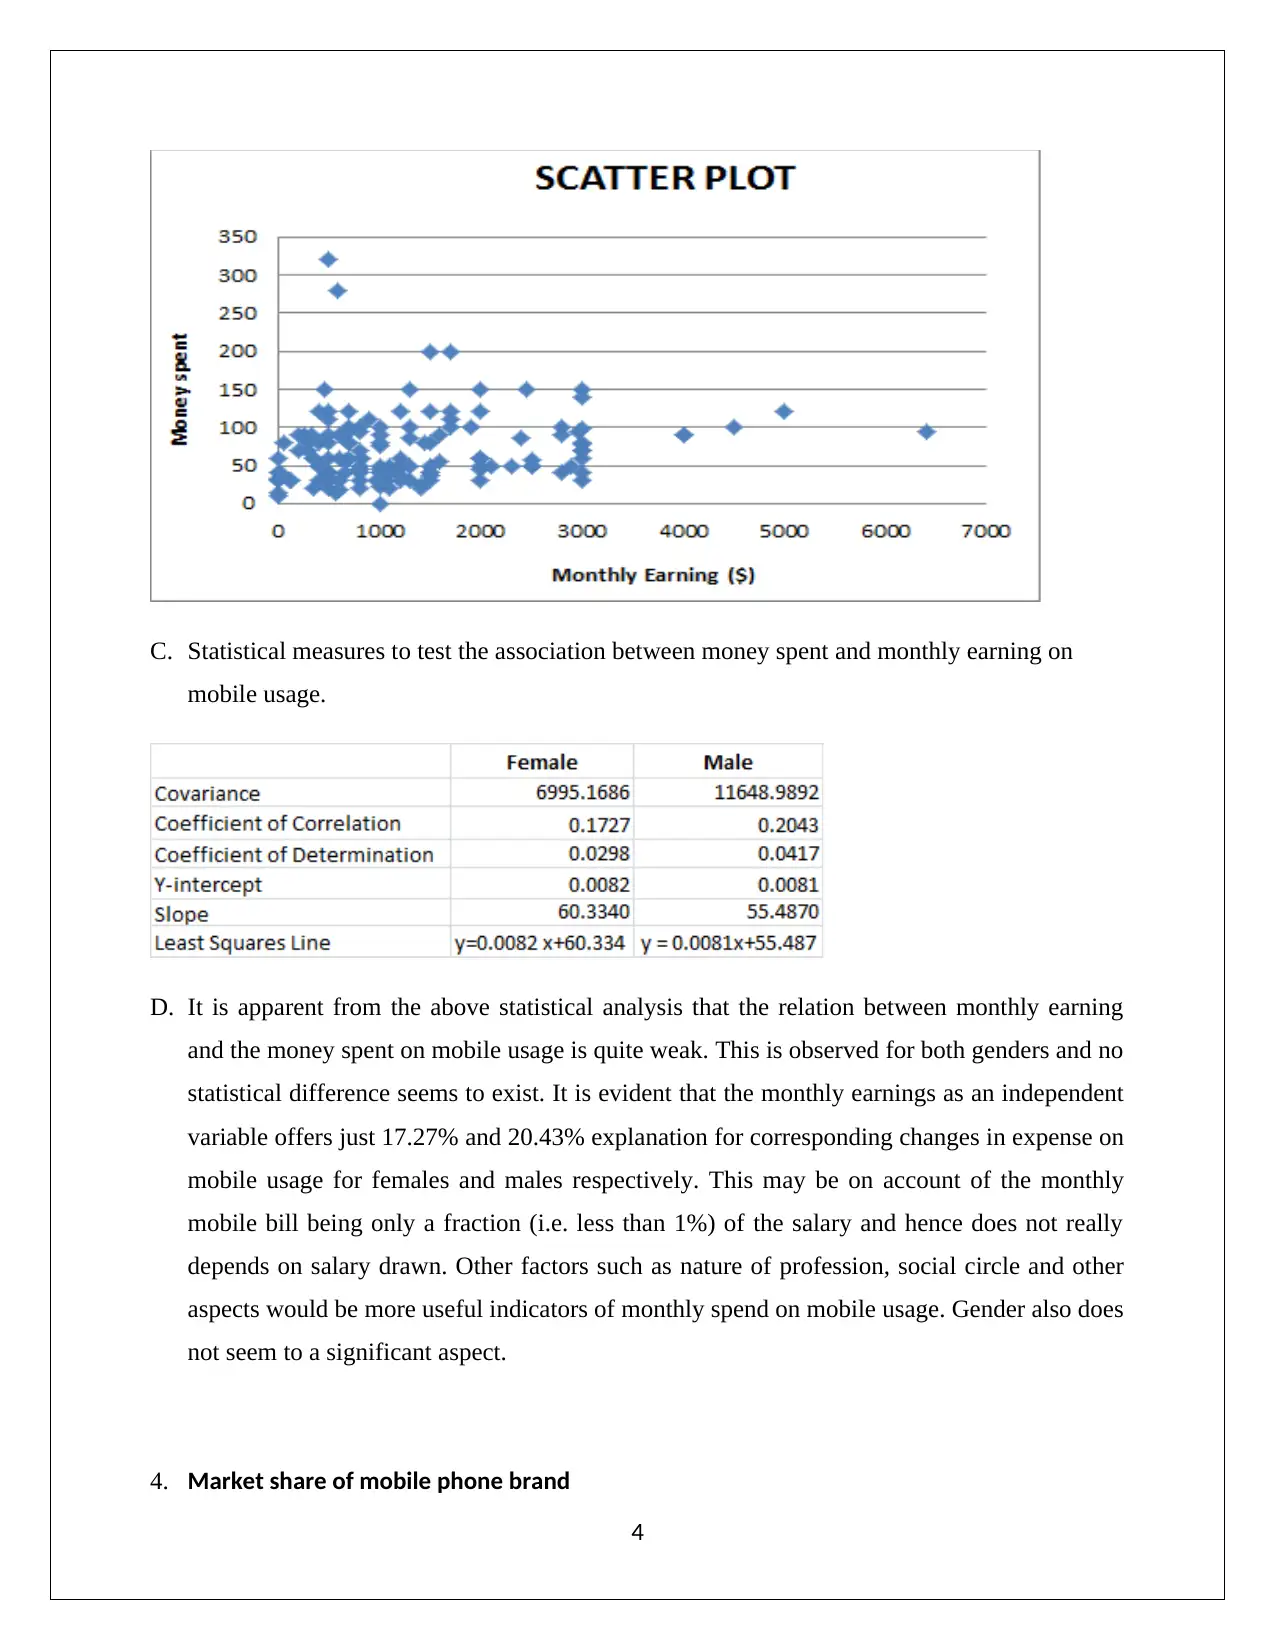
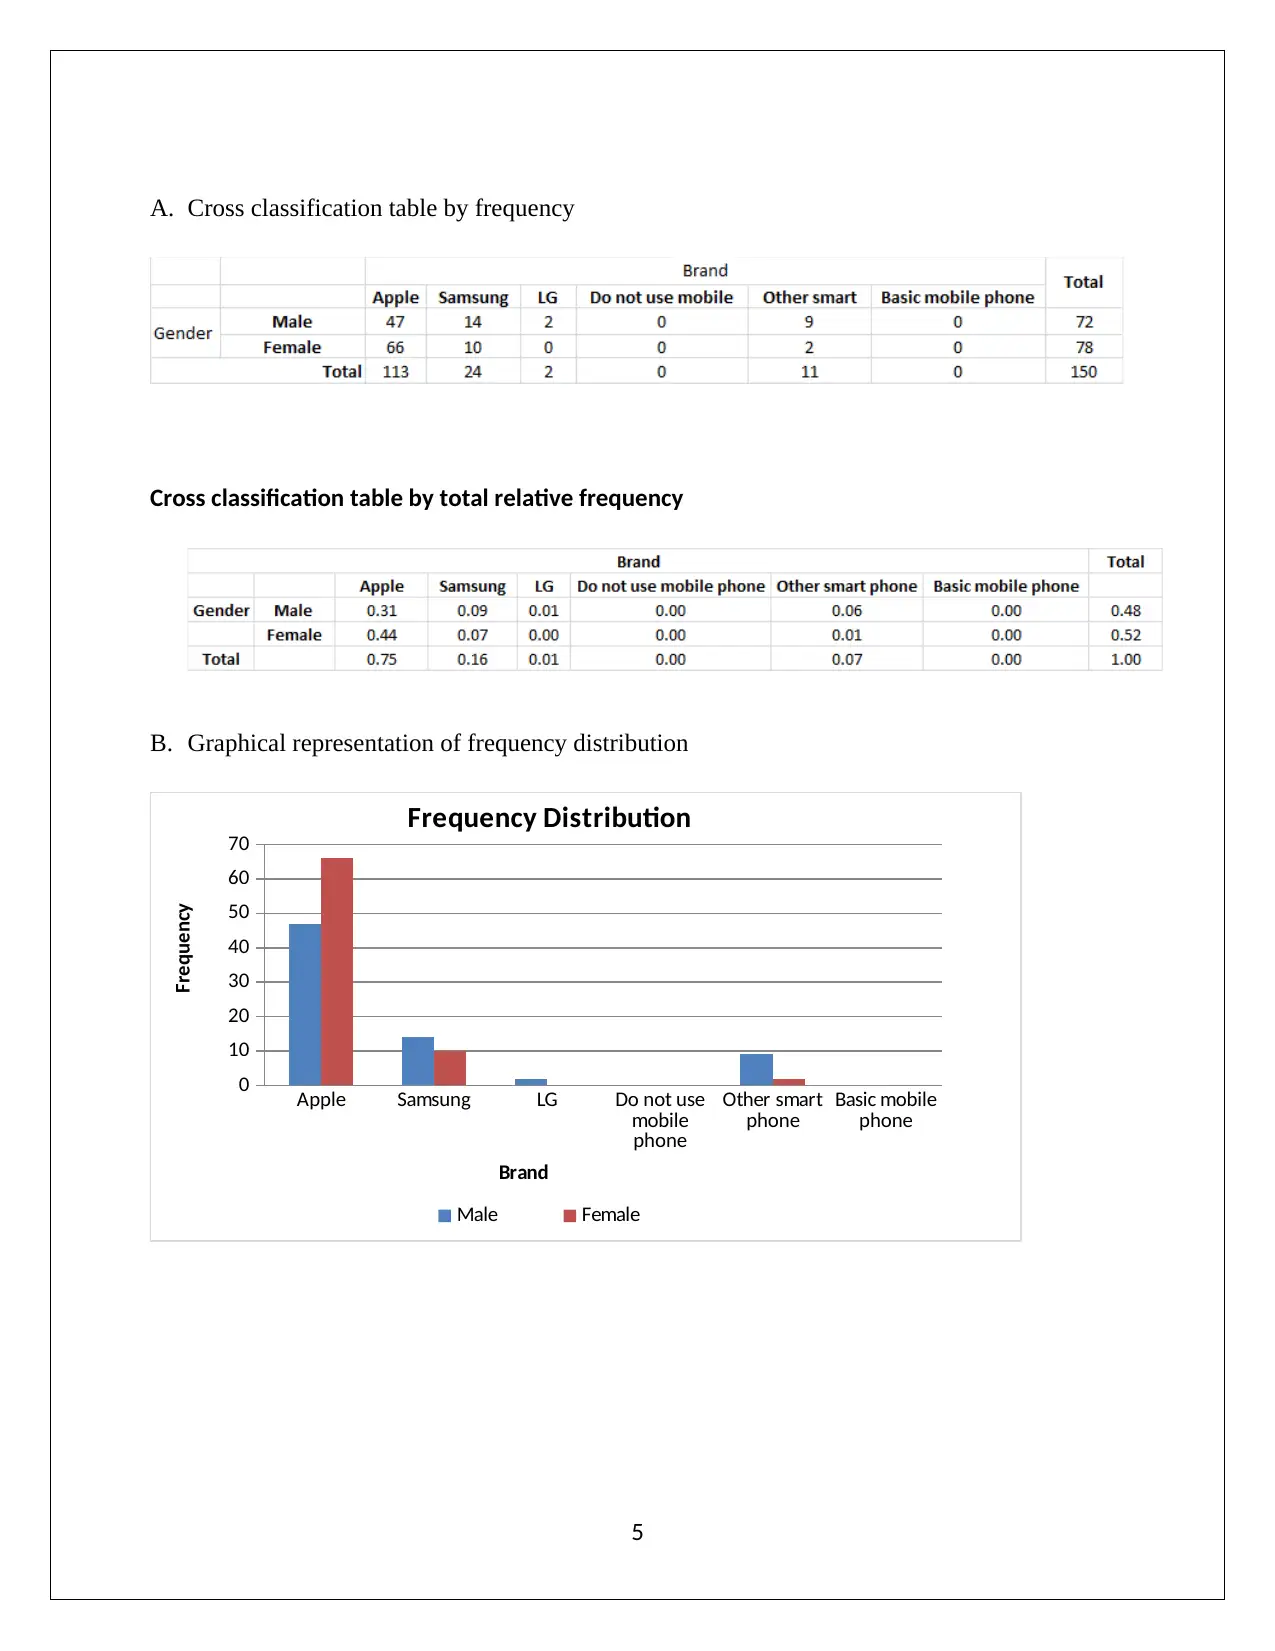
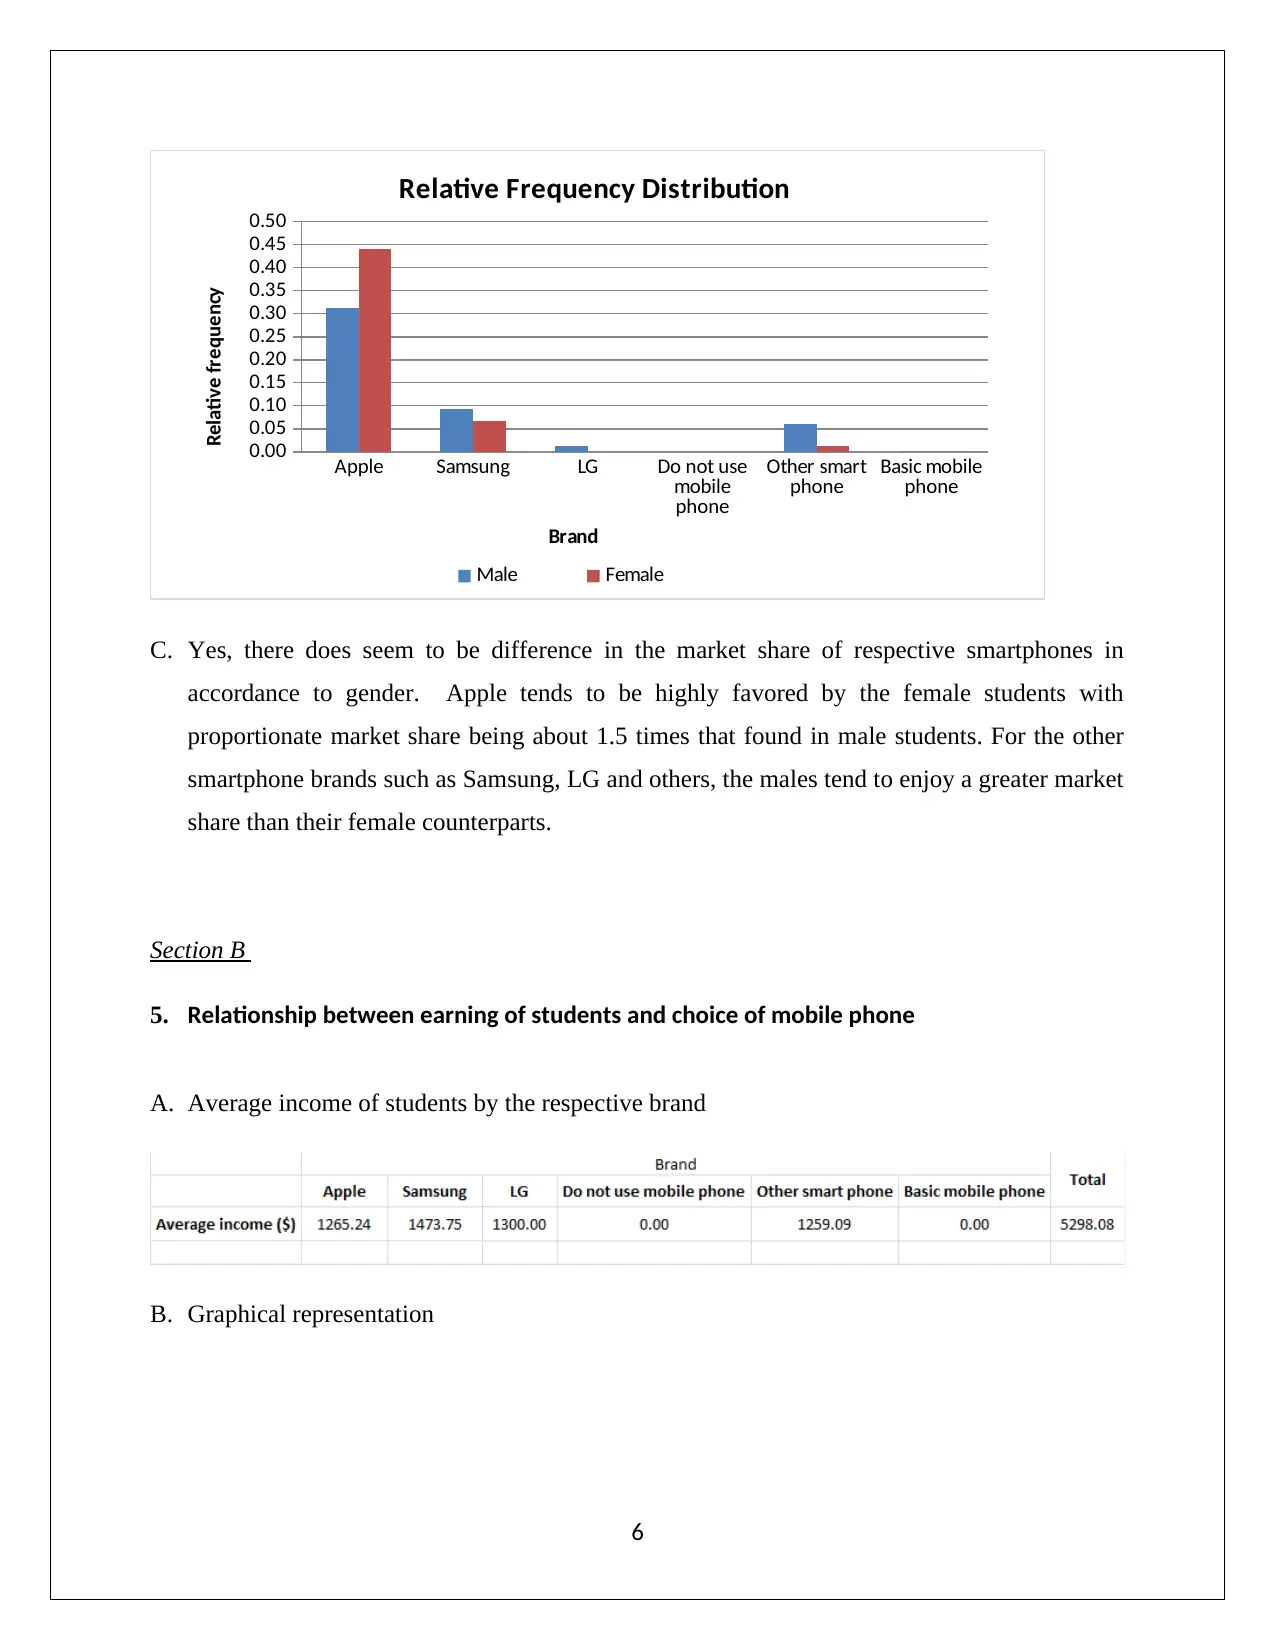
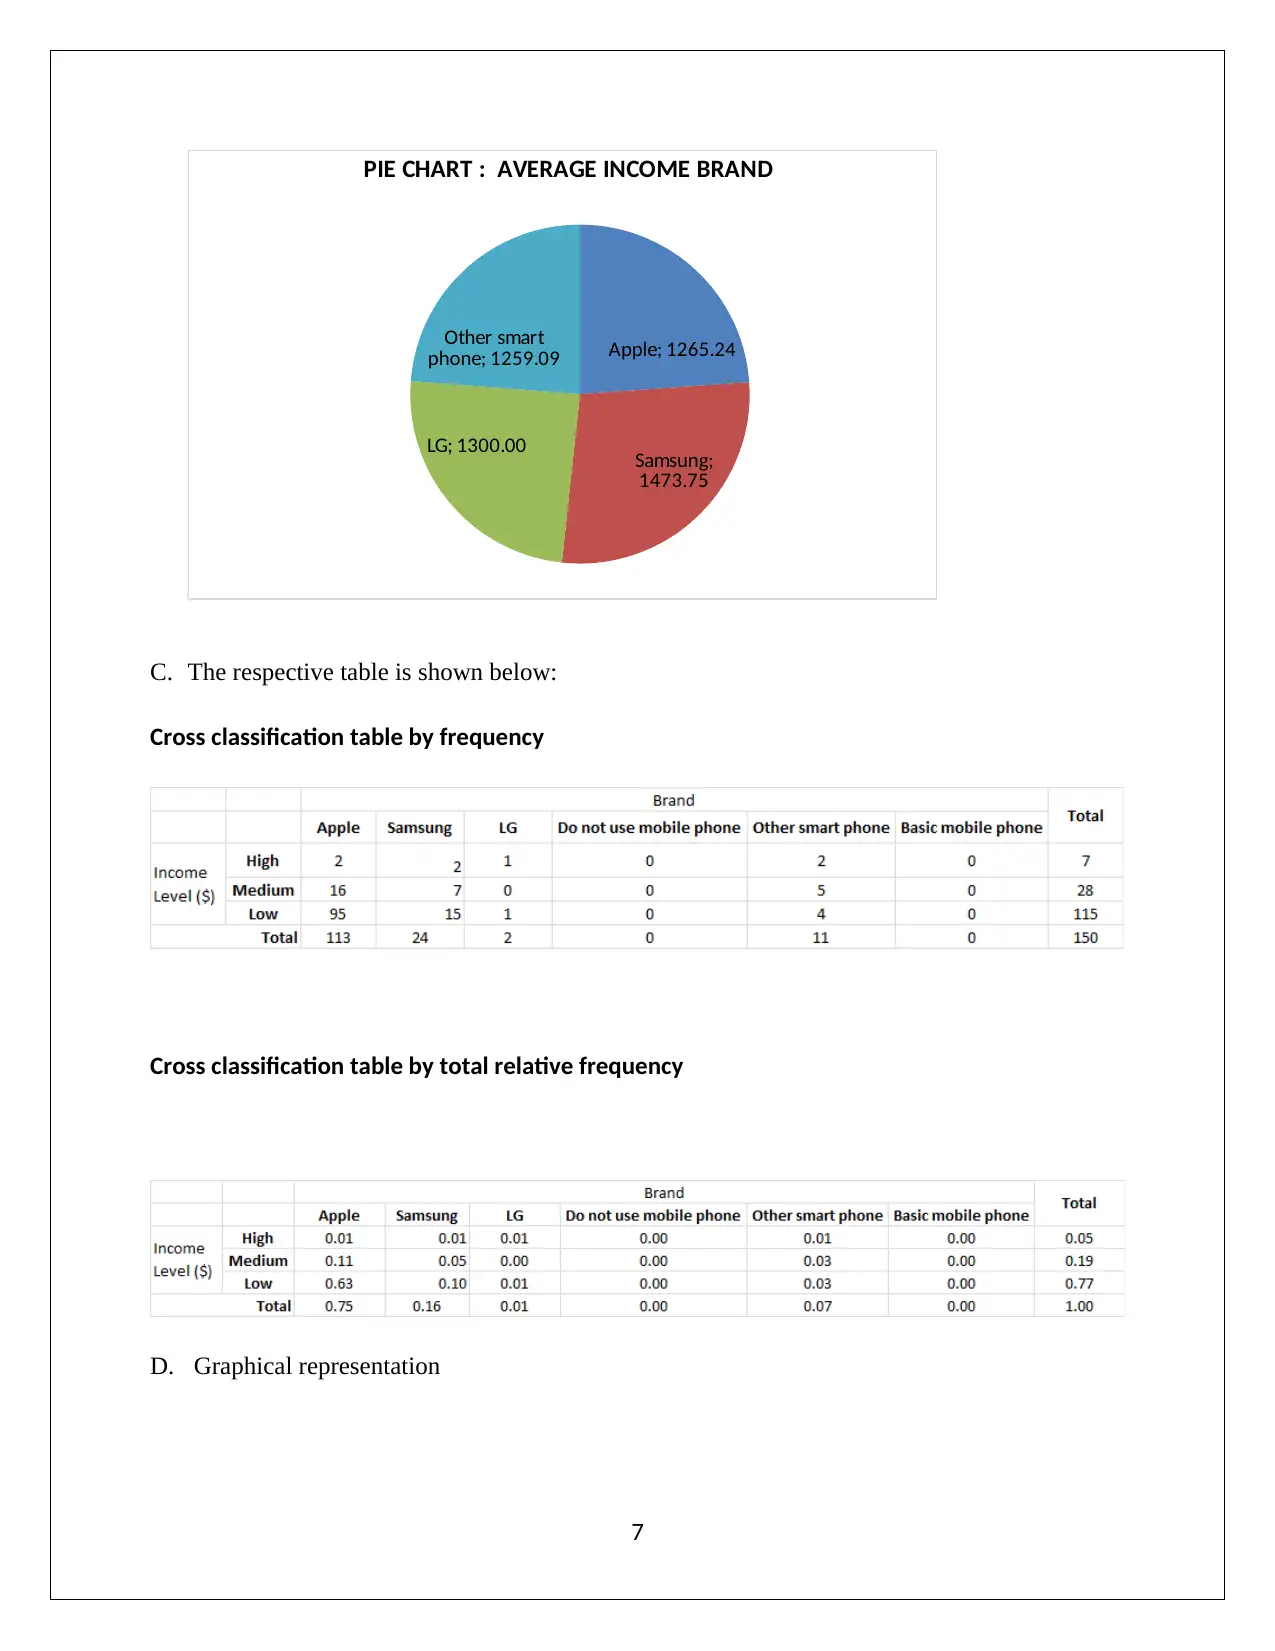
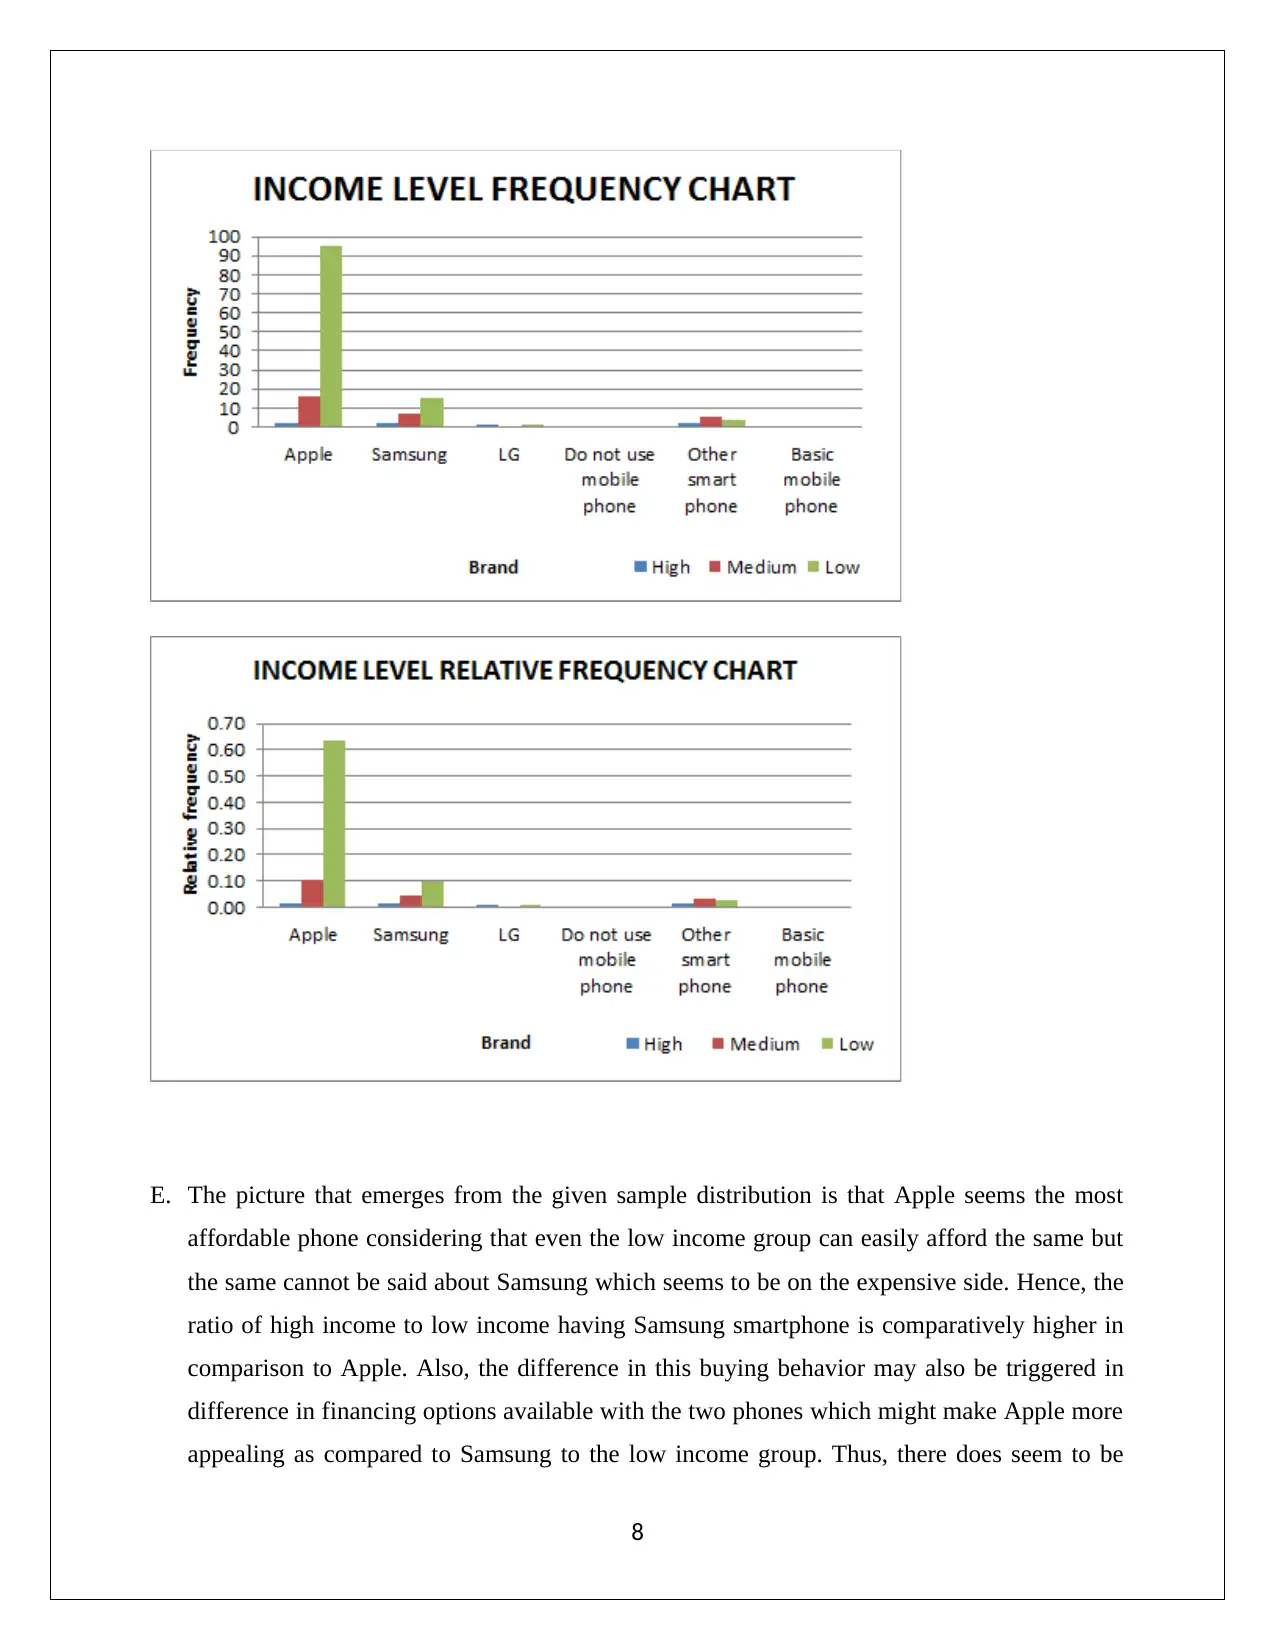
This report analyzes smartphone demand and usage among students at La Trobe University, based on a survey of 150 students selected through random sampling. The analysis investigates gender-based preferences for smartphone brands (Apple, Samsung, etc.), monthly mobile spending, and its relationship with income. It explores the impact of discounts on brand loyalty and market share, revealing that females favor Apple, while males show less brand loyalty. The study also employs inferential statistical techniques to estimate confidence intervals for various parameters, such as the proportion of female students and the proportion of smartphone users, concluding that nearly all students own smartphones and that Apple holds a market share exceeding 40%. The report suggests improvements in sampling methods for more representative results.
Document Page
BUS1BAN Major Assignment
An insight into student demand for smartphones at La Trobe University
Student id and name
[Pick the date]
tabler-icon-diamond-filled.svg

Paraphrase This Document

Need a fresh take? Get an instant paraphrase of this document with our AI Paraphraser
Document Page
Executive Summary
From the survey of smartphone usage collected from the students, a random sample of 150
students has been selected. The objective of this sample is to understand the preferences of
students related to smartphones and how these tend to vary with regards to gender. Also, attempt
has been made to understand the customer loyalty to a particular brand when discount is offered
by the other brand. Besides, inferential statistical techniques have been used to infer various
conclusions about the population of students at La Trobe University based on the respective
sample and survey data.
Introduction
The objective of the given sample is to analyze the data collected through a survey amongst
LaTrobe students which pertain to the demand and usage of smartphones. From the population
data, a sample data of 150 students has been selected through random sampling and statistical
analysis has been conducted on the same.
The first section of data analysis would deal with gender based relationship in terms of
preference of particular brands along with monthly mobile spending and the underlying
relationship with monthly income. The second section would deal with preferences of different
student gender in relation to changes in price of smartphone and the effect of the same on
purchases. Finally, the third section presents an advanced analysis where inferential statistical
techniques have been deployed.
Data Analysis
Section A
1. Gender proportion
A. Proportion of students based on gender
1
Document Page
B. Graphical representation of proportion of students based on gender
C. It is apparent that in the random sample, 52% of the respondents are females which the
remaining are males. Hence, the sample seems to be quite representative and diversified,
thereby having ample representation from both genders which would be useful in
understanding any gender based differences in mobile usage.
2. Average Monthly Bill
A. Average monthly bill of students based on gender
B. Graphical representation of average monthly bill of students based on gender
2
Document Page
C. From the above, it is apparent that the average monthly bill of female students tends to be
higher than their male counterparts by $ 4.12 or about 6%. It is imperative that this
difference may not be significant on a population basis for which hypothesis testing would
have to be conducted based on given sample.
3. Earnings and money spent on mobile phone
A. Average monthly earning of students by gender
B. Scatter plot would be used to comment on the relationship between earning and money spent
on the mobile usage.
3
tabler-icon-diamond-filled.svg

Paraphrase This Document

Need a fresh take? Get an instant paraphrase of this document with our AI Paraphraser
Document Page
C. Statistical measures to test the association between money spent and monthly earning on
mobile usage.
D. It is apparent from the above statistical analysis that the relation between monthly earning
and the money spent on mobile usage is quite weak. This is observed for both genders and no
statistical difference seems to exist. It is evident that the monthly earnings as an independent
variable offers just 17.27% and 20.43% explanation for corresponding changes in expense on
mobile usage for females and males respectively. This may be on account of the monthly
mobile bill being only a fraction (i.e. less than 1%) of the salary and hence does not really
depends on salary drawn. Other factors such as nature of profession, social circle and other
aspects would be more useful indicators of monthly spend on mobile usage. Gender also does
not seem to a significant aspect.
4. Market share of mobile phone brand
4
Document Page
A. Cross classification table by frequency
Cross classification table by total relative frequency
B. Graphical representation of frequency distribution
Apple Samsung LG Do not use
mobile
phone
Other smart
phone Basic mobile
phone
0
10
20
30
40
50
60
70
Frequency Distribution
Male Female
Brand
Frequency
5
Document Page
Apple Samsung LG Do not use
mobile
phone
Other smart
phone Basic mobile
phone
0.00
0.05
0.10
0.15
0.20
0.25
0.30
0.35
0.40
0.45
0.50
Relative Frequency Distribution
Male Female
Brand
Relative frequency
C. Yes, there does seem to be difference in the market share of respective smartphones in
accordance to gender. Apple tends to be highly favored by the female students with
proportionate market share being about 1.5 times that found in male students. For the other
smartphone brands such as Samsung, LG and others, the males tend to enjoy a greater market
share than their female counterparts.
Section B
5. Relationship between earning of students and choice of mobile phone
A. Average income of students by the respective brand
B. Graphical representation
6
tabler-icon-diamond-filled.svg

Paraphrase This Document

Need a fresh take? Get an instant paraphrase of this document with our AI Paraphraser
Document Page
Apple; 1265.24
Samsung;
1473.75
LG; 1300.00
Other smart
phone; 1259.09
PIE CHART : AVERAGE INCOME BRAND
C. The respective table is shown below:
Cross classification table by frequency
Cross classification table by total relative frequency
D. Graphical representation
7
Document Page
E. The picture that emerges from the given sample distribution is that Apple seems the most
affordable phone considering that even the low income group can easily afford the same but
the same cannot be said about Samsung which seems to be on the expensive side. Hence, the
ratio of high income to low income having Samsung smartphone is comparatively higher in
comparison to Apple. Also, the difference in this buying behavior may also be triggered in
difference in financing options available with the two phones which might make Apple more
appealing as compared to Samsung to the low income group. Thus, there does seem to be
8
Document Page
some relationship between choice of mobile phone and income level but it may be attributed
to other factors.
6. A. The completed table is indicated below.
B. The requisite scatter plot is indicated below.
9
tabler-icon-diamond-filled.svg

Paraphrase This Document

Need a fresh take? Get an instant paraphrase of this document with our AI Paraphraser
Document Page
C. The requisite information is captured in the table indicated below.
D. It is apparent from the above that the discount on Samsung galaxy phone tends to increase in
comparison to the Apple phone, the market share of Samsung tends to increase. Initially, the
increase is quite less but after 20%, there seems to a steep increase in the market share for
every 5% incremental discounts. But having said that, it would be fair to conclude that brand
loyalty is higher for Apple in comparison with Samsung as despite giving 50% discount, the
company is able to acquire 60% market share only.
7. The respective effects of price on preference & gender
A. The table is shown below:
10
Document Page
B. Scatter plots
11
chevron_up_icon
1 out of 19
circle_padding
hide_on_mobile
zoom_out_icon
[object Object]