An Insight into Student Smartphone Demand at La Trobe University

Verified

Added on  2020/05/11

|16
|2389
|167
Report
AI Summary
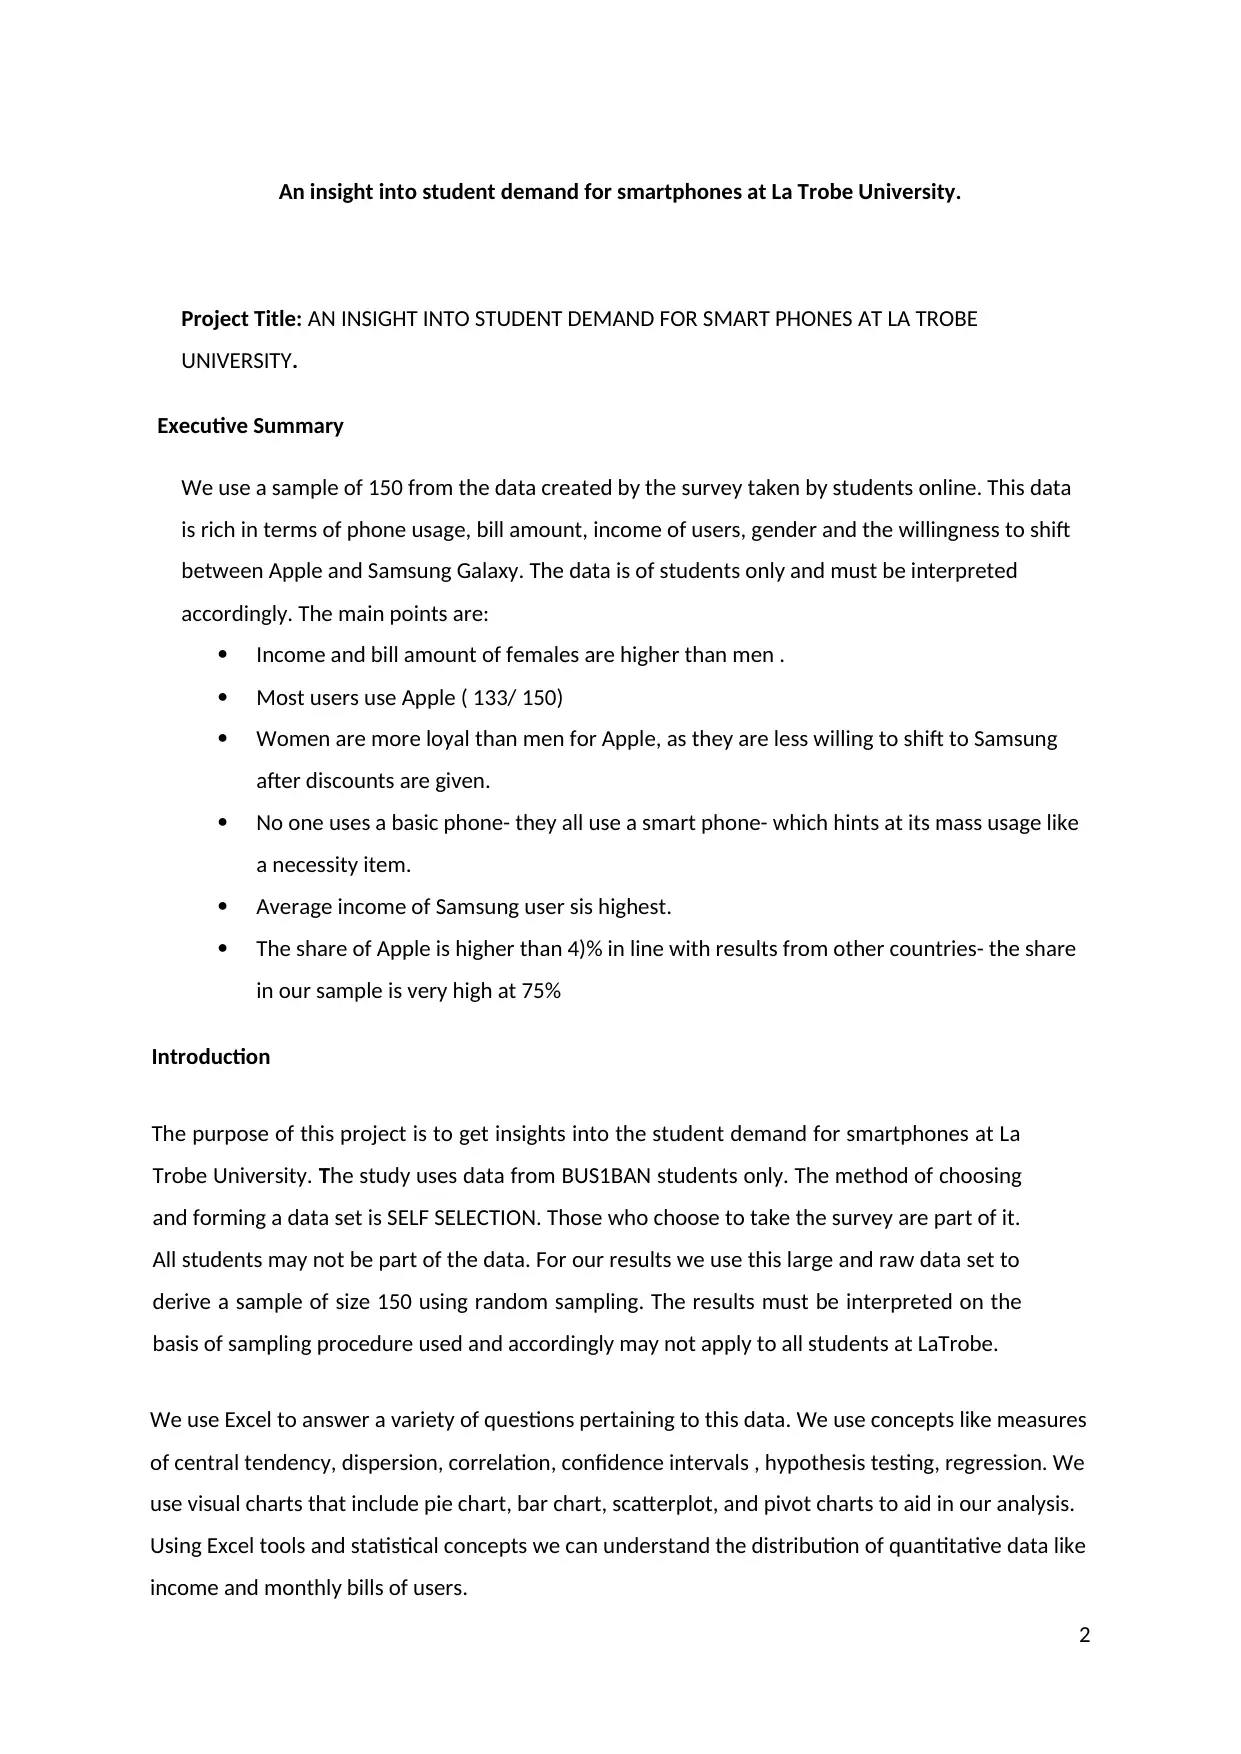
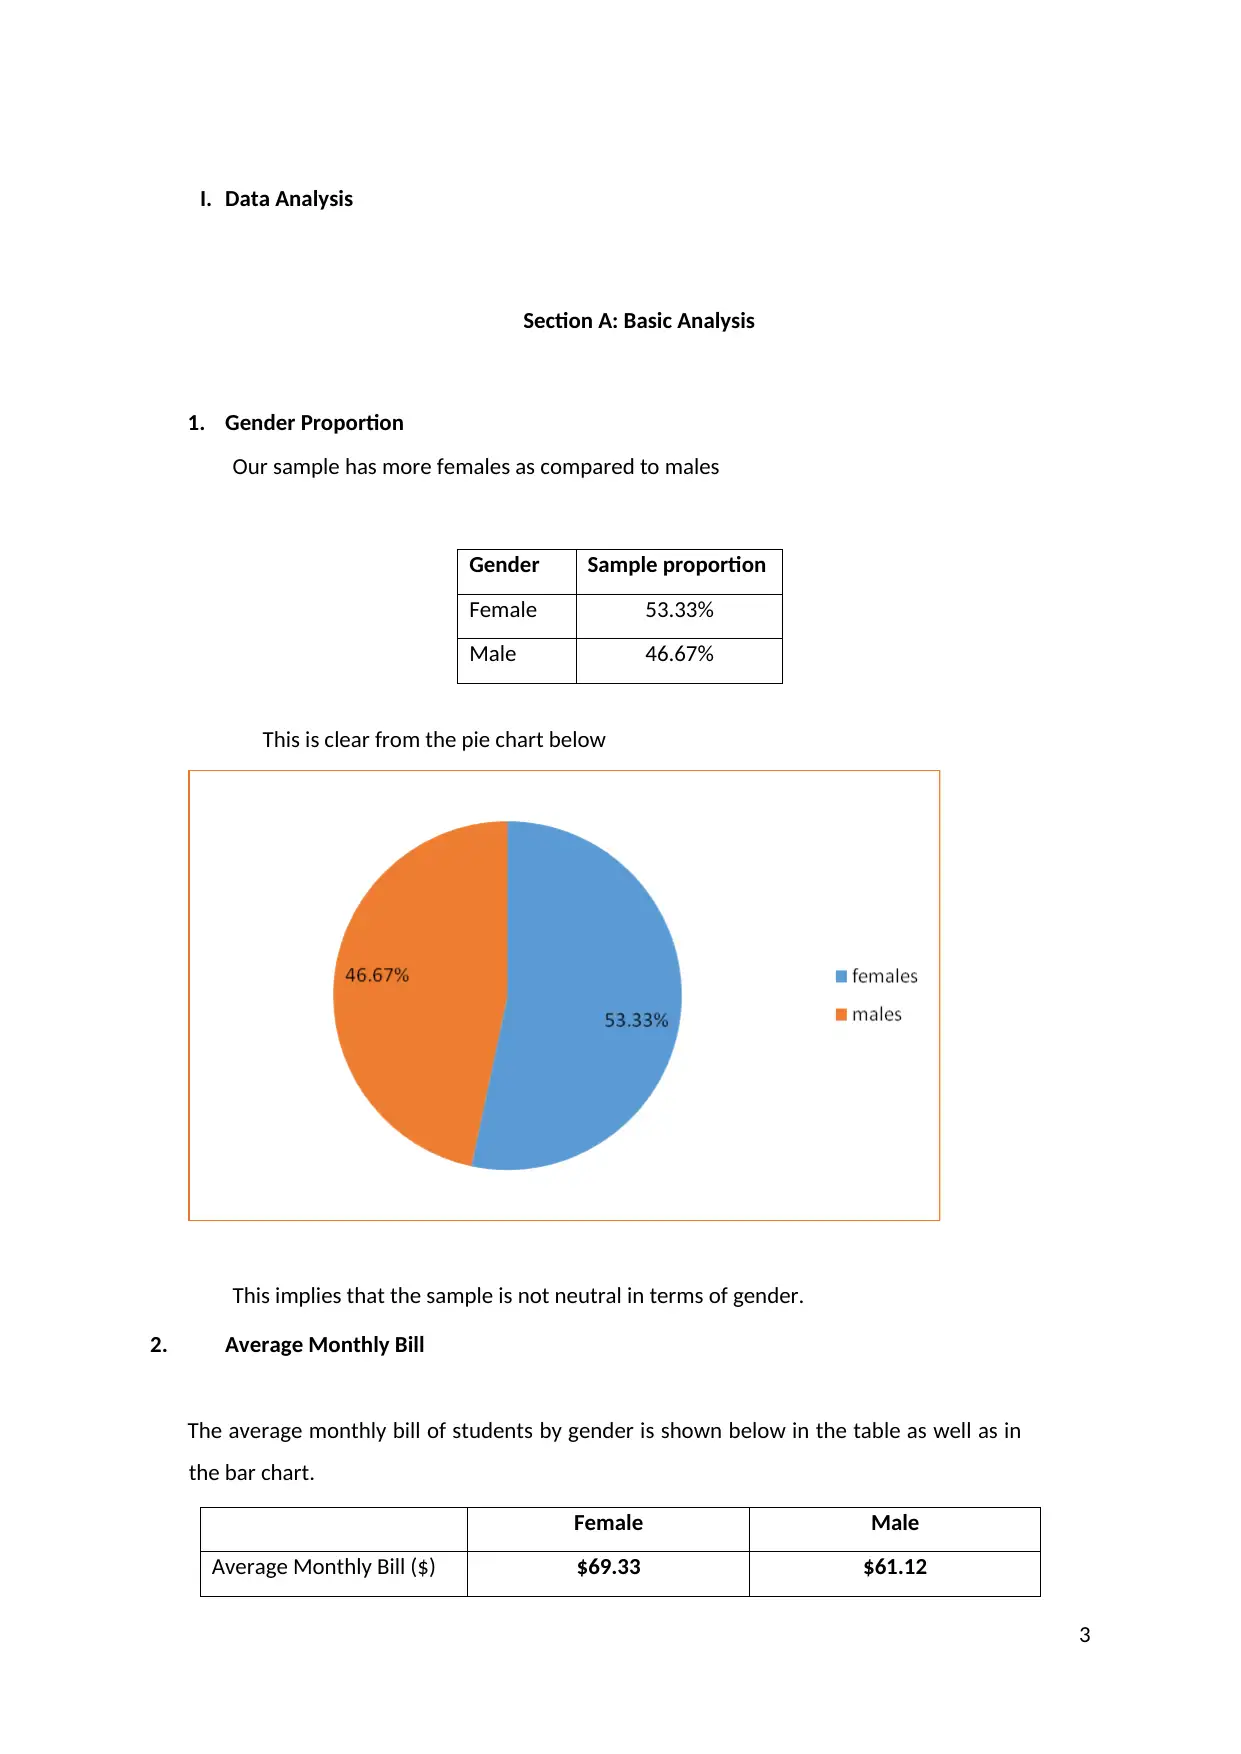
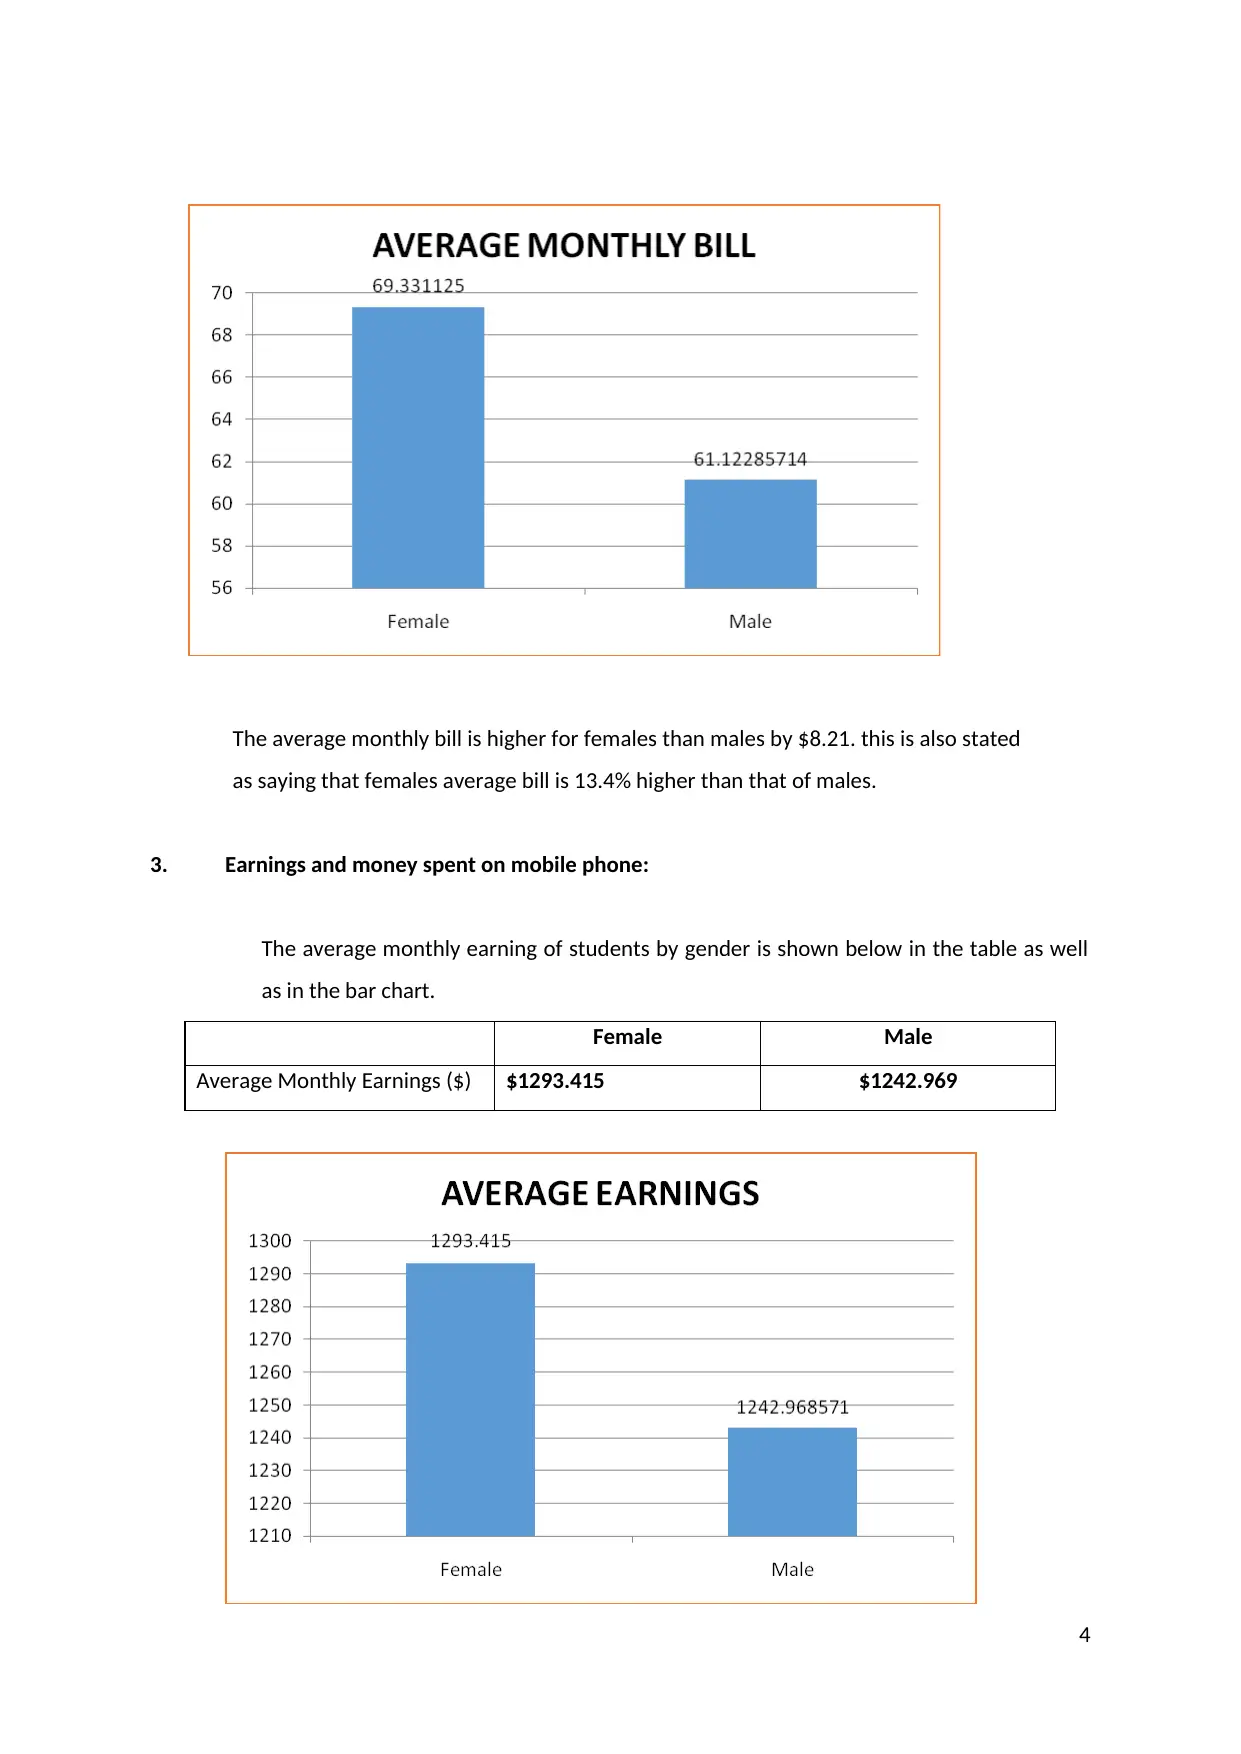
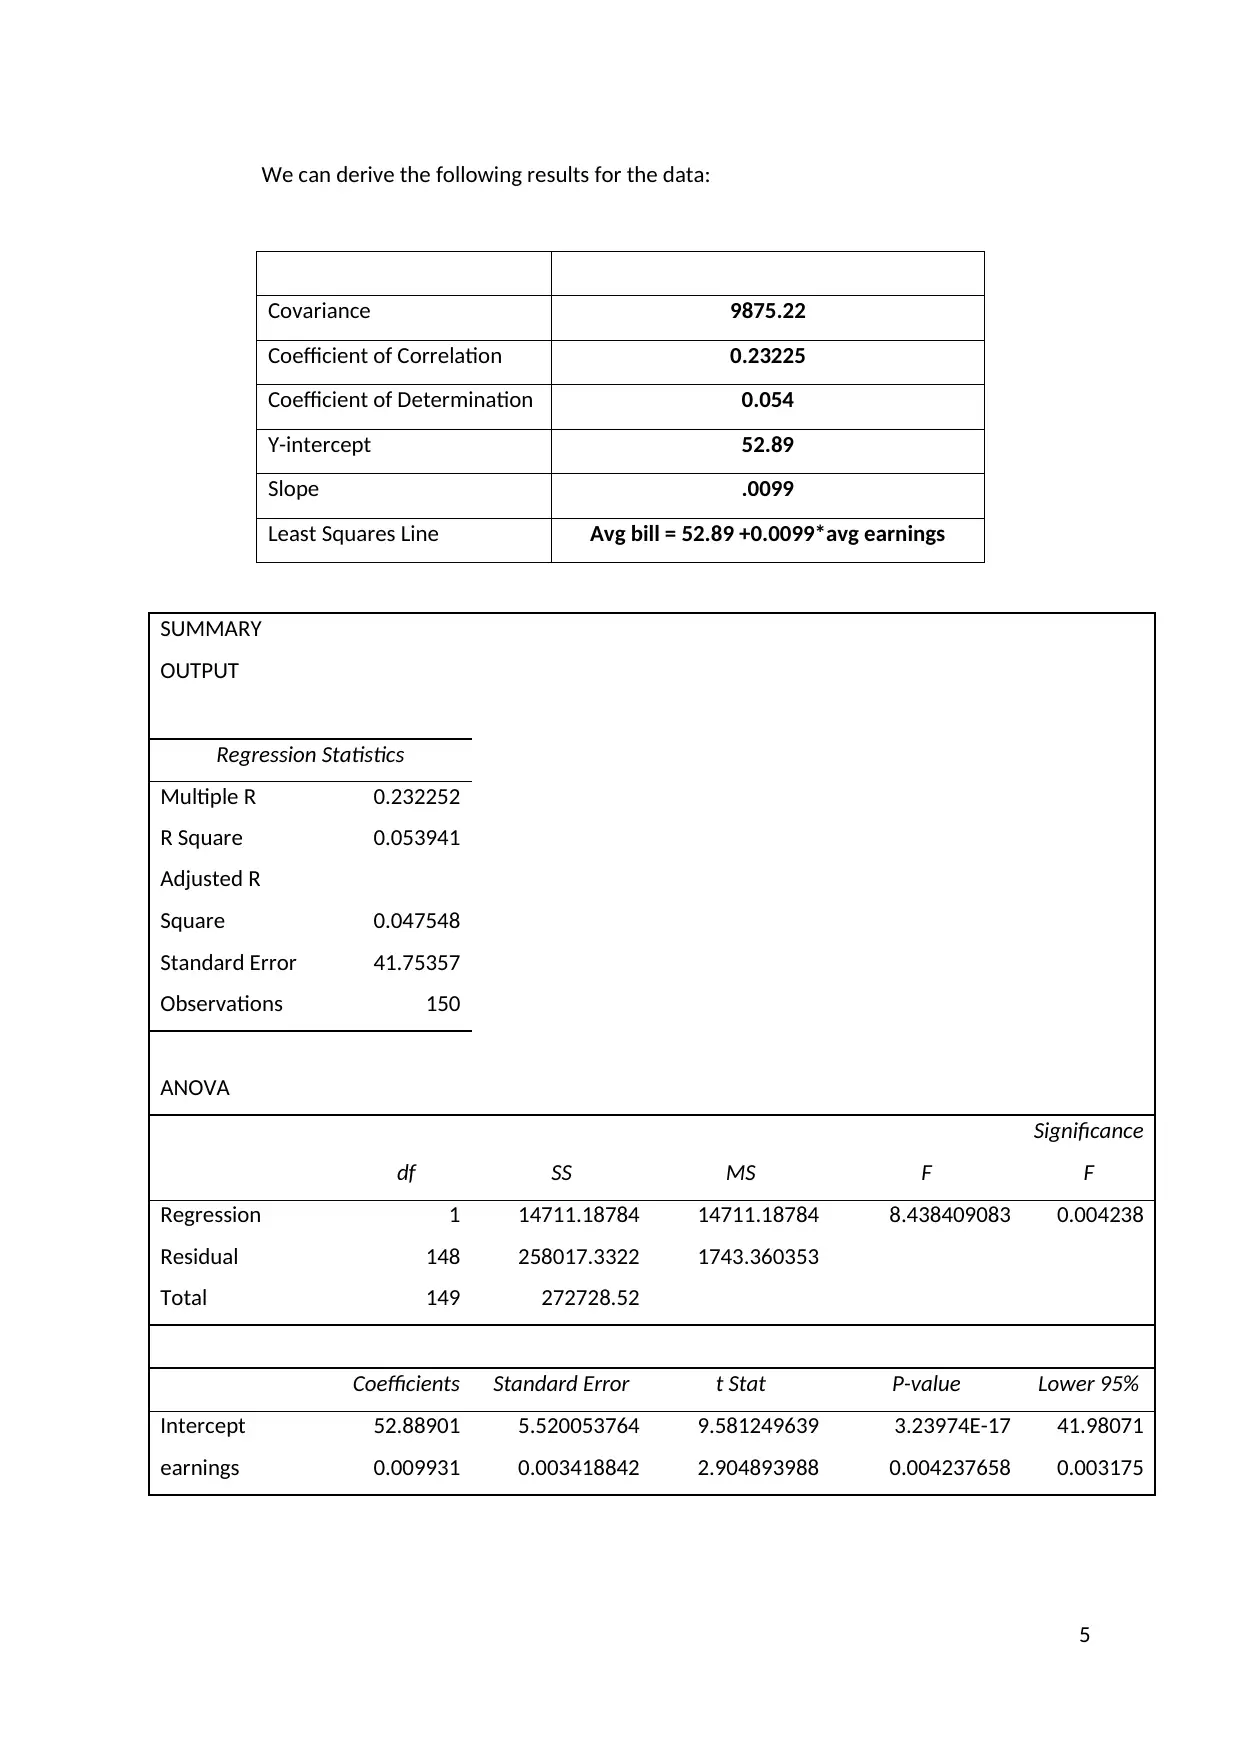
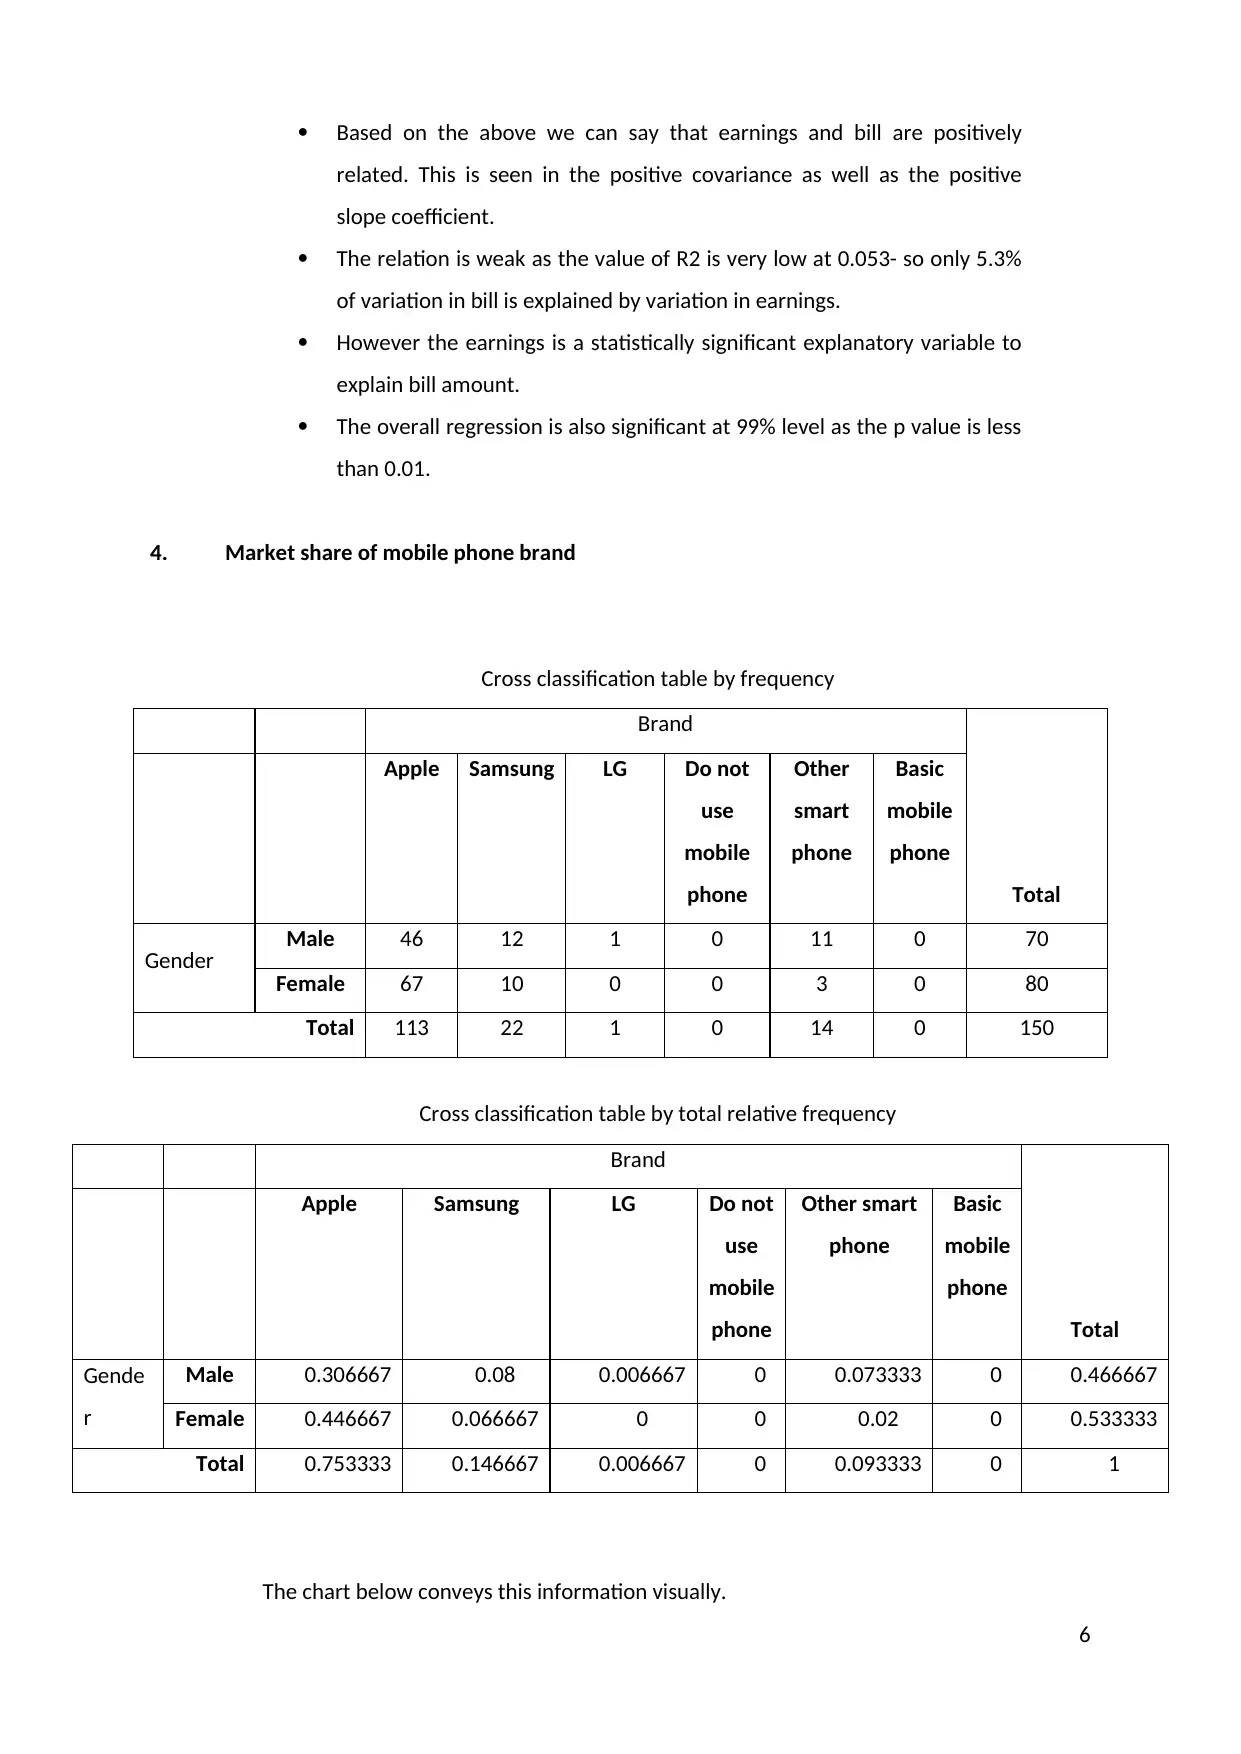
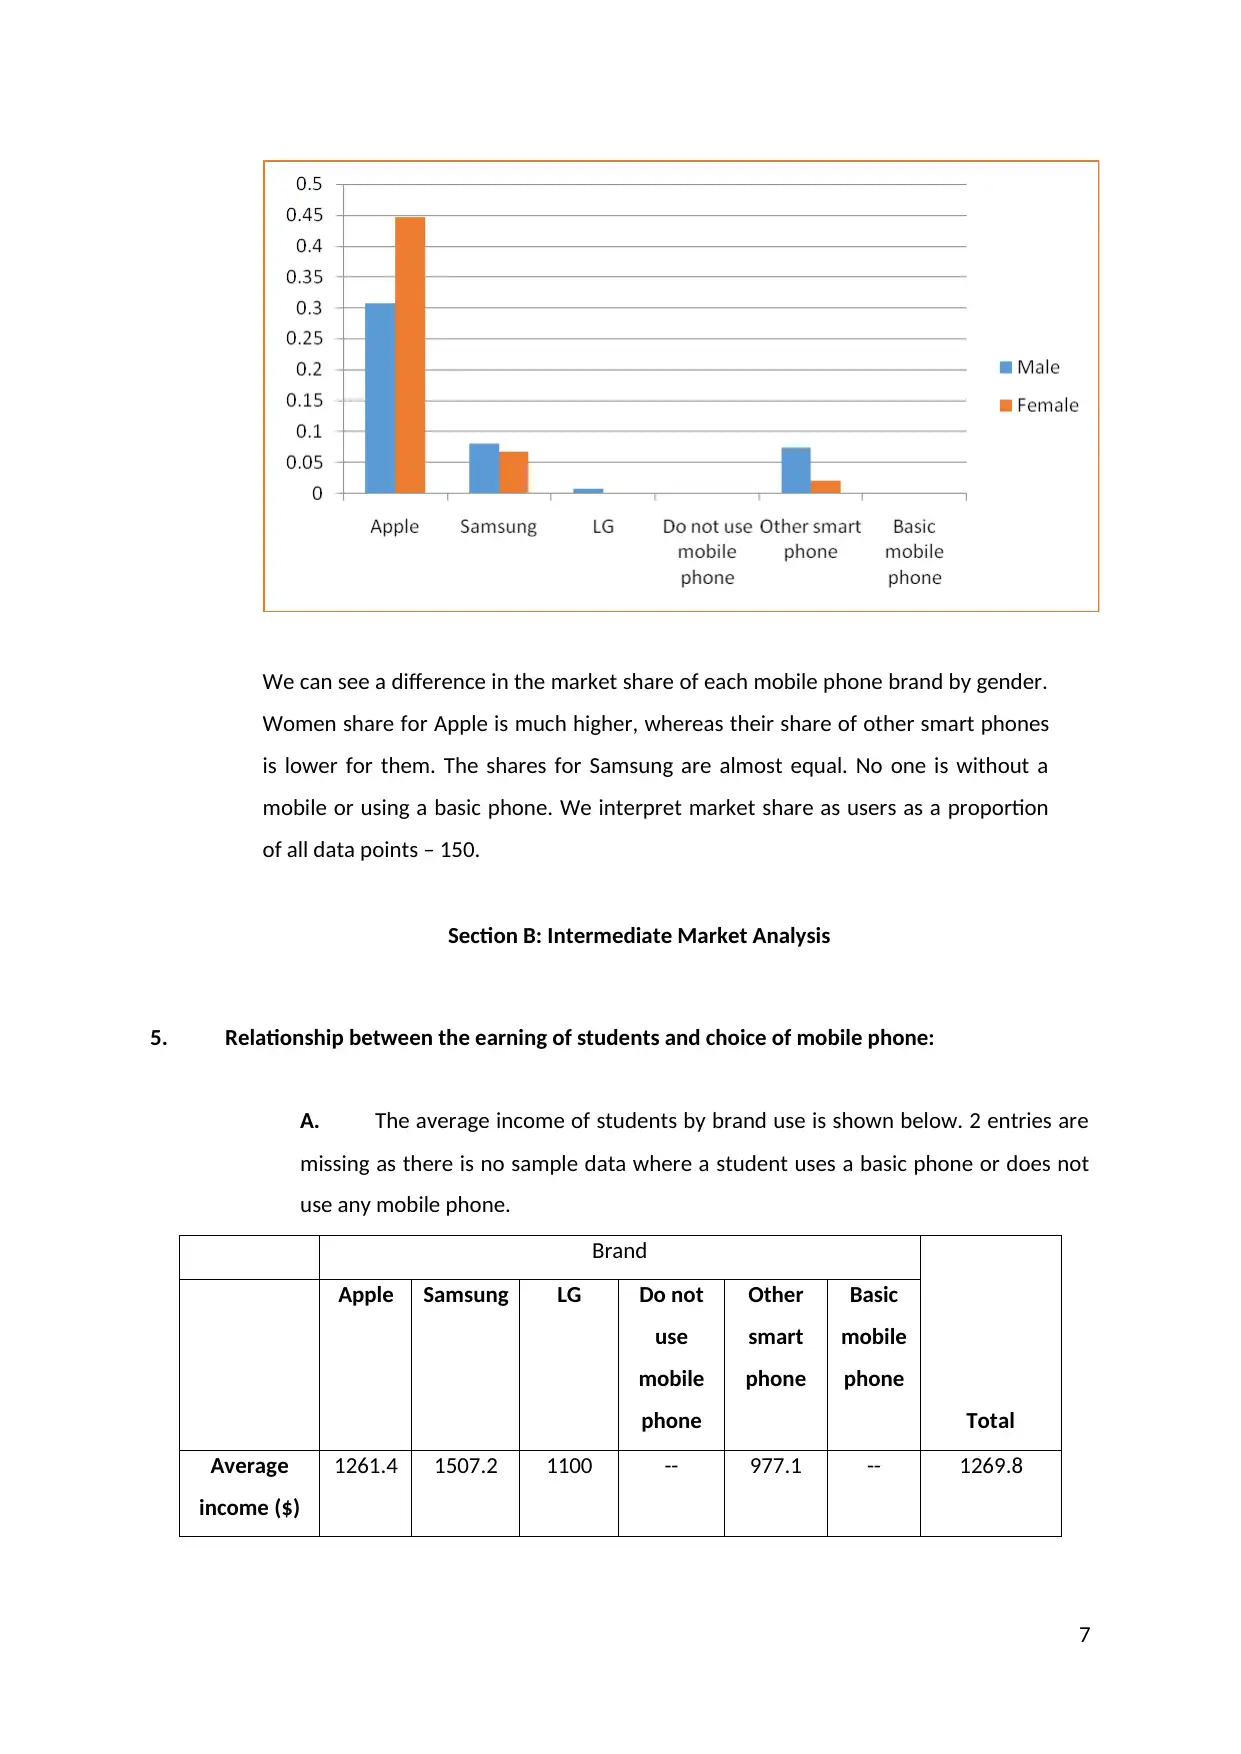
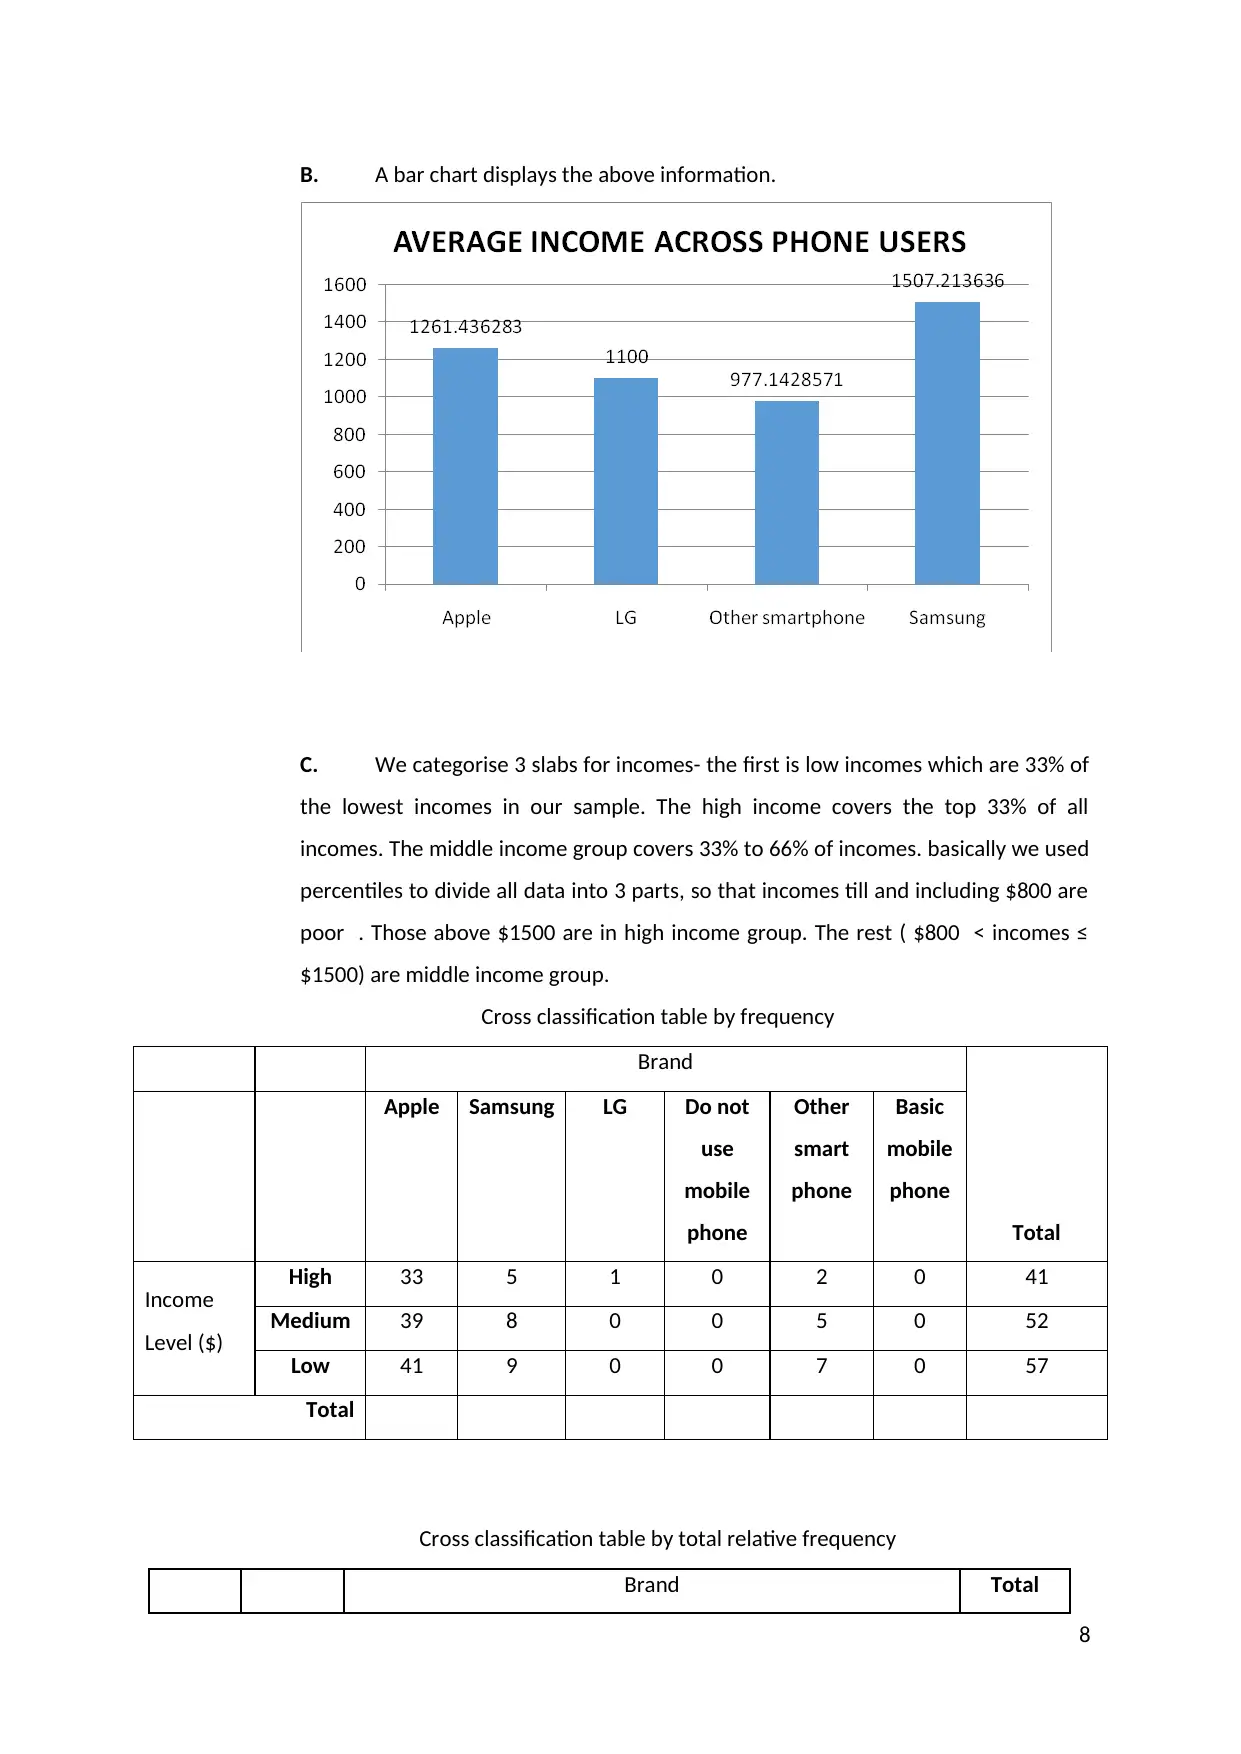
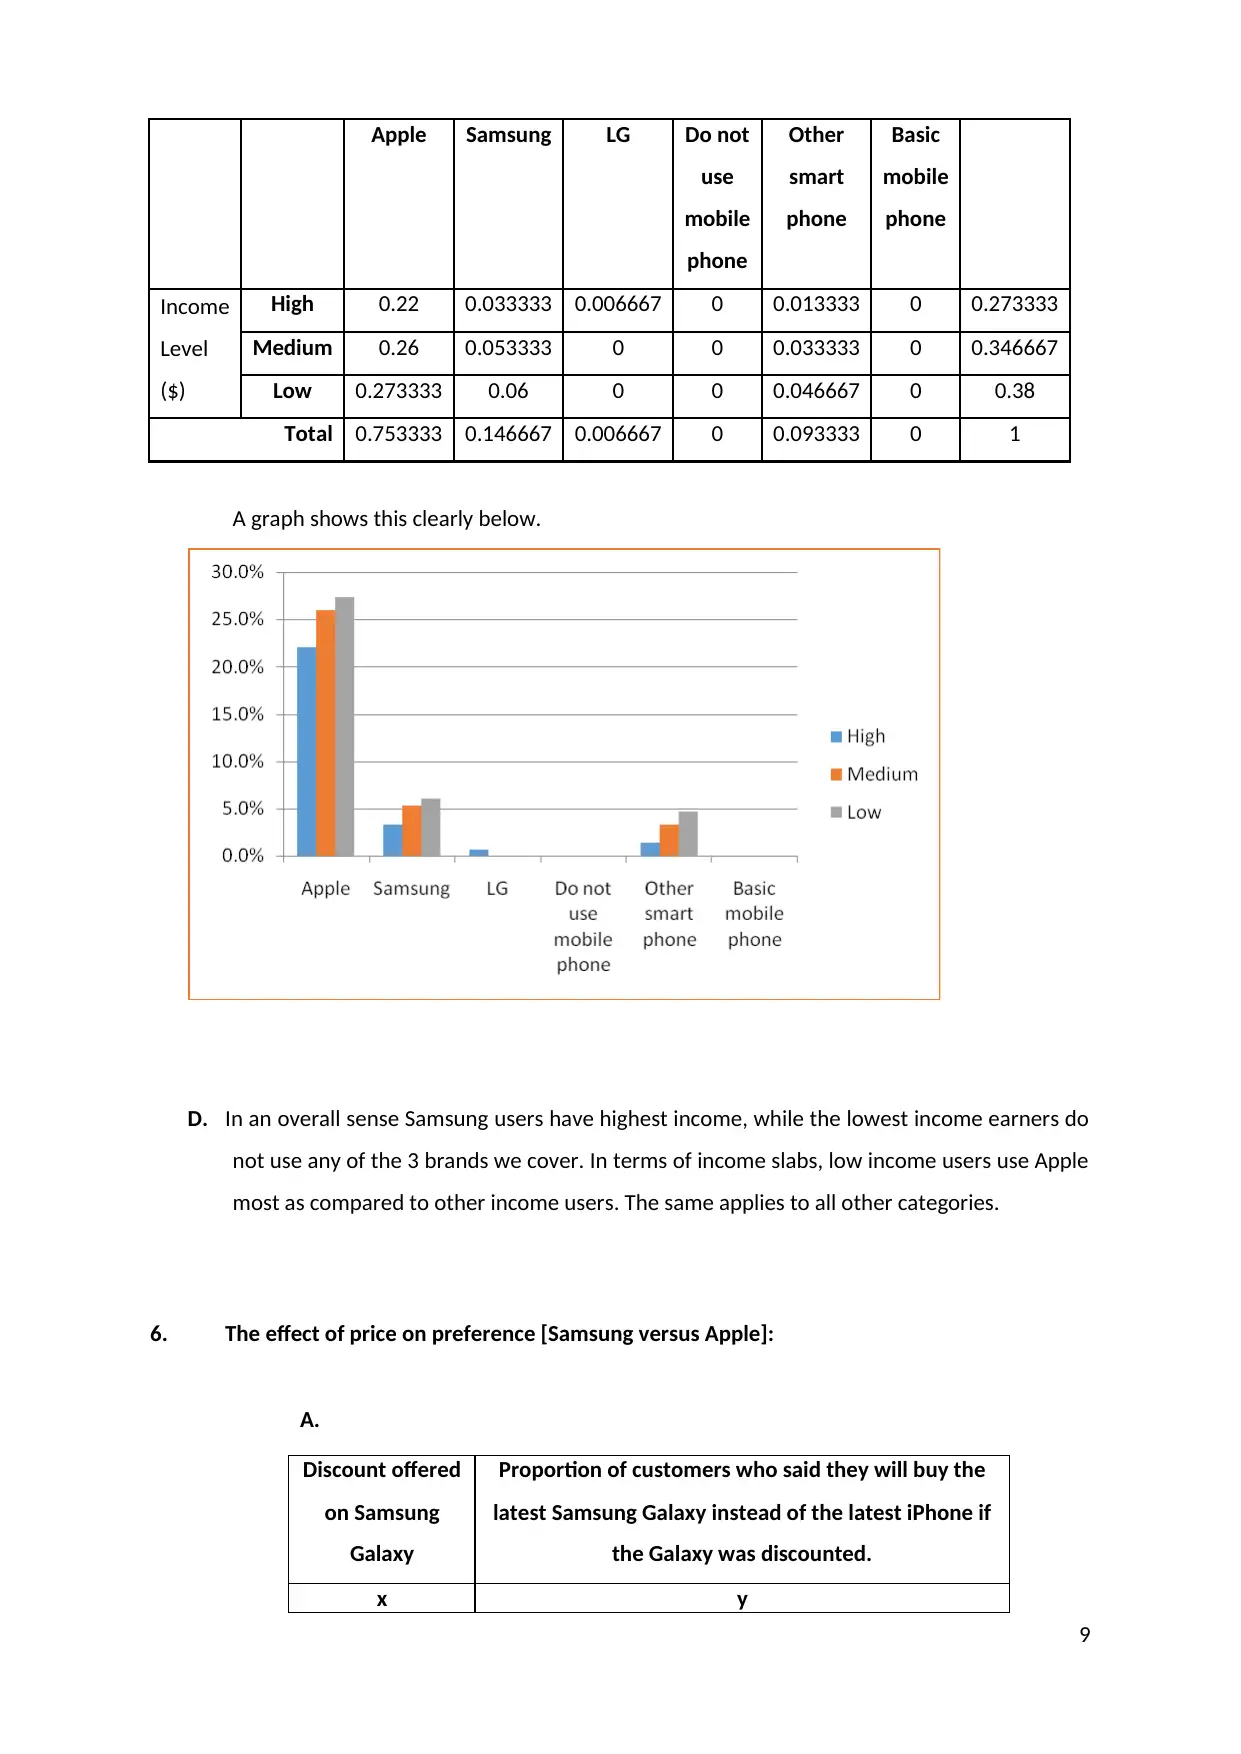
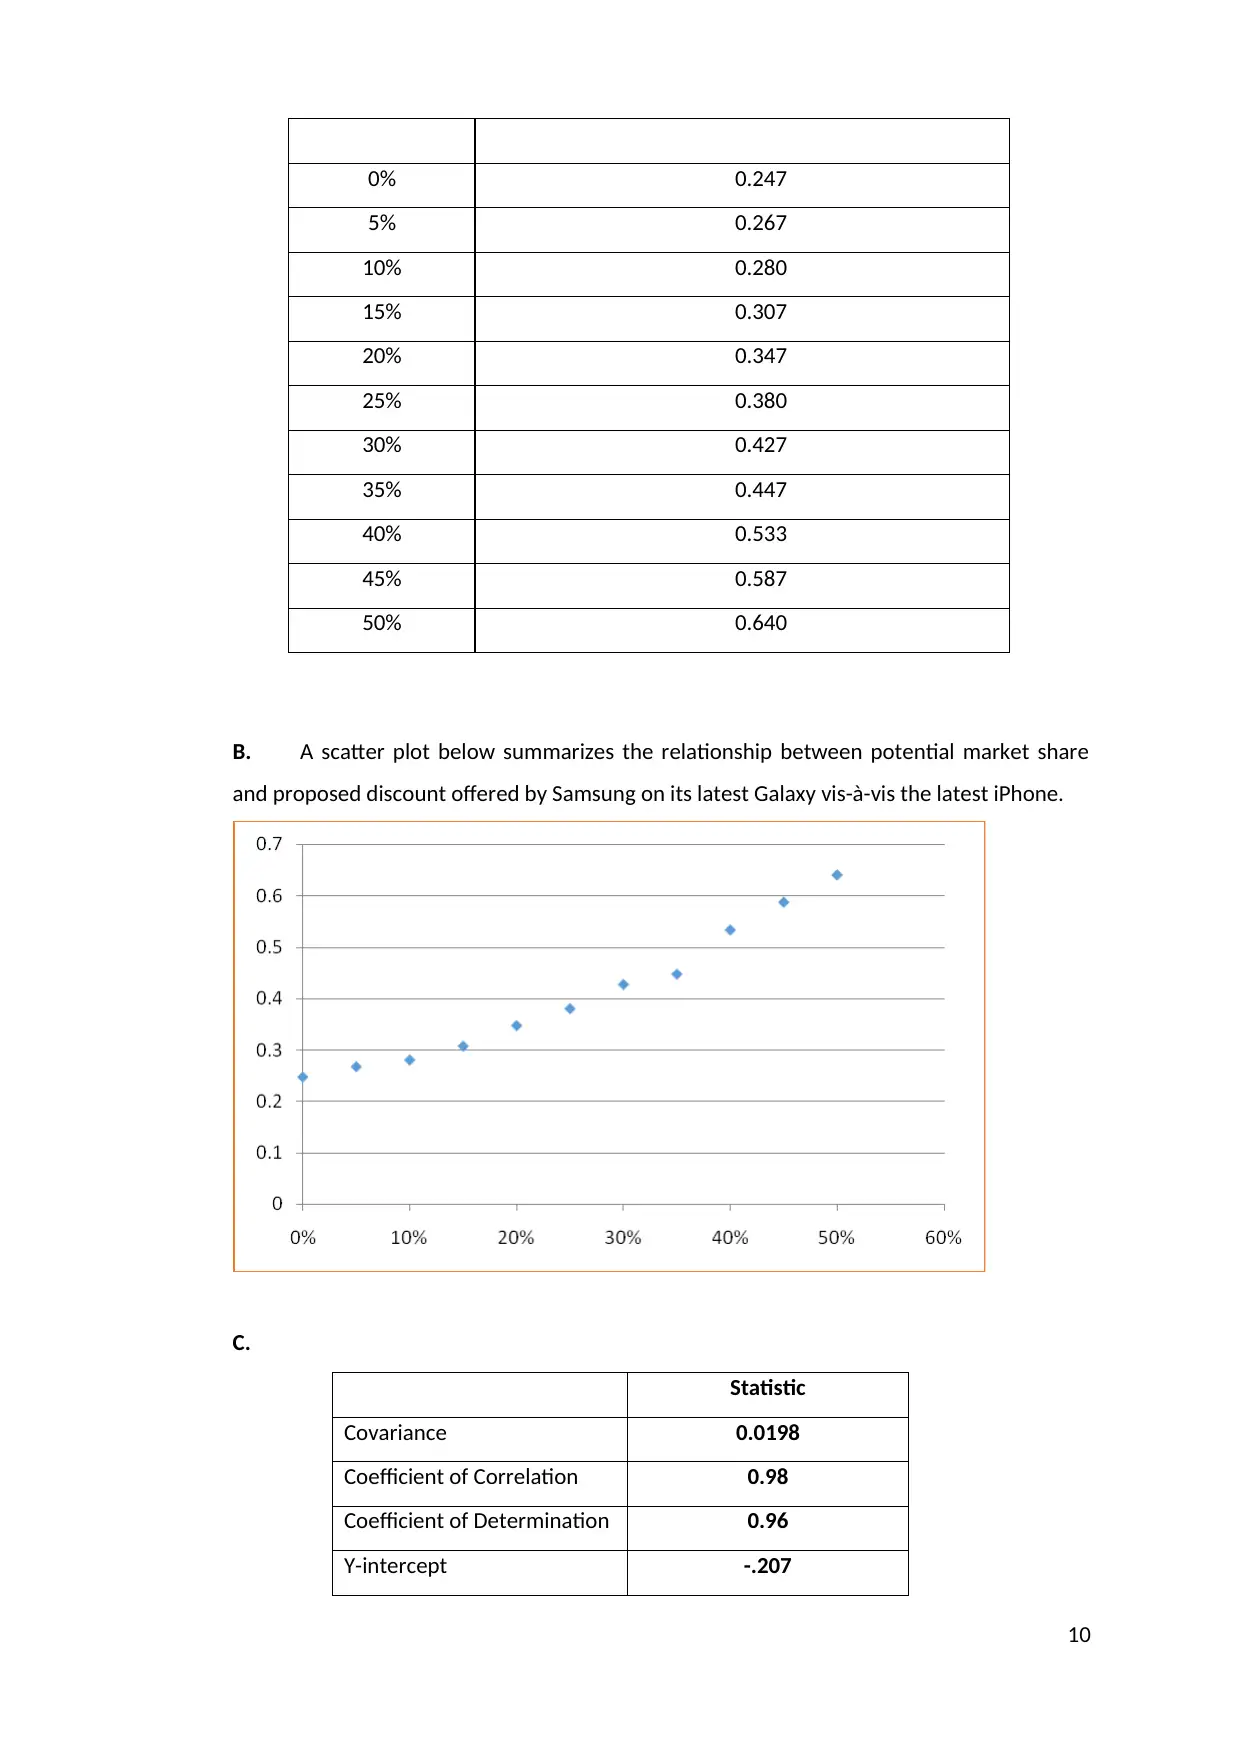
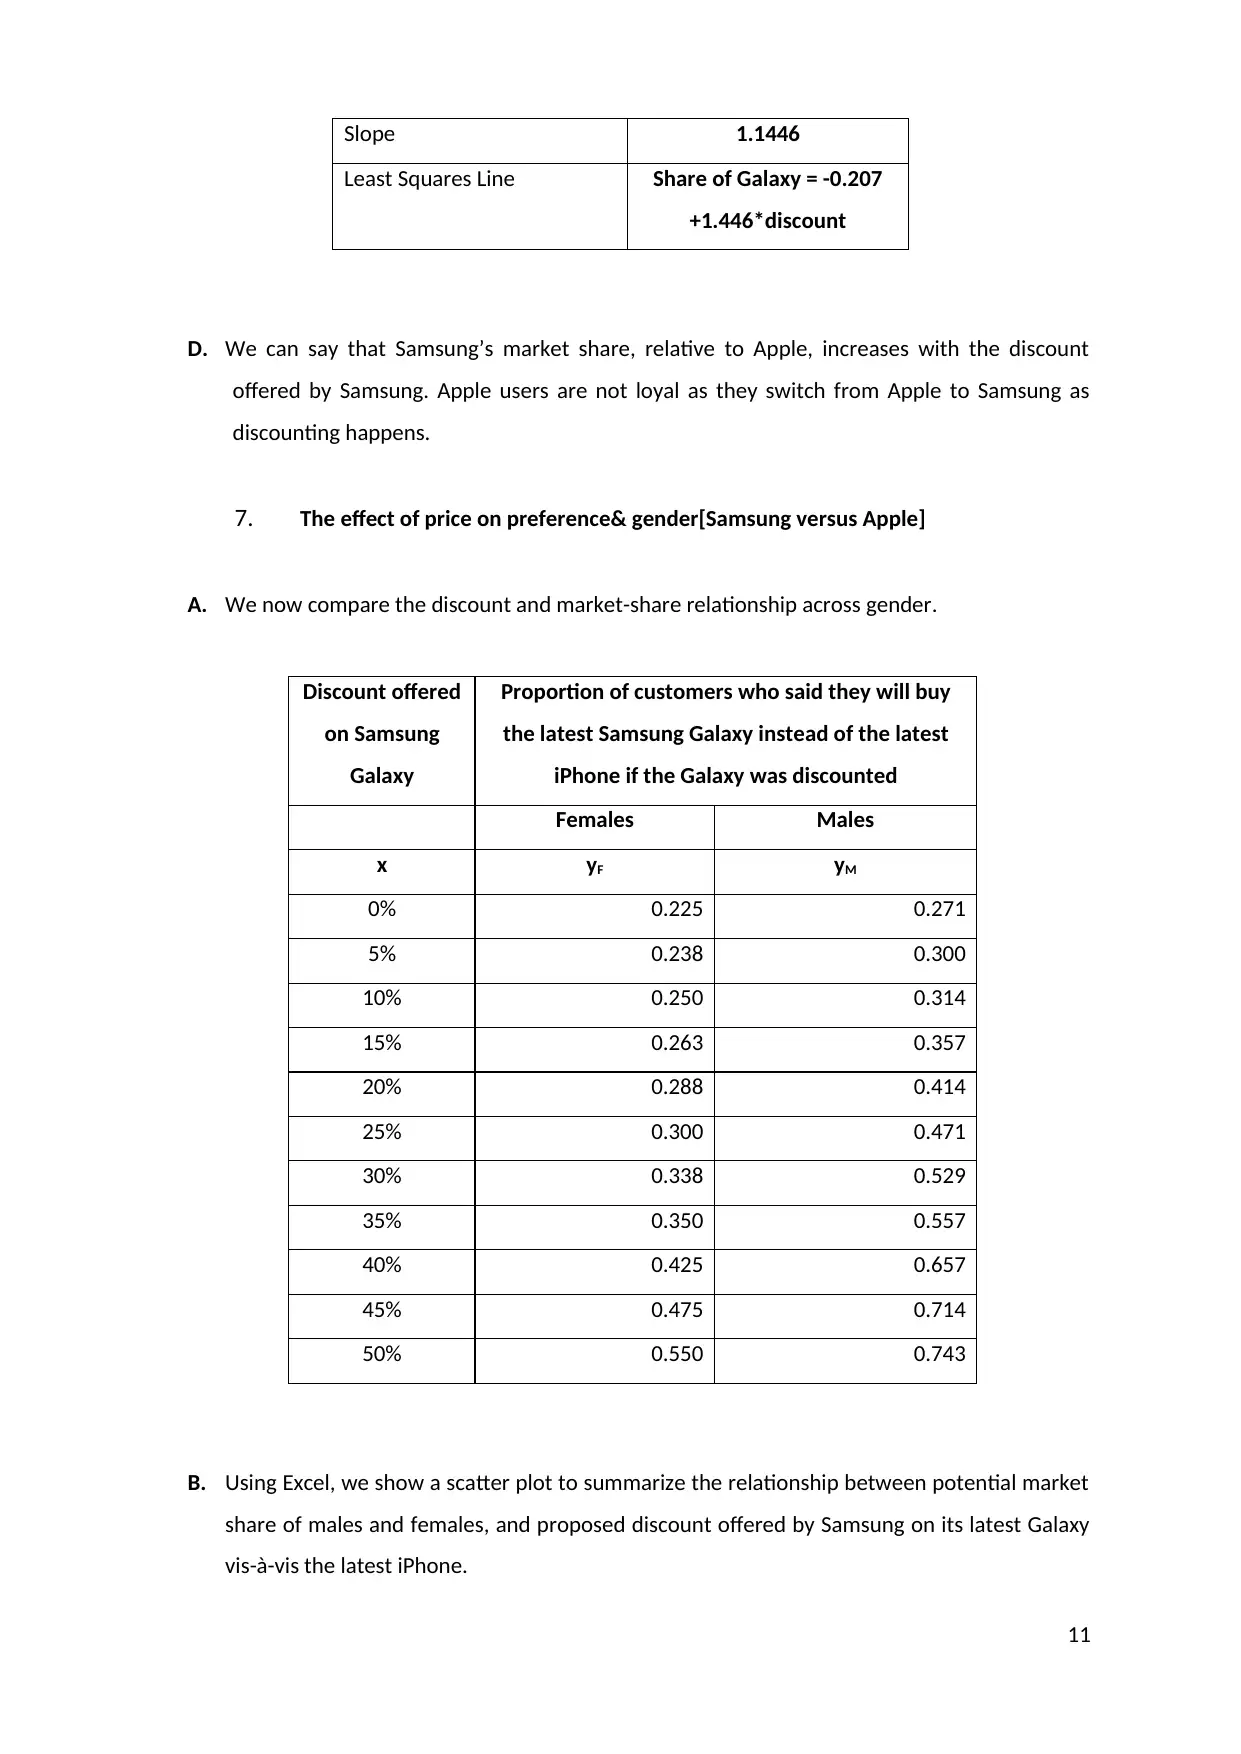
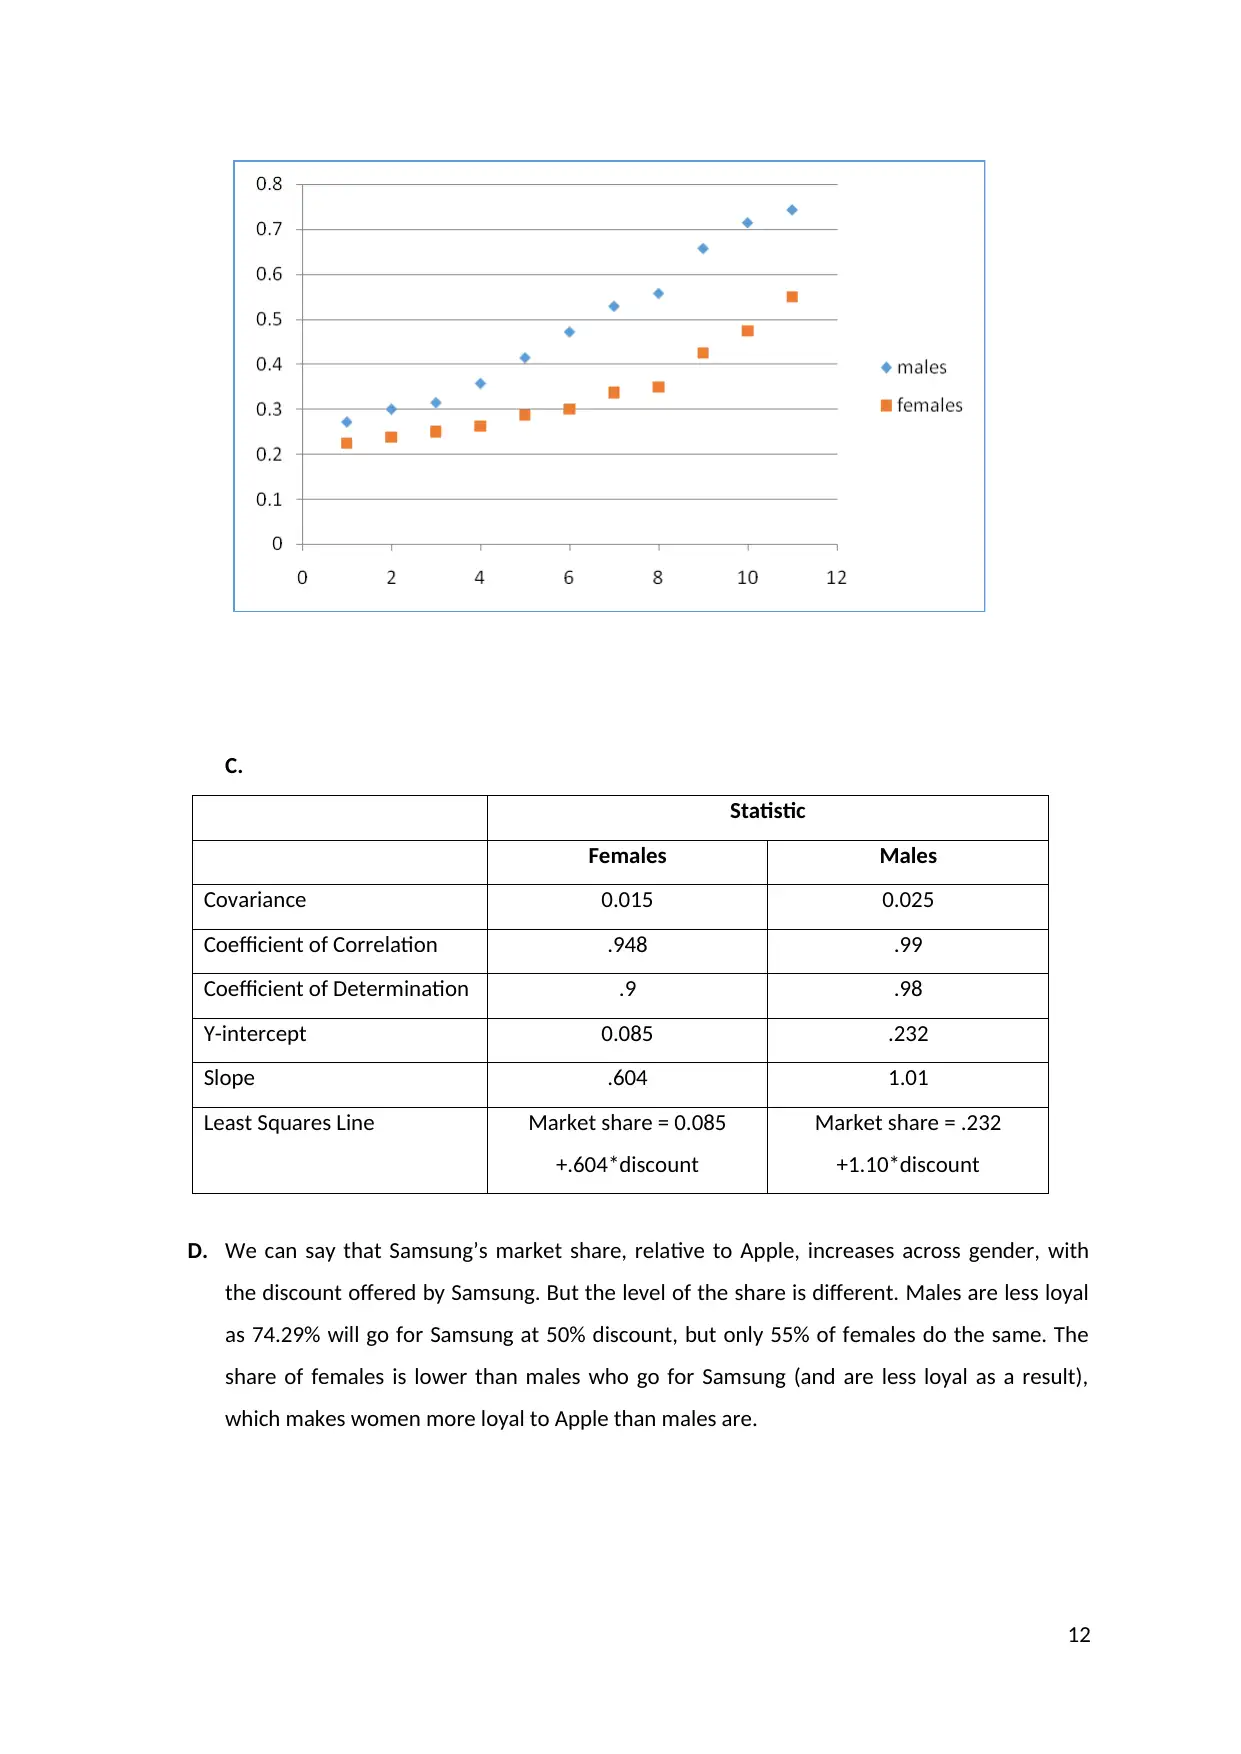
This report presents an analysis of student demand for smartphones at La Trobe University, based on a survey of BUS1BAN students. The study examines various aspects, including gender distribution, average monthly bills and earnings, market share of different smartphone brands (Apple, Samsung, LG), and the impact of price discounts on consumer preferences. The analysis employs statistical tools such as measures of central tendency, dispersion, correlation, confidence intervals, hypothesis testing, and regression analysis, supported by visual aids like pie charts, bar charts, scatter plots, and pivot charts. Key findings include the higher average bill and income for female students, Apple's dominance in the market with a 75% share, and the positive correlation between Samsung discounts and market share gain. The report also explores the loyalty patterns of students towards Apple and Samsung, and the use of confidence intervals and hypothesis testing to draw conclusions about the student population. The study concludes with a discussion on the implications of these findings for the smartphone market and the limitations of the self-selected data set.
tabler-icon-diamond-filled.svg

Contribute Materials

Your contribution can guide someone’s learning journey. Share your documents today.
Document Page
Cover Page
BUS1BAN Major Assignment
Teacher’s Name
Workshop Details
(Time, day, room)
StudentsID Number Students Name Student contribution*
(%)
e.g. 50% means the
student will receive 50%
of the marks awarded
Students Signature
1
tabler-icon-diamond-filled.svg

Secure Best Marks with AI Grader

Need help grading? Try our AI Grader for instant feedback on your assignments.
Document Page
An insight into student demand for smartphones at La Trobe University.
Project Title: AN INSIGHT INTO STUDENT DEMAND FOR SMART PHONES AT LA TROBE
UNIVERSITY.
Executive Summary
We use a sample of 150 from the data created by the survey taken by students online. This data
is rich in terms of phone usage, bill amount, income of users, gender and the willingness to shift
between Apple and Samsung Galaxy. The data is of students only and must be interpreted
accordingly. The main points are:
Income and bill amount of females are higher than men .
Most users use Apple ( 133/ 150)
Women are more loyal than men for Apple, as they are less willing to shift to Samsung
after discounts are given.
No one uses a basic phone- they all use a smart phone- which hints at its mass usage like
a necessity item.
Average income of Samsung user sis highest.
The share of Apple is higher than 4)% in line with results from other countries- the share
in our sample is very high at 75%
Introduction
The purpose of this project is to get insights into the student demand for smartphones at La
Trobe University. The study uses data from BUS1BAN students only. The method of choosing
and forming a data set is SELF SELECTION. Those who choose to take the survey are part of it.
All students may not be part of the data. For our results we use this large and raw data set to
derive a sample of size 150 using random sampling. The results must be interpreted on the
basis of sampling procedure used and accordingly may not apply to all students at LaTrobe.
We use Excel to answer a variety of questions pertaining to this data. We use concepts like measures
of central tendency, dispersion, correlation, confidence intervals , hypothesis testing, regression. We
use visual charts that include pie chart, bar chart, scatterplot, and pivot charts to aid in our analysis.
Using Excel tools and statistical concepts we can understand the distribution of quantitative data like
income and monthly bills of users.
2
Document Page
I. Data Analysis
Section A: Basic Analysis
1. Gender Proportion
Our sample has more females as compared to males
Gender Sample proportion
Female 53.33%
Male 46.67%
This is clear from the pie chart below
This implies that the sample is not neutral in terms of gender.
2. Average Monthly Bill
The average monthly bill of students by gender is shown below in the table as well as in
the bar chart.
Female Male
Average Monthly Bill ($) $69.33 $61.12
3
Document Page
The average monthly bill is higher for females than males by $8.21. this is also stated
as saying that females average bill is 13.4% higher than that of males.
3. Earnings and money spent on mobile phone:
The average monthly earning of students by gender is shown below in the table as well
as in the bar chart.
Female Male
Average Monthly Earnings ($) $1293.415 $1242.969
4
tabler-icon-diamond-filled.svg

Secure Best Marks with AI Grader

Need help grading? Try our AI Grader for instant feedback on your assignments.
Document Page
We can derive the following results for the data:
Covariance 9875.22
Coefficient of Correlation 0.23225
Coefficient of Determination 0.054
Y-intercept 52.89
Slope .0099
Least Squares Line Avg bill = 52.89 +0.0099*avg earnings
SUMMARY
OUTPUT
Regression Statistics
Multiple R 0.232252
R Square 0.053941
Adjusted R
Square 0.047548
Standard Error 41.75357
Observations 150
ANOVA
df SS MS F
Significance
F
Regression 1 14711.18784 14711.18784 8.438409083 0.004238
Residual 148 258017.3322 1743.360353
Total 149 272728.52
Coefficients Standard Error t Stat P-value Lower 95%
Intercept 52.88901 5.520053764 9.581249639 3.23974E-17 41.98071
earnings 0.009931 0.003418842 2.904893988 0.004237658 0.003175
5
Document Page
Based on the above we can say that earnings and bill are positively
related. This is seen in the positive covariance as well as the positive
slope coefficient.
The relation is weak as the value of R2 is very low at 0.053- so only 5.3%
of variation in bill is explained by variation in earnings.
However the earnings is a statistically significant explanatory variable to
explain bill amount.
The overall regression is also significant at 99% level as the p value is less
than 0.01.
4. Market share of mobile phone brand
Cross classification table by frequency
Brand
Total
Apple Samsung LG Do not
use
mobile
phone
Other
smart
phone
Basic
mobile
phone
Gender Male 46 12 1 0 11 0 70
Female 67 10 0 0 3 0 80
Total 113 22 1 0 14 0 150
Cross classification table by total relative frequency
Brand
Total
Apple Samsung LG Do not
use
mobile
phone
Other smart
phone
Basic
mobile
phone
Gende
r
Male 0.306667 0.08 0.006667 0 0.073333 0 0.466667
Female 0.446667 0.066667 0 0 0.02 0 0.533333
Total 0.753333 0.146667 0.006667 0 0.093333 0 1
The chart below conveys this information visually.
6
Document Page
We can see a difference in the market share of each mobile phone brand by gender.
Women share for Apple is much higher, whereas their share of other smart phones
is lower for them. The shares for Samsung are almost equal. No one is without a
mobile or using a basic phone. We interpret market share as users as a proportion
of all data points – 150.
Section B: Intermediate Market Analysis
5. Relationship between the earning of students and choice of mobile phone:
A. The average income of students by brand use is shown below. 2 entries are
missing as there is no sample data where a student uses a basic phone or does not
use any mobile phone.
Brand
Total
Apple Samsung LG Do not
use
mobile
phone
Other
smart
phone
Basic
mobile
phone
Average
income ($)
1261.4 1507.2 1100 -- 977.1 -- 1269.8
7
tabler-icon-diamond-filled.svg

Paraphrase This Document

Need a fresh take? Get an instant paraphrase of this document with our AI Paraphraser
Document Page
B. A bar chart displays the above information.
C. We categorise 3 slabs for incomes- the first is low incomes which are 33% of
the lowest incomes in our sample. The high income covers the top 33% of all
incomes. The middle income group covers 33% to 66% of incomes. basically we used
percentiles to divide all data into 3 parts, so that incomes till and including $800 are
poor . Those above $1500 are in high income group. The rest ( $800 < incomes ≤
$1500) are middle income group.
Cross classification table by frequency
Brand
Total
Apple Samsung LG Do not
use
mobile
phone
Other
smart
phone
Basic
mobile
phone
Income
Level ($)
High 33 5 1 0 2 0 41
Medium 39 8 0 0 5 0 52
Low 41 9 0 0 7 0 57
Total
Cross classification table by total relative frequency
Brand Total
8
Document Page
Apple Samsung LG Do not
use
mobile
phone
Other
smart
phone
Basic
mobile
phone
Income
Level
($)
High 0.22 0.033333 0.006667 0 0.013333 0 0.273333
Medium 0.26 0.053333 0 0 0.033333 0 0.346667
Low 0.273333 0.06 0 0 0.046667 0 0.38
Total 0.753333 0.146667 0.006667 0 0.093333 0 1
A graph shows this clearly below.
D. In an overall sense Samsung users have highest income, while the lowest income earners do
not use any of the 3 brands we cover. In terms of income slabs, low income users use Apple
most as compared to other income users. The same applies to all other categories.
6. The effect of price on preference [Samsung versus Apple]:
A.
Discount offered
on Samsung
Galaxy
Proportion of customers who said they will buy the
latest Samsung Galaxy instead of the latest iPhone if
the Galaxy was discounted.
x y
9
Document Page
0% 0.247
5% 0.267
10% 0.280
15% 0.307
20% 0.347
25% 0.380
30% 0.427
35% 0.447
40% 0.533
45% 0.587
50% 0.640
B. A scatter plot below summarizes the relationship between potential market share
and proposed discount offered by Samsung on its latest Galaxy vis-à-vis the latest iPhone.
C.
Statistic
Covariance 0.0198
Coefficient of Correlation 0.98
Coefficient of Determination 0.96
Y-intercept -.207
10
tabler-icon-diamond-filled.svg

Secure Best Marks with AI Grader

Need help grading? Try our AI Grader for instant feedback on your assignments.
Document Page
Slope 1.1446
Least Squares Line Share of Galaxy = -0.207
+1.446*discount
D. We can say that Samsung’s market share, relative to Apple, increases with the discount
offered by Samsung. Apple users are not loyal as they switch from Apple to Samsung as
discounting happens.
7. The effect of price on preference& gender[Samsung versus Apple]
A. We now compare the discount and market-share relationship across gender.
Discount offered
on Samsung
Galaxy
Proportion of customers who said they will buy
the latest Samsung Galaxy instead of the latest
iPhone if the Galaxy was discounted
Females Males
x yF yM
0% 0.225 0.271
5% 0.238 0.300
10% 0.250 0.314
15% 0.263 0.357
20% 0.288 0.414
25% 0.300 0.471
30% 0.338 0.529
35% 0.350 0.557
40% 0.425 0.657
45% 0.475 0.714
50% 0.550 0.743
B. Using Excel, we show a scatter plot to summarize the relationship between potential market
share of males and females, and proposed discount offered by Samsung on its latest Galaxy
vis-à-vis the latest iPhone.
11
Document Page
C.
Statistic
Females Males
Covariance 0.015 0.025
Coefficient of Correlation .948 .99
Coefficient of Determination .9 .98
Y-intercept 0.085 .232
Slope .604 1.01
Least Squares Line Market share = 0.085
+.604*discount
Market share = .232
+1.10*discount
D. We can say that Samsung’s market share, relative to Apple, increases across gender, with
the discount offered by Samsung. But the level of the share is different. Males are less loyal
as 74.29% will go for Samsung at 50% discount, but only 55% of females do the same. The
share of females is lower than males who go for Samsung (and are less loyal as a result),
which makes women more loyal to Apple than males are.
12
Document Page
Section C: Advance scenarios
8. Confidence intervals:
a.
Female Male
Sample proportion () 0.533 .467
i.Females
Confidence interval is 0.533 ± 1.96*((.533*.467)/80)^.5 = ( .424, .642)
ii.Males.
Confidence interval is 0.467 ± 1.96*((.533*.467)/70)^.5 = ( .35, .584)
b. There is 100% chance that the student will be using a smartphone. A
99% interval estimate is
1± 2.33*(1*0/150)^.5 = 1
Ther is no interval here as we are 100% sure that no one uses a basic
phone.
Smart phone users
Sample proportion 1
9. Confidence intervals
A. What is the average monthly earnings of male and female students at La Trobe?
Female Male
Average Monthly
Earnings ($)
1293.4 1242.97
13
tabler-icon-diamond-filled.svg

Paraphrase This Document

Need a fresh take? Get an instant paraphrase of this document with our AI Paraphraser
Document Page
B. Provide 95% interval estimates for each gender, show the confidence intervals graphically,
and interpret your answer.
i.Females 1293.4 ± 1.96*(100.65) = ( 1096.1, 1490.7)
There is 95% chance that average monthly income of females will lie between
$1096.1 and $1490.7
ii. Males. 1242.97 ± 1.96*132.6852 = ( 982.9, 1503.031) .
There is 95% chance that average monthly income of males will lie between $ 982.9
and $1503.031. this interval is wider ( and less accurate) than for women.
10. Hypothesis Testing
Sample proportion= 113/150 = 0.753
Step 1: Hypothesis setting
Ho: P= 0.4
H1: p >0.4
Step 2:
Test value = (.753-.4)/(.4*.6/150)^.5 = 8.83
Step 3:
P value = P( z > 8.83) =0
Step 4:
As p value < 0.05 and 0.01 and .1, we reject null hypothesis
Step 5:
There is statistical support that market share of iPhone is more than 40% of the US
market.
14
Document Page
II. Summary and discussion
We can talk about many parameters based on the data given to us:
The share of women is higher than for male users.
The average income and bill amounts are also higher for females.
There are differences in the loyalty pattern with females being more loyal to Apple than
males.
The dominance of Apple is established with 75% market share
The use of smart phones is universal.
The relation between discounts and share of Samsung is strong and positive, which tells us
that discounting maybe good for Samsung to wean away users from Apple. Discounts is an
overwhelming 99% of the reason for shifting away from Apple.
The sampling method here is two stage one. First students are told to fill the questionnaire online.
Then out of those who have filled we use random sampling to get a sample of 150 size. These
results can be generalised to only those who took the survey. Those who ‘chose’ not to take the
survey are left out. Self selection of participants was the first step which leaves out those who
chose not to be a part of this survey.
To make the survey results representative of ALL La Trobe students we can use proportional or
stratified sampling where the strata are in terms of different courses. This will give a more
representative data rather than a self selected data set.
15
Document Page
BIBILIOGRAPHY
Anon., n.d. Hypothesis Testing. [Online] Available
athttps://onlinecourses.science.psu.edu/statprogram/node/138 [Accessed 3 Oct 2017].
Anon., n.d. Mean, median, mode. [Online] Available
athttp://www.bbc.co.uk/schools/gcsebitesize/maths/statistics/measuresofaveragerev6.shtml
[Accessed 8 Oct 2017].
Cumming, G., 2010. Understanding, teaching and using p values. [Online]
https://iase-web.org/documents/papers/icots8/ICOTS8_8J4_CUMMING.pdf [Accessed 8 Oct
2017].
Home.iitk.ac.in, n.d. Regression analysis. [Online] Available at:
http://home.iitk.ac.in/~shalab/regression/Chapter2-Regression-
SimpleLinearRegressionAnalysis.pdf [Accessed 6 Oct 2017].
Itl.nist.gov, n.d. What are confidence intervals. [Online] Available at
http://www.itl.nist.gov/div898/handbook/prc/section1/prc14.htm [Accessed 14 Oct 2017].
Rgs.org, n.d. Sampling techniques. [Online] Available
athttp://www.rgs.org/OurWork/Schools/Fieldwork+and+local+learning/Fieldwork+techniques/
Sampling+techniques.htm [Accessed 15 Oct 2017].
stat.ualberta.ca, n.d. What isa P value. [Online] Available
athttp://www.stat.ualberta.ca/~hooper/teaching/misc/Pvalue.pdf [Accessed 10 Oct 2017].
stat.yale.edu, n.d. Sampliing in Statistical Inference. [Online] Available
athttp://www.stat.yale.edu/Courses/1997-98/101/sampinf.htm [Accessed 15 Oct 2017].
16
chevron_up_icon
1 out of 16
circle_padding
hide_on_mobile
zoom_out_icon
logo.png

Your All-in-One AI-Powered Toolkit for Academic Success.

Available 24*7 on WhatsApp / Email

[object Object]