Arden University: BUS5004 Business Analysis Report, Semester 1
VerifiedAdded on 2023/06/08
|15
|4871
|447
Report
AI Summary
This report provides a detailed business analysis, addressing key concepts such as population and sampling techniques, including probability and non-probability sampling methods. It explores the differences between primary and secondary data, outlining their respective advantages and disadvantages. The report further delves into statistical analysis, covering mean, mode, and standard deviation. Finally, it examines the significance of a Management Information System (MIS) within a business context. The analysis is structured to provide insights into data collection, analysis, and the application of these concepts to business decision-making. The report includes a detailed discussion of the advantages and disadvantages of various data collection methods, and explains the application of statistical measures.

Business Analysis
Paraphrase This Document
Need a fresh take? Get an instant paraphrase of this document with our AI Paraphraser
Table of Contents
MAIN BODY..................................................................................................................................3
Question 1........................................................................................................................................3
Population and Sampling.............................................................................................................3
Question 2........................................................................................................................................6
Differences between primary and secondary data.......................................................................6
Advantages and disadvantages of primary and secondary data...................................................8
Question 3......................................................................................................................................10
Mean, mode and standard deviation..........................................................................................10
Question 4......................................................................................................................................12
Management Information System..............................................................................................12
REFERENCES................................................................................................................................1
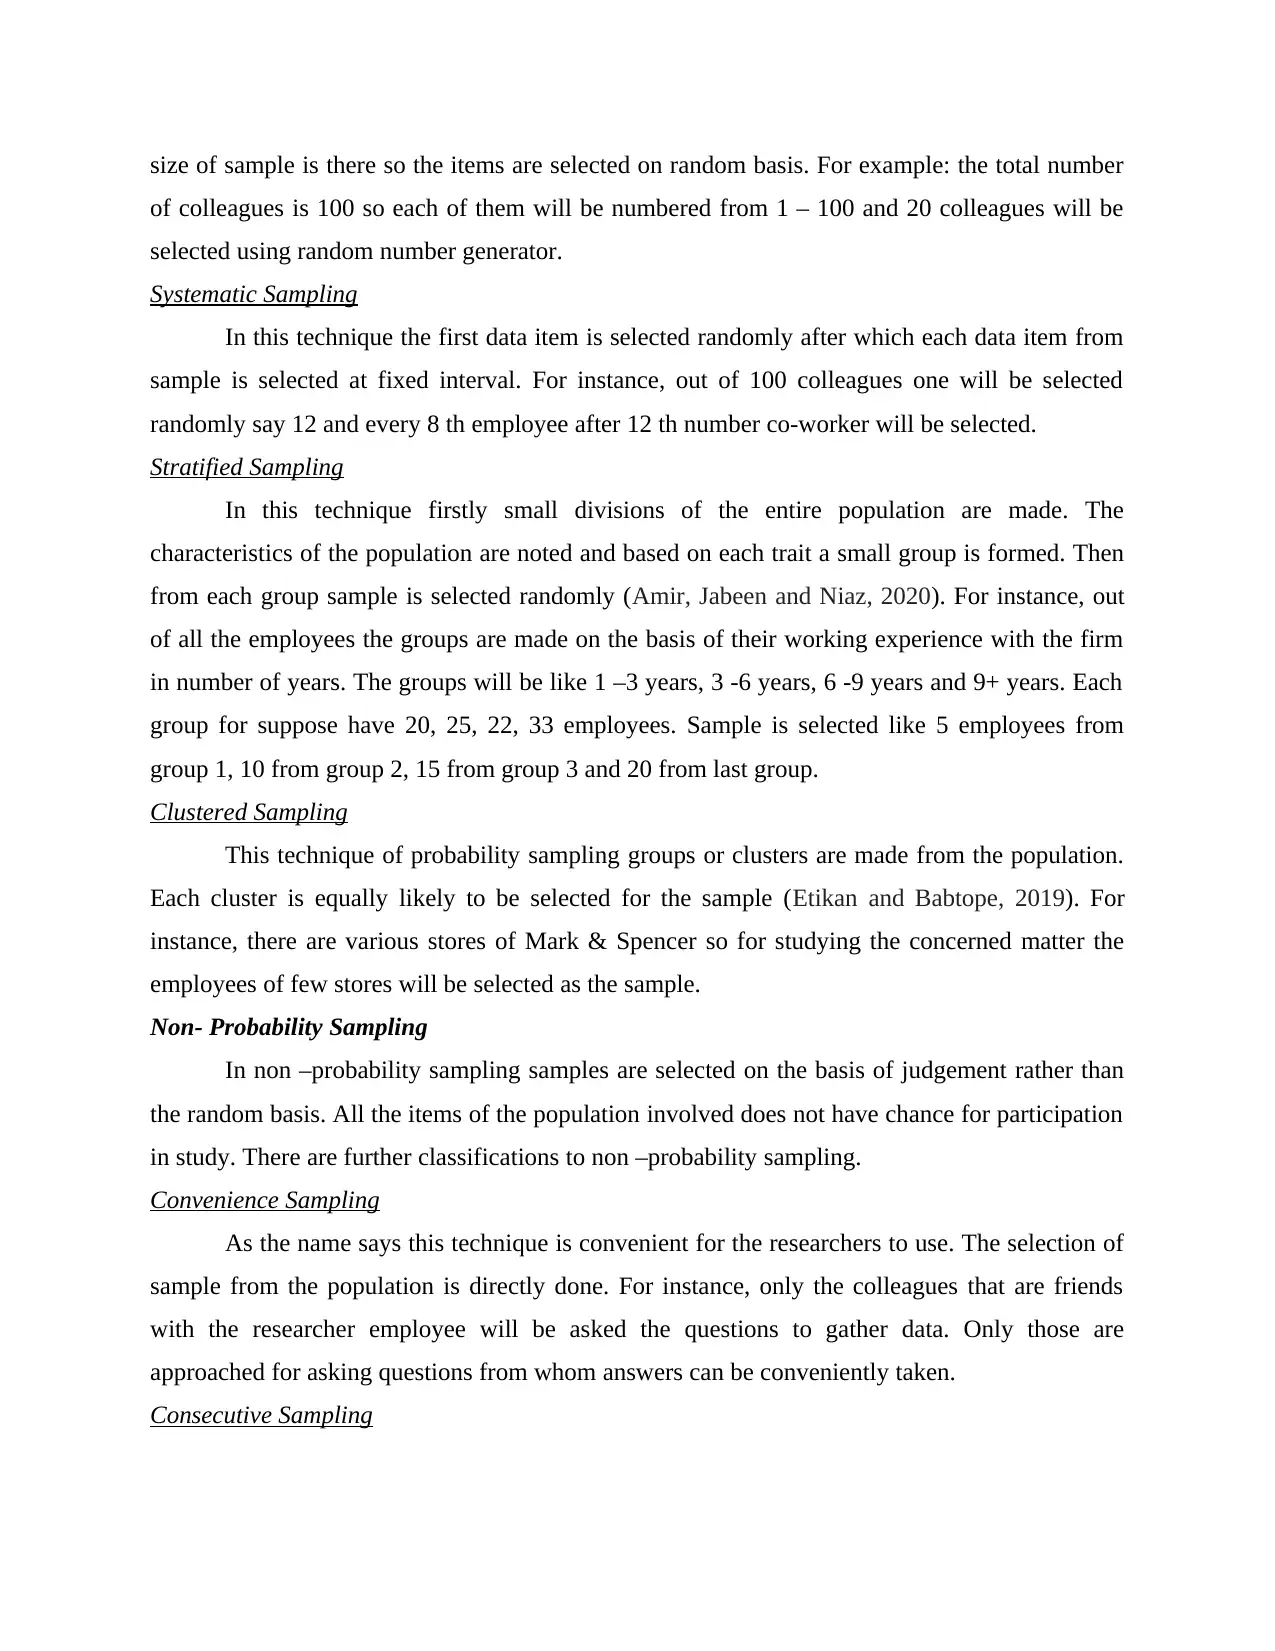
MAIN BODY
Question 1
Population and Sampling
Population
It is used to refer to the complete set of objects involving which conclusions will be
formed for conducting a statistical study (Berndt, 2020). The pool of data for a study is called
population. The data in which one is interested for their studies is known as population. The
given scenario of survey of employees over the possibility to extent the working day and
working hours by Marks & Spencer company will have the total number of employees working
within the organization at all levels as the population of the survey.
Population is of high significance whenever a survey is being conducted. It is important
in order to understand the population that is to be targeted for the survey. Populations states the
data that will be referred to during the entire study. If the clarity regarding the population of
study is absent then the researcher will end up in collecting wrong data and the entire study will
fail in meeting its objectives. Hence it is of great significance.
Sampling Techniques
Sampling techniques refers to the process that will be followed during the research for
studying the target set out of the population. Study is done by information collection and analysis
of collected data. Sampling techniques are broadly classified into two probability sampling and
non- probability sampling.
Probability sampling
In probability sampling items are selected on random basis. There exists chance for each
eligible data item to be selected from the population. The probability sampling methods
consumes more time and high cost is incurred as compared to non- probability sampling
(Oribhabor and Anyanwu, 2019). The main advantage of this is that there is surety that the
selected sample will effectively represent the entire population. There are further more
bifurcations to this types of sampling technique, these are:
Simple Random Sampling
In this type of sampling every item exist in
the population is equally likely to selected in sample. The other name given to this technique is
method of chance selection. In simple random or representative sampling techniques the large
⊘ This is a preview!⊘
Do you want full access?
Subscribe today to unlock all pages.
Trusted by 1+ million students worldwide
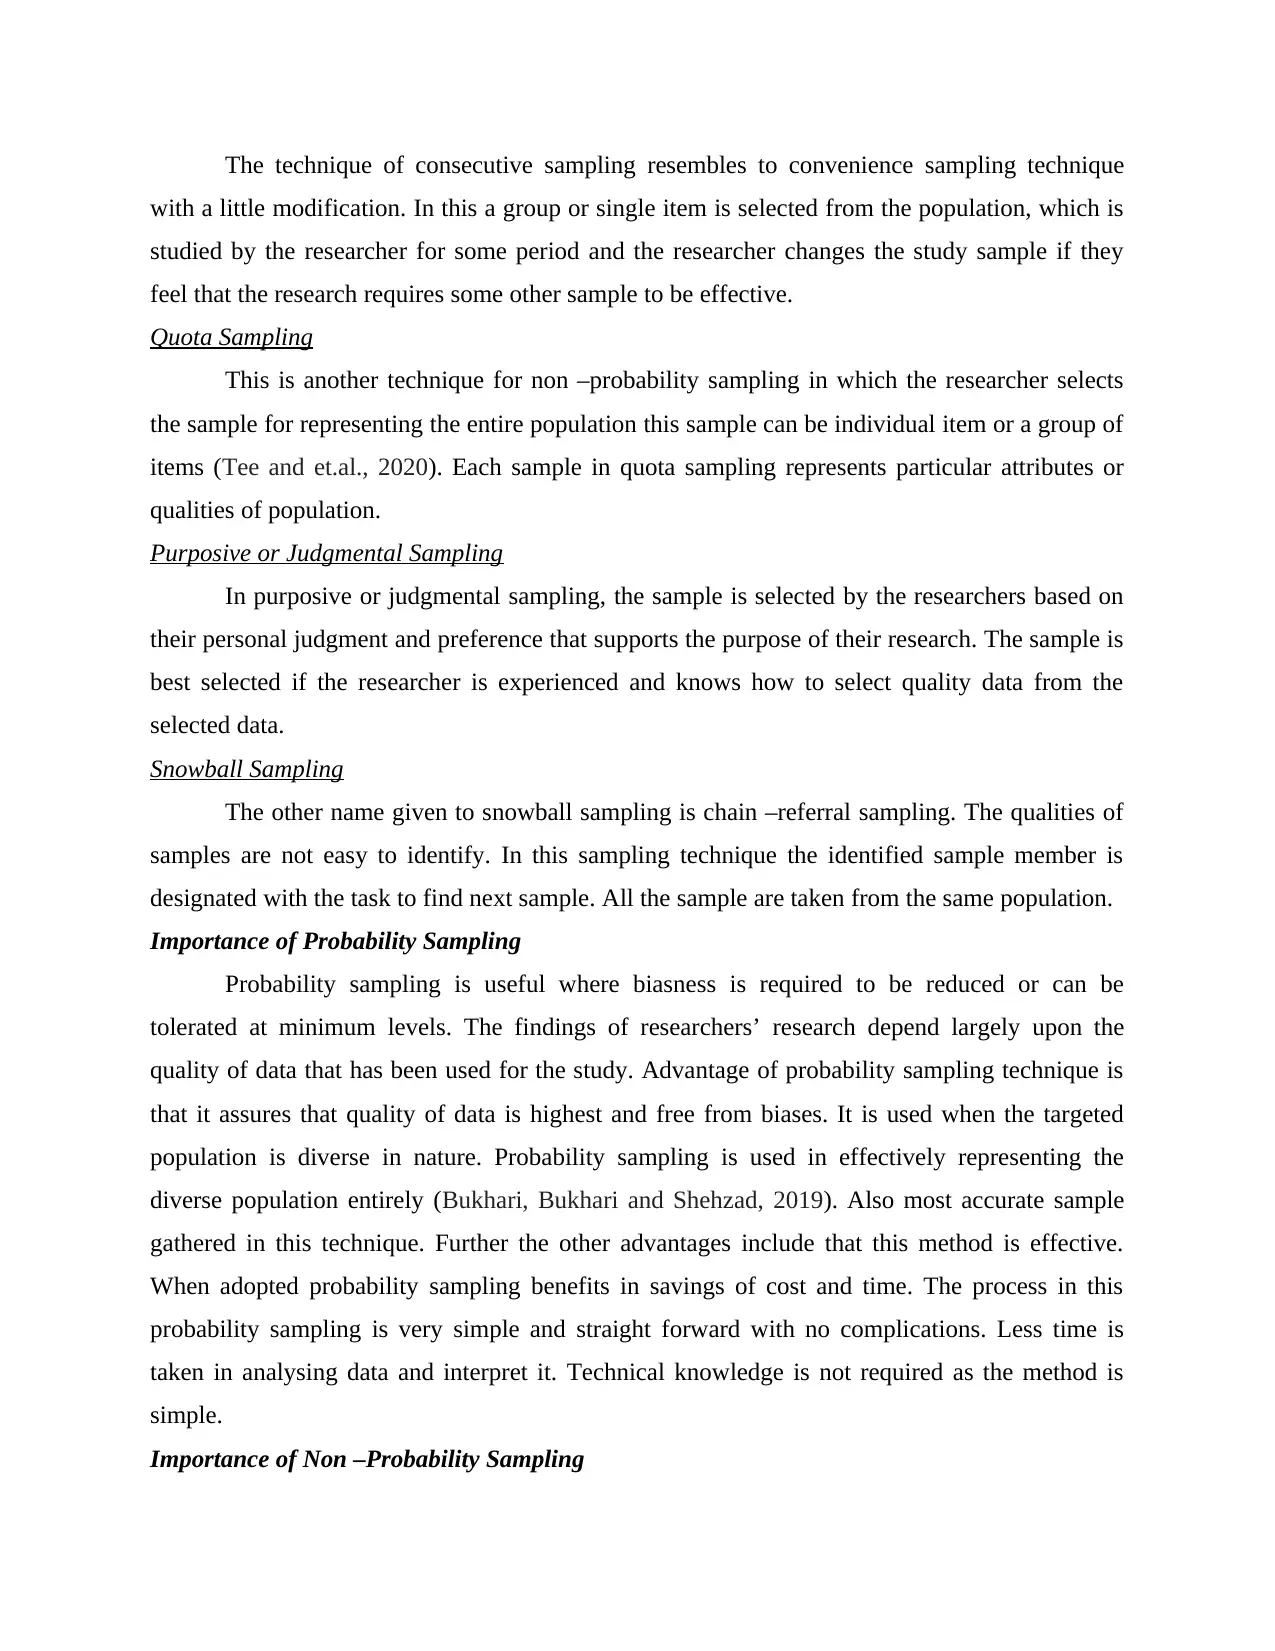
size of sample is there so the items are selected on random basis. For example: the total number
of colleagues is 100 so each of them will be numbered from 1 – 100 and 20 colleagues will be
selected using random number generator.
Systematic Sampling
In this technique the first data item is selected randomly after which each data item from
sample is selected at fixed interval. For instance, out of 100 colleagues one will be selected
randomly say 12 and every 8 th employee after 12 th number co-worker will be selected.
Stratified Sampling
In this technique firstly small divisions of the entire population are made. The
characteristics of the population are noted and based on each trait a small group is formed. Then
from each group sample is selected randomly (Amir, Jabeen and Niaz, 2020). For instance, out
of all the employees the groups are made on the basis of their working experience with the firm
in number of years. The groups will be like 1 –3 years, 3 -6 years, 6 -9 years and 9+ years. Each
group for suppose have 20, 25, 22, 33 employees. Sample is selected like 5 employees from
group 1, 10 from group 2, 15 from group 3 and 20 from last group.
Clustered Sampling
This technique of probability sampling groups or clusters are made from the population.
Each cluster is equally likely to be selected for the sample (Etikan and Babtope, 2019). For
instance, there are various stores of Mark & Spencer so for studying the concerned matter the
employees of few stores will be selected as the sample.
Non- Probability Sampling
In non –probability sampling samples are selected on the basis of judgement rather than
the random basis. All the items of the population involved does not have chance for participation
in study. There are further classifications to non –probability sampling.
Convenience Sampling
As the name says this technique is convenient for the researchers to use. The selection of
sample from the population is directly done. For instance, only the colleagues that are friends
with the researcher employee will be asked the questions to gather data. Only those are
approached for asking questions from whom answers can be conveniently taken.
Consecutive Sampling
Paraphrase This Document
Need a fresh take? Get an instant paraphrase of this document with our AI Paraphraser
The technique of consecutive sampling resembles to convenience sampling technique
with a little modification. In this a group or single item is selected from the population, which is
studied by the researcher for some period and the researcher changes the study sample if they
feel that the research requires some other sample to be effective.
Quota Sampling
This is another technique for non –probability sampling in which the researcher selects
the sample for representing the entire population this sample can be individual item or a group of
items (Tee and et.al., 2020). Each sample in quota sampling represents particular attributes or
qualities of population.
Purposive or Judgmental Sampling
In purposive or judgmental sampling, the sample is selected by the researchers based on
their personal judgment and preference that supports the purpose of their research. The sample is
best selected if the researcher is experienced and knows how to select quality data from the
selected data.
Snowball Sampling
The other name given to snowball sampling is chain –referral sampling. The qualities of
samples are not easy to identify. In this sampling technique the identified sample member is
designated with the task to find next sample. All the sample are taken from the same population.
Importance of Probability Sampling
Probability sampling is useful where biasness is required to be reduced or can be
tolerated at minimum levels. The findings of researchers’ research depend largely upon the
quality of data that has been used for the study. Advantage of probability sampling technique is
that it assures that quality of data is highest and free from biases. It is used when the targeted
population is diverse in nature. Probability sampling is used in effectively representing the
diverse population entirely (Bukhari, Bukhari and Shehzad, 2019). Also most accurate sample
gathered in this technique. Further the other advantages include that this method is effective.
When adopted probability sampling benefits in savings of cost and time. The process in this
probability sampling is very simple and straight forward with no complications. Less time is
taken in analysing data and interpret it. Technical knowledge is not required as the method is
simple.
Importance of Non –Probability Sampling
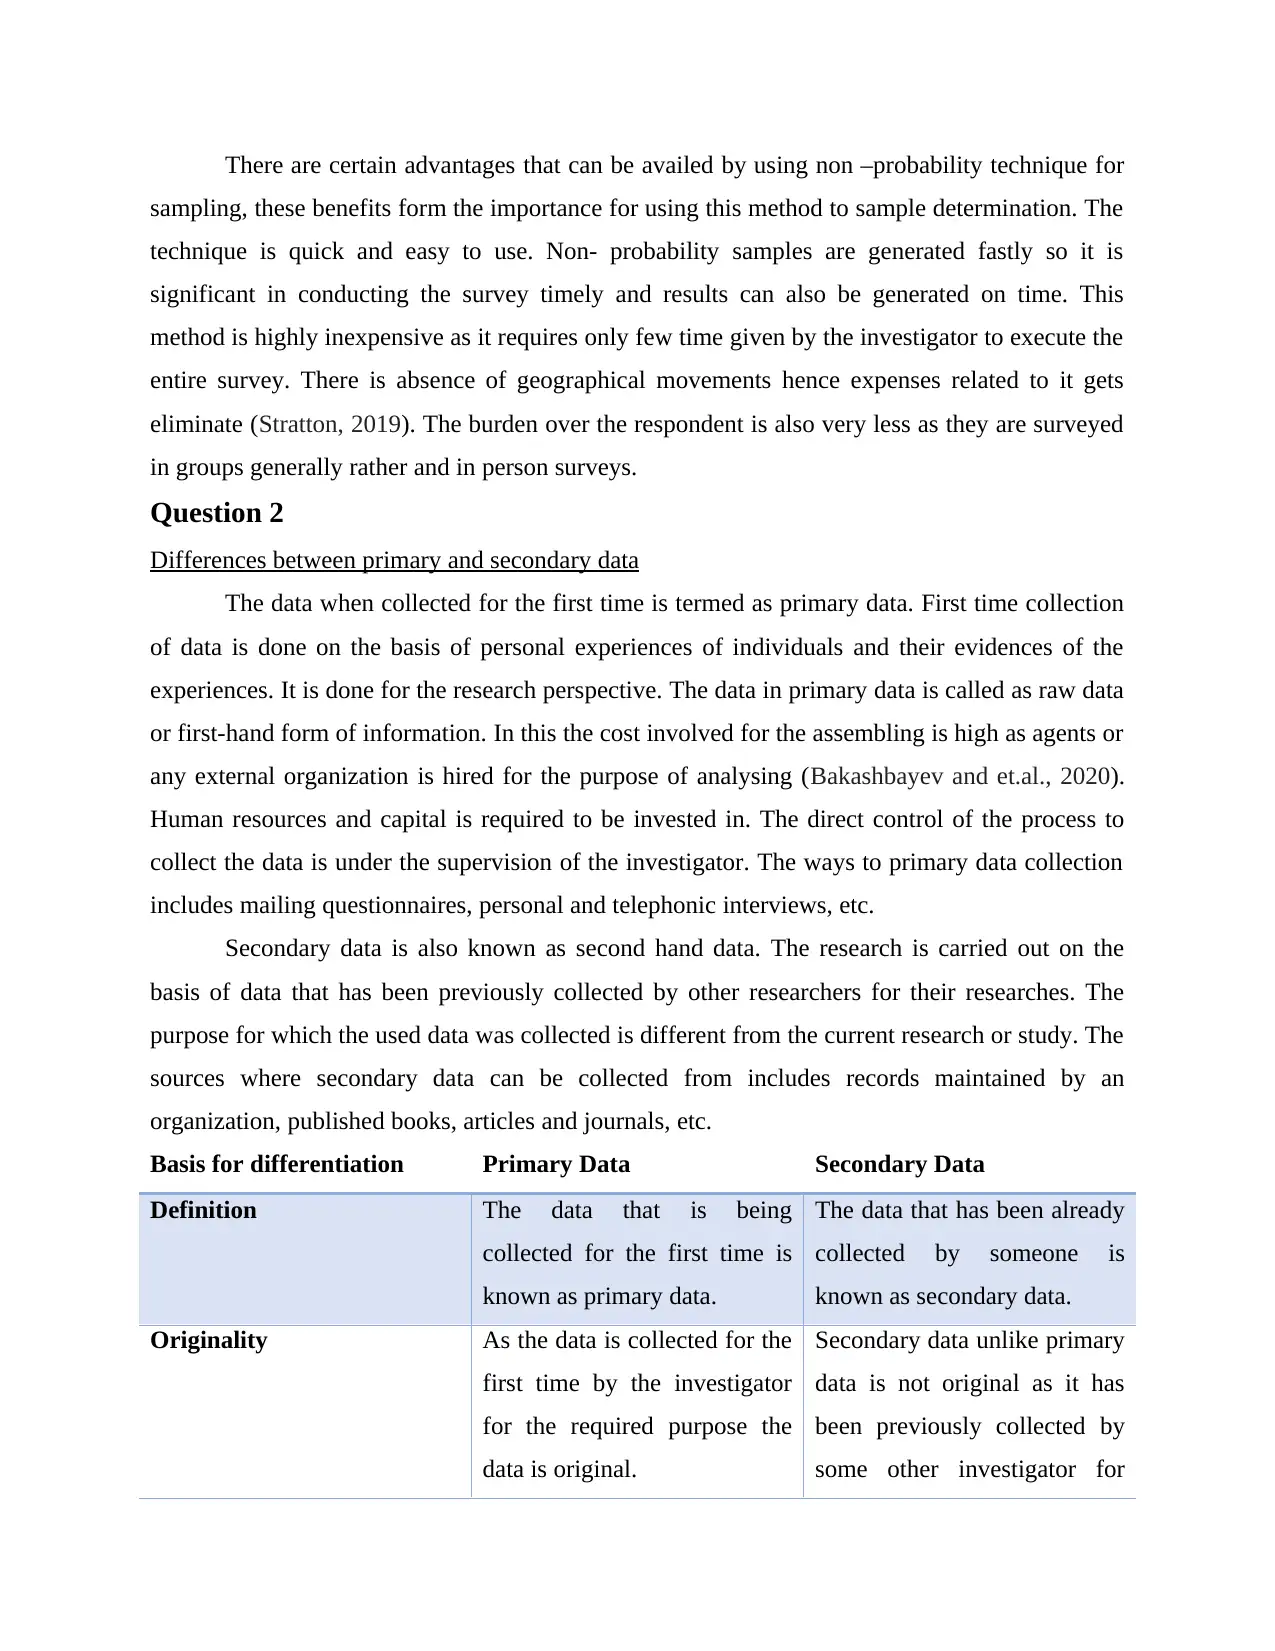
There are certain advantages that can be availed by using non –probability technique for
sampling, these benefits form the importance for using this method to sample determination. The
technique is quick and easy to use. Non- probability samples are generated fastly so it is
significant in conducting the survey timely and results can also be generated on time. This
method is highly inexpensive as it requires only few time given by the investigator to execute the
entire survey. There is absence of geographical movements hence expenses related to it gets
eliminate (Stratton, 2019). The burden over the respondent is also very less as they are surveyed
in groups generally rather and in person surveys.
Question 2
Differences between primary and secondary data
The data when collected for the first time is termed as primary data. First time collection
of data is done on the basis of personal experiences of individuals and their evidences of the
experiences. It is done for the research perspective. The data in primary data is called as raw data
or first-hand form of information. In this the cost involved for the assembling is high as agents or
any external organization is hired for the purpose of analysing (Bakashbayev and et.al., 2020).
Human resources and capital is required to be invested in. The direct control of the process to
collect the data is under the supervision of the investigator. The ways to primary data collection
includes mailing questionnaires, personal and telephonic interviews, etc.
Secondary data is also known as second hand data. The research is carried out on the
basis of data that has been previously collected by other researchers for their researches. The
purpose for which the used data was collected is different from the current research or study. The
sources where secondary data can be collected from includes records maintained by an
organization, published books, articles and journals, etc.
Basis for differentiation Primary Data Secondary Data
Definition The data that is being
collected for the first time is
known as primary data.
The data that has been already
collected by someone is
known as secondary data.
Originality As the data is collected for the
first time by the investigator
for the required purpose the
data is original.
Secondary data unlike primary
data is not original as it has
been previously collected by
some other investigator for
⊘ This is a preview!⊘
Do you want full access?
Subscribe today to unlock all pages.
Trusted by 1+ million students worldwide
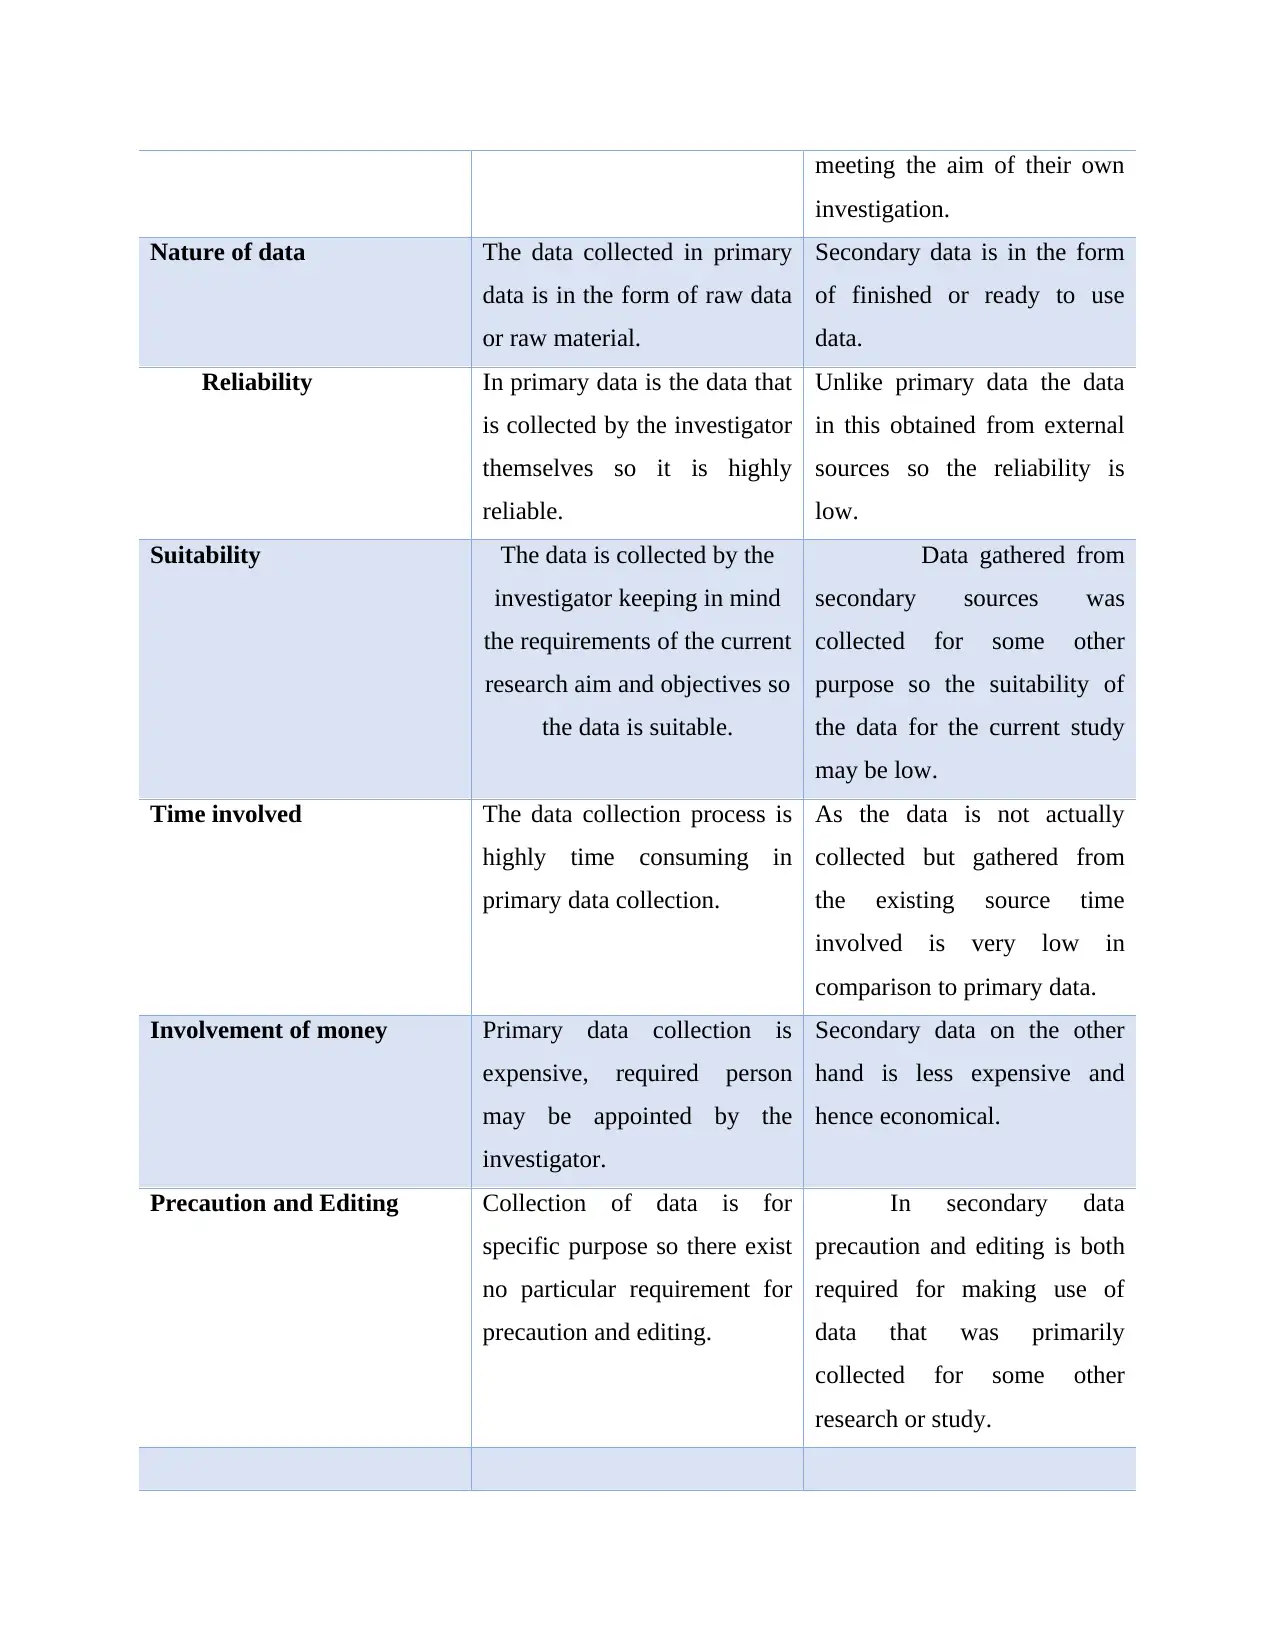
meeting the aim of their own
investigation.
Nature of data The data collected in primary
data is in the form of raw data
or raw material.
Secondary data is in the form
of finished or ready to use
data.
Reliability In primary data is the data that
is collected by the investigator
themselves so it is highly
reliable.
Unlike primary data the data
in this obtained from external
sources so the reliability is
low.
Suitability The data is collected by the
investigator keeping in mind
the requirements of the current
research aim and objectives so
the data is suitable.
Data gathered from
secondary sources was
collected for some other
purpose so the suitability of
the data for the current study
may be low.
Time involved The data collection process is
highly time consuming in
primary data collection.
As the data is not actually
collected but gathered from
the existing source time
involved is very low in
comparison to primary data.
Involvement of money Primary data collection is
expensive, required person
may be appointed by the
investigator.
Secondary data on the other
hand is less expensive and
hence economical.
Precaution and Editing Collection of data is for
specific purpose so there exist
no particular requirement for
precaution and editing.
In secondary data
precaution and editing is both
required for making use of
data that was primarily
collected for some other
research or study.
Paraphrase This Document
Need a fresh take? Get an instant paraphrase of this document with our AI Paraphraser
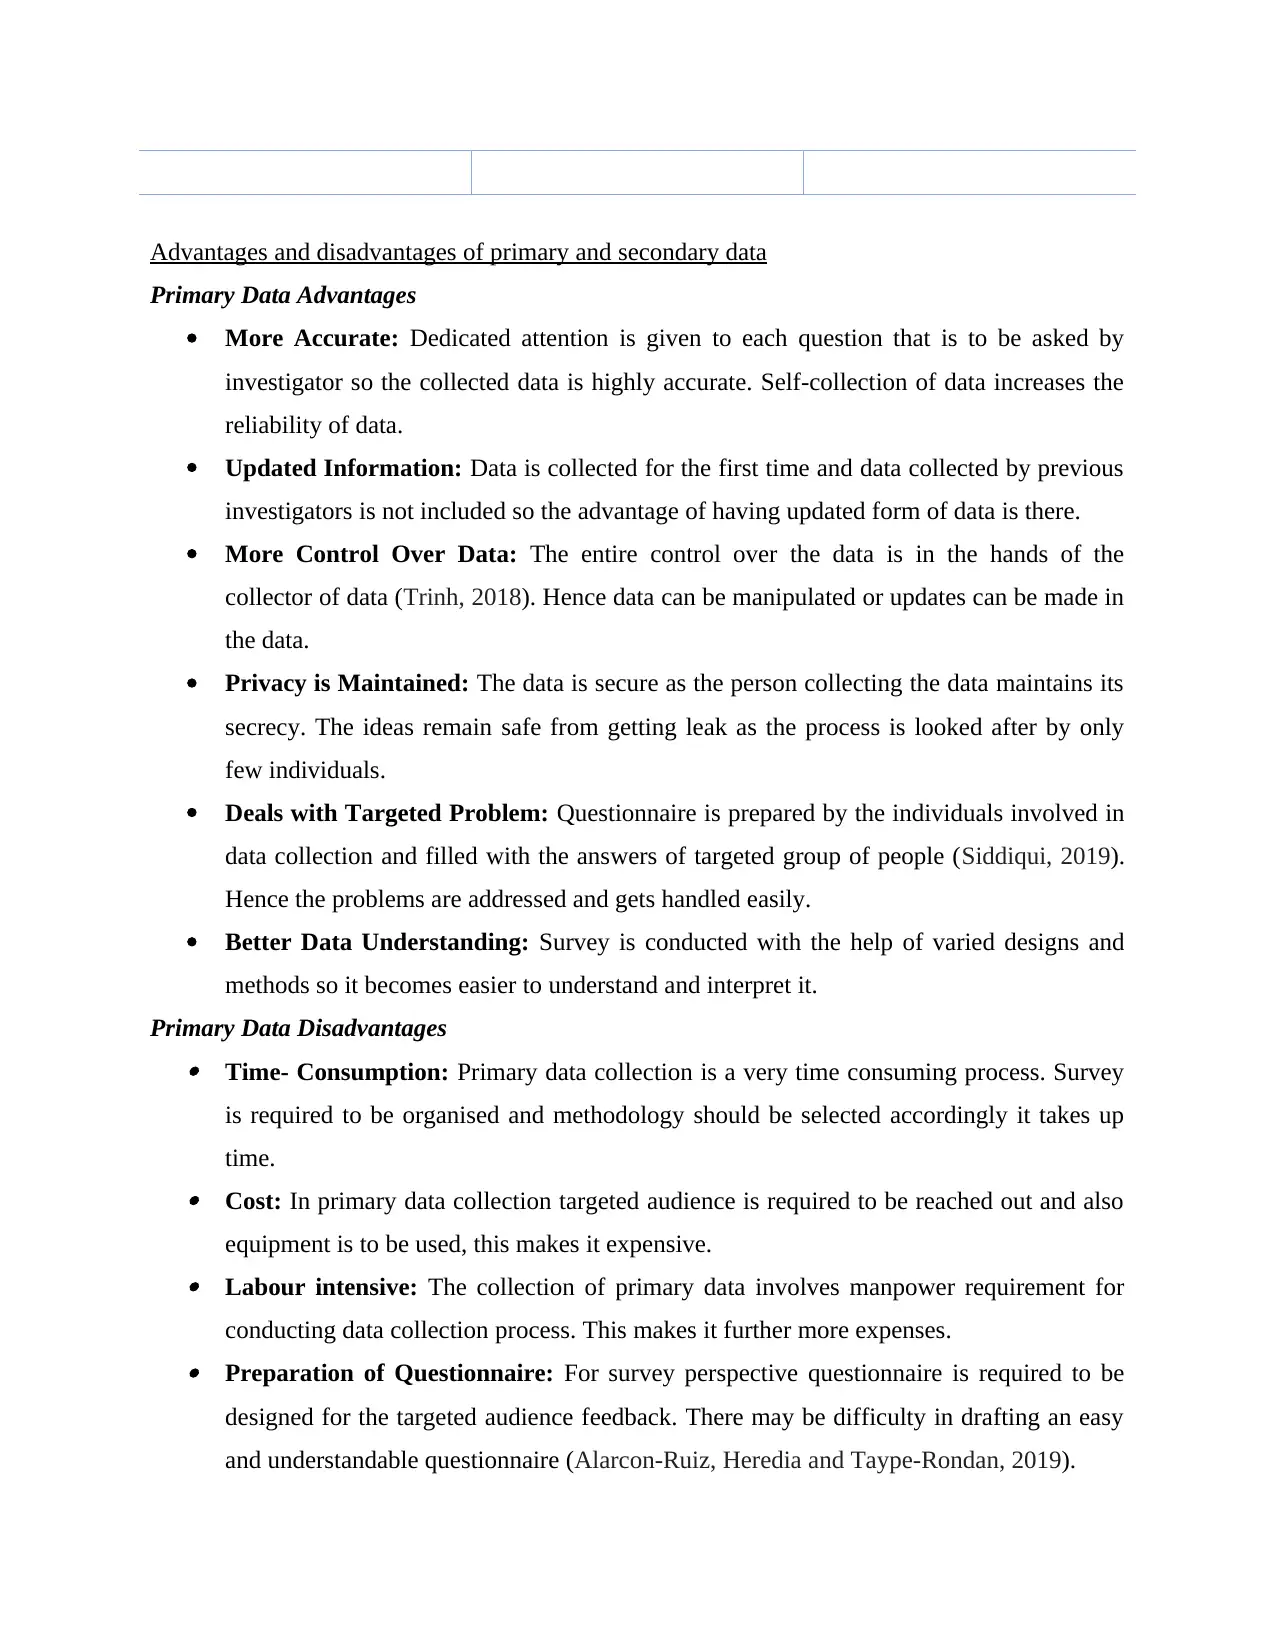
Advantages and disadvantages of primary and secondary data
Primary Data Advantages
More Accurate: Dedicated attention is given to each question that is to be asked by
investigator so the collected data is highly accurate. Self-collection of data increases the
reliability of data.
Updated Information: Data is collected for the first time and data collected by previous
investigators is not included so the advantage of having updated form of data is there.
More Control Over Data: The entire control over the data is in the hands of the
collector of data (Trinh, 2018). Hence data can be manipulated or updates can be made in
the data.
Privacy is Maintained: The data is secure as the person collecting the data maintains its
secrecy. The ideas remain safe from getting leak as the process is looked after by only
few individuals.
Deals with Targeted Problem: Questionnaire is prepared by the individuals involved in
data collection and filled with the answers of targeted group of people (Siddiqui, 2019).
Hence the problems are addressed and gets handled easily.
Better Data Understanding: Survey is conducted with the help of varied designs and
methods so it becomes easier to understand and interpret it.
Primary Data Disadvantages Time- Consumption: Primary data collection is a very time consuming process. Survey
is required to be organised and methodology should be selected accordingly it takes up
time. Cost: In primary data collection targeted audience is required to be reached out and also
equipment is to be used, this makes it expensive. Labour intensive: The collection of primary data involves manpower requirement for
conducting data collection process. This makes it further more expenses. Preparation of Questionnaire: For survey perspective questionnaire is required to be
designed for the targeted audience feedback. There may be difficulty in drafting an easy
and understandable questionnaire (Alarcon-Ruiz, Heredia and Taype-Rondan, 2019).
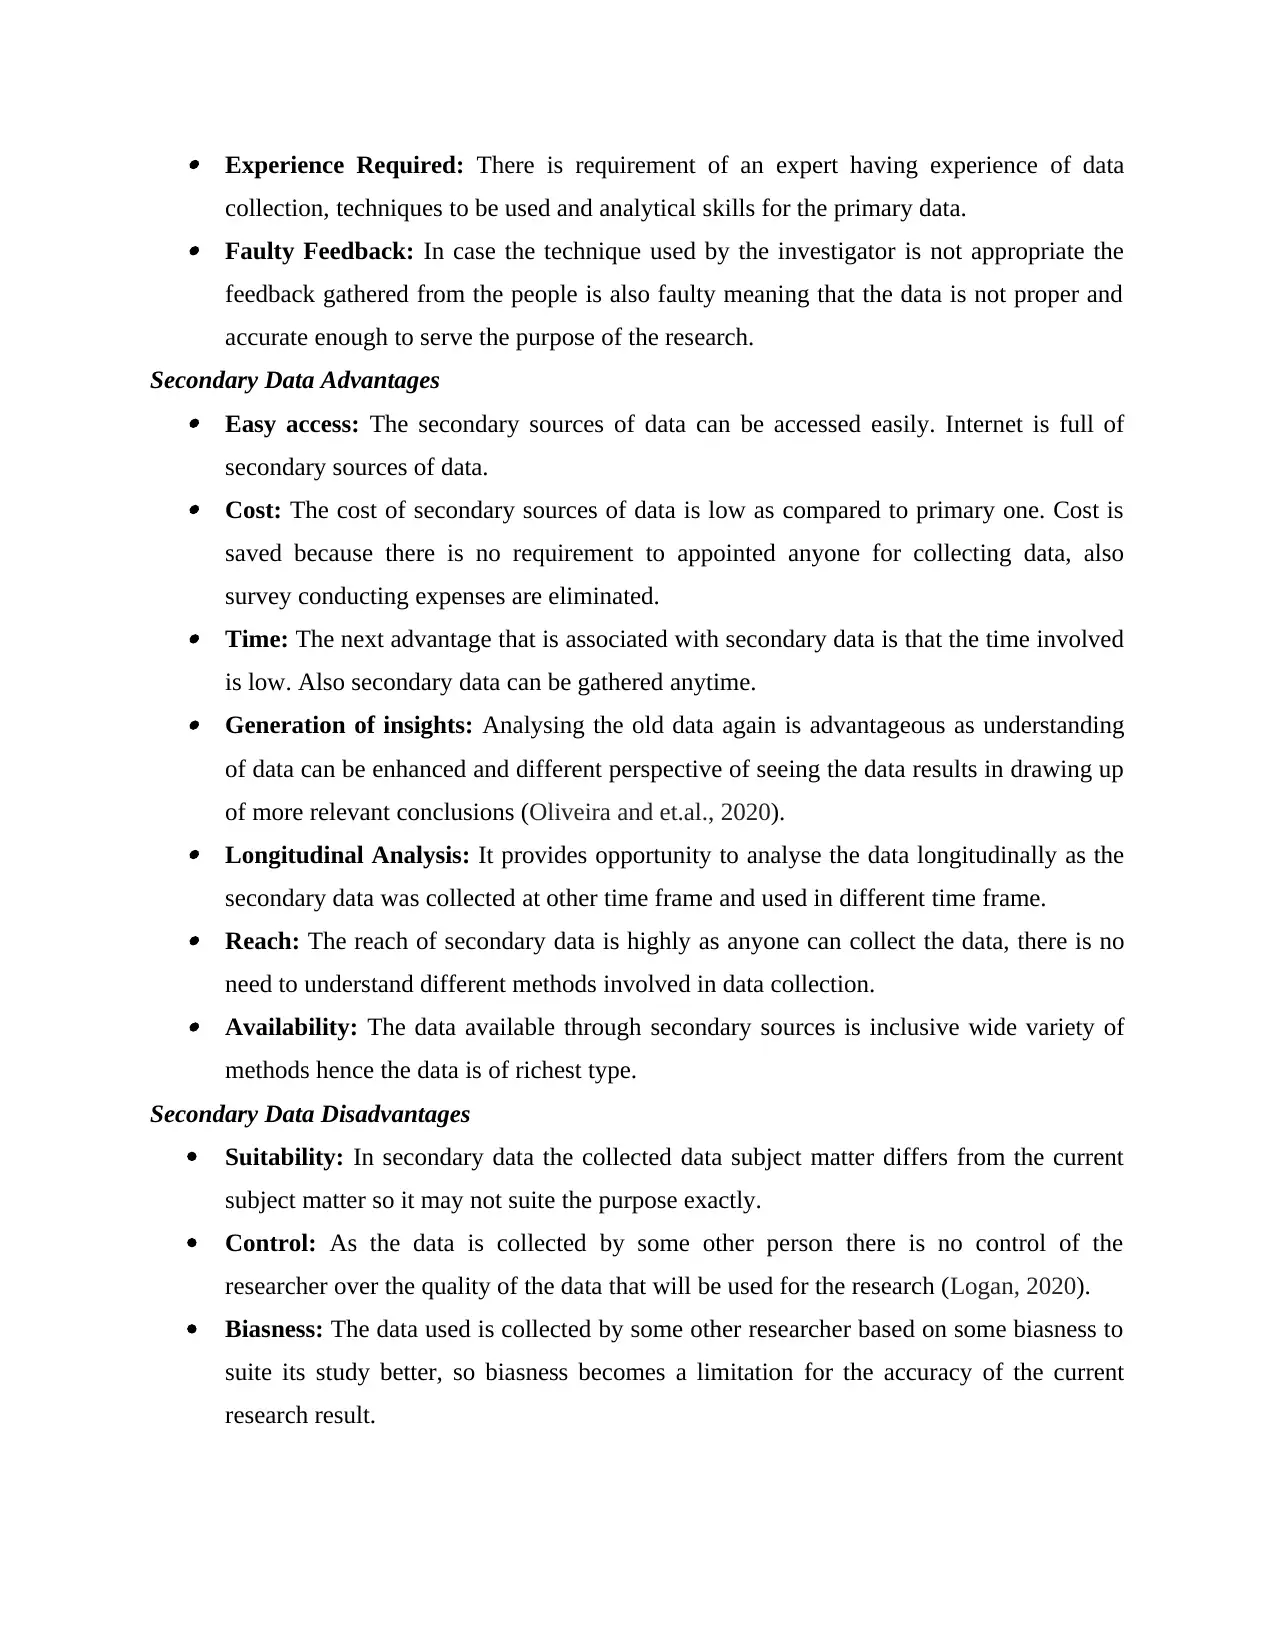
Experience Required: There is requirement of an expert having experience of data
collection, techniques to be used and analytical skills for the primary data. Faulty Feedback: In case the technique used by the investigator is not appropriate the
feedback gathered from the people is also faulty meaning that the data is not proper and
accurate enough to serve the purpose of the research.
Secondary Data Advantages Easy access: The secondary sources of data can be accessed easily. Internet is full of
secondary sources of data. Cost: The cost of secondary sources of data is low as compared to primary one. Cost is
saved because there is no requirement to appointed anyone for collecting data, also
survey conducting expenses are eliminated. Time: The next advantage that is associated with secondary data is that the time involved
is low. Also secondary data can be gathered anytime. Generation of insights: Analysing the old data again is advantageous as understanding
of data can be enhanced and different perspective of seeing the data results in drawing up
of more relevant conclusions (Oliveira and et.al., 2020). Longitudinal Analysis: It provides opportunity to analyse the data longitudinally as the
secondary data was collected at other time frame and used in different time frame. Reach: The reach of secondary data is highly as anyone can collect the data, there is no
need to understand different methods involved in data collection. Availability: The data available through secondary sources is inclusive wide variety of
methods hence the data is of richest type.
Secondary Data Disadvantages
Suitability: In secondary data the collected data subject matter differs from the current
subject matter so it may not suite the purpose exactly.
Control: As the data is collected by some other person there is no control of the
researcher over the quality of the data that will be used for the research (Logan, 2020).
Biasness: The data used is collected by some other researcher based on some biasness to
suite its study better, so biasness becomes a limitation for the accuracy of the current
research result.
⊘ This is a preview!⊘
Do you want full access?
Subscribe today to unlock all pages.
Trusted by 1+ million students worldwide
Not Timely: Data is collected at the past dates meaning that it might be outdated to be
used in current study.
Ownership of Data: The ownership of data lies with its original gatherer.
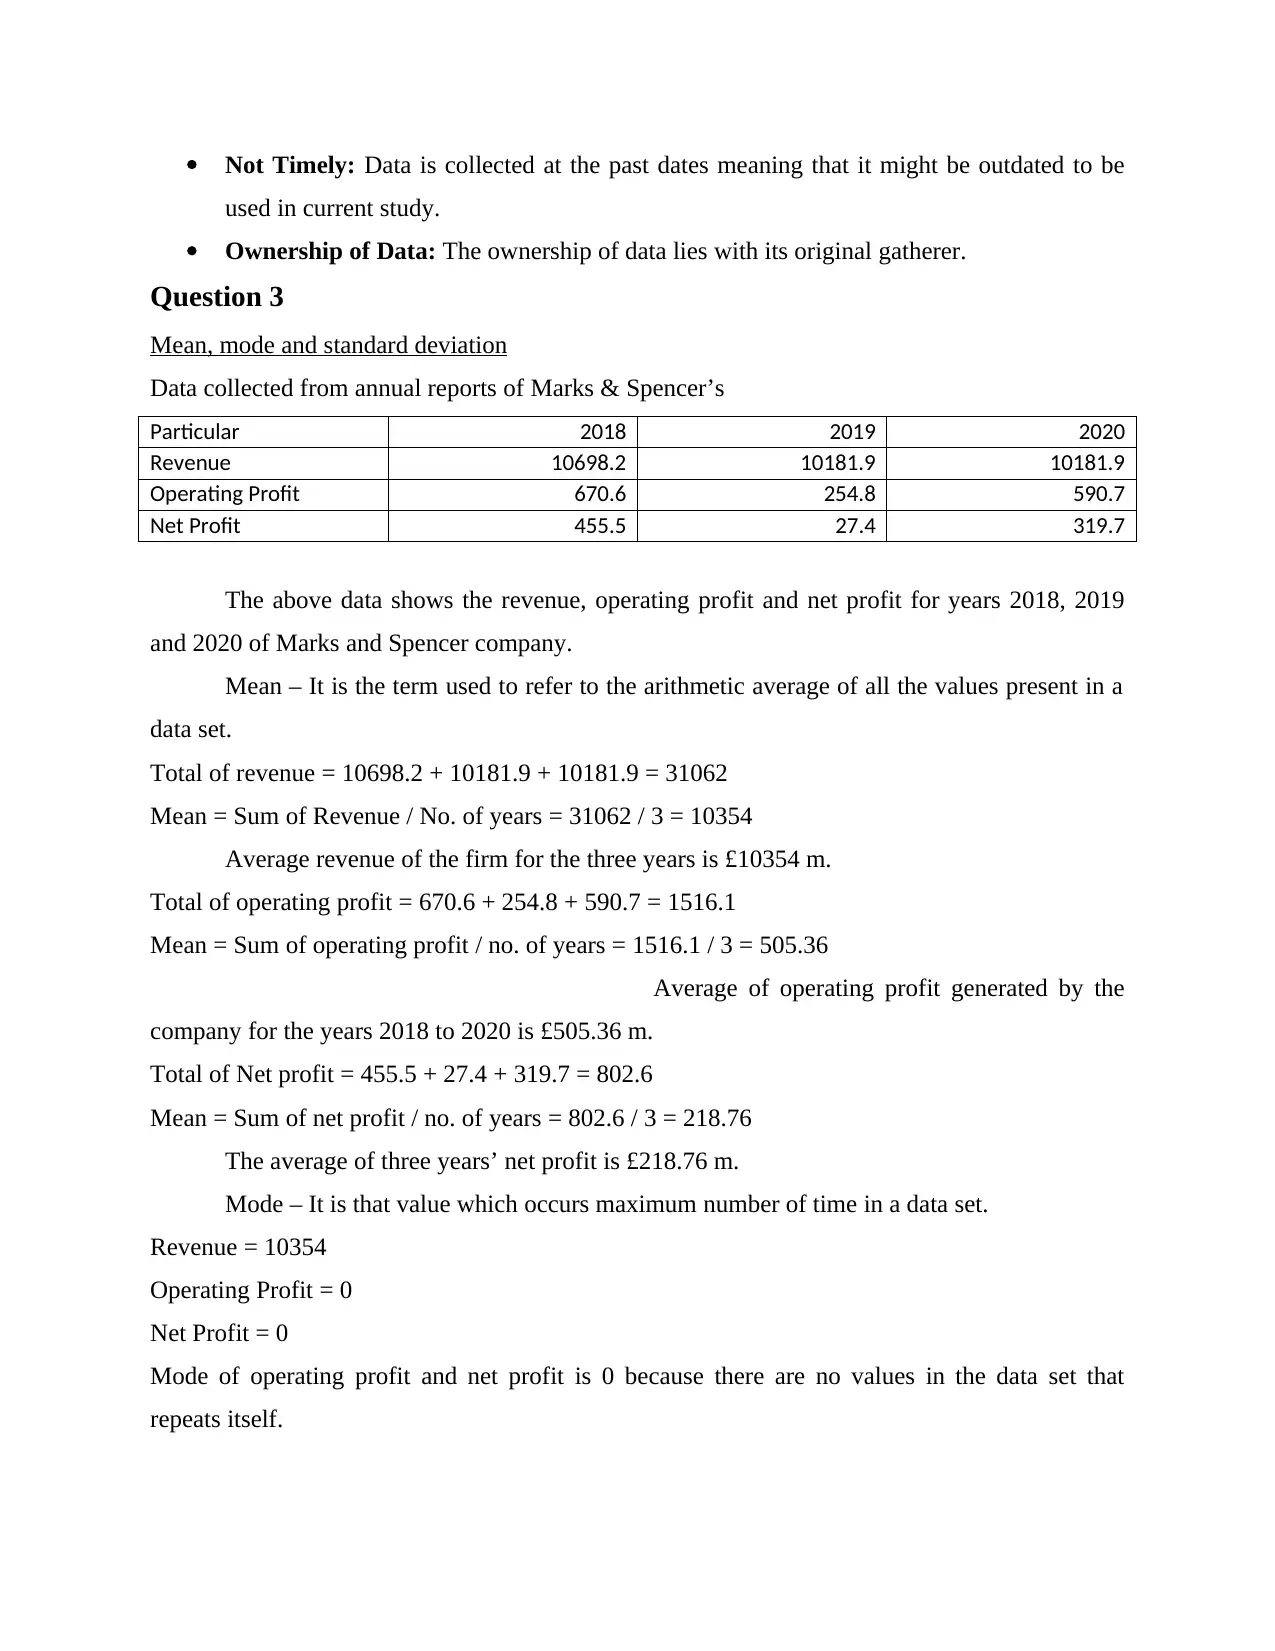
Question 3
Mean, mode and standard deviation
Data collected from annual reports of Marks & Spencer’s
Particular 2018 2019 2020
Revenue 10698.2 10181.9 10181.9
Operating Profit 670.6 254.8 590.7
Net Profit 455.5 27.4 319.7
The above data shows the revenue, operating profit and net profit for years 2018, 2019
and 2020 of Marks and Spencer company.
Mean – It is the term used to refer to the arithmetic average of all the values present in a
data set.
Total of revenue = 10698.2 + 10181.9 + 10181.9 = 31062
Mean = Sum of Revenue / No. of years = 31062 / 3 = 10354
Average revenue of the firm for the three years is £10354 m.
Total of operating profit = 670.6 + 254.8 + 590.7 = 1516.1
Mean = Sum of operating profit / no. of years = 1516.1 / 3 = 505.36
Average of operating profit generated by the
company for the years 2018 to 2020 is £505.36 m.
Total of Net profit = 455.5 + 27.4 + 319.7 = 802.6
Mean = Sum of net profit / no. of years = 802.6 / 3 = 218.76
The average of three years’ net profit is £218.76 m.
Mode – It is that value which occurs maximum number of time in a data set.
Revenue = 10354
Operating Profit = 0
Net Profit = 0
Mode of operating profit and net profit is 0 because there are no values in the data set that
repeats itself.
used in current study.
Ownership of Data: The ownership of data lies with its original gatherer.
Question 3
Mean, mode and standard deviation
Data collected from annual reports of Marks & Spencer’s
Particular 2018 2019 2020
Revenue 10698.2 10181.9 10181.9
Operating Profit 670.6 254.8 590.7
Net Profit 455.5 27.4 319.7
The above data shows the revenue, operating profit and net profit for years 2018, 2019
and 2020 of Marks and Spencer company.
Mean – It is the term used to refer to the arithmetic average of all the values present in a
data set.
Total of revenue = 10698.2 + 10181.9 + 10181.9 = 31062
Mean = Sum of Revenue / No. of years = 31062 / 3 = 10354
Average revenue of the firm for the three years is £10354 m.
Total of operating profit = 670.6 + 254.8 + 590.7 = 1516.1
Mean = Sum of operating profit / no. of years = 1516.1 / 3 = 505.36
Average of operating profit generated by the
company for the years 2018 to 2020 is £505.36 m.
Total of Net profit = 455.5 + 27.4 + 319.7 = 802.6
Mean = Sum of net profit / no. of years = 802.6 / 3 = 218.76
The average of three years’ net profit is £218.76 m.
Mode – It is that value which occurs maximum number of time in a data set.
Revenue = 10354
Operating Profit = 0
Net Profit = 0
Mode of operating profit and net profit is 0 because there are no values in the data set that
repeats itself.
Paraphrase This Document
Need a fresh take? Get an instant paraphrase of this document with our AI Paraphraser
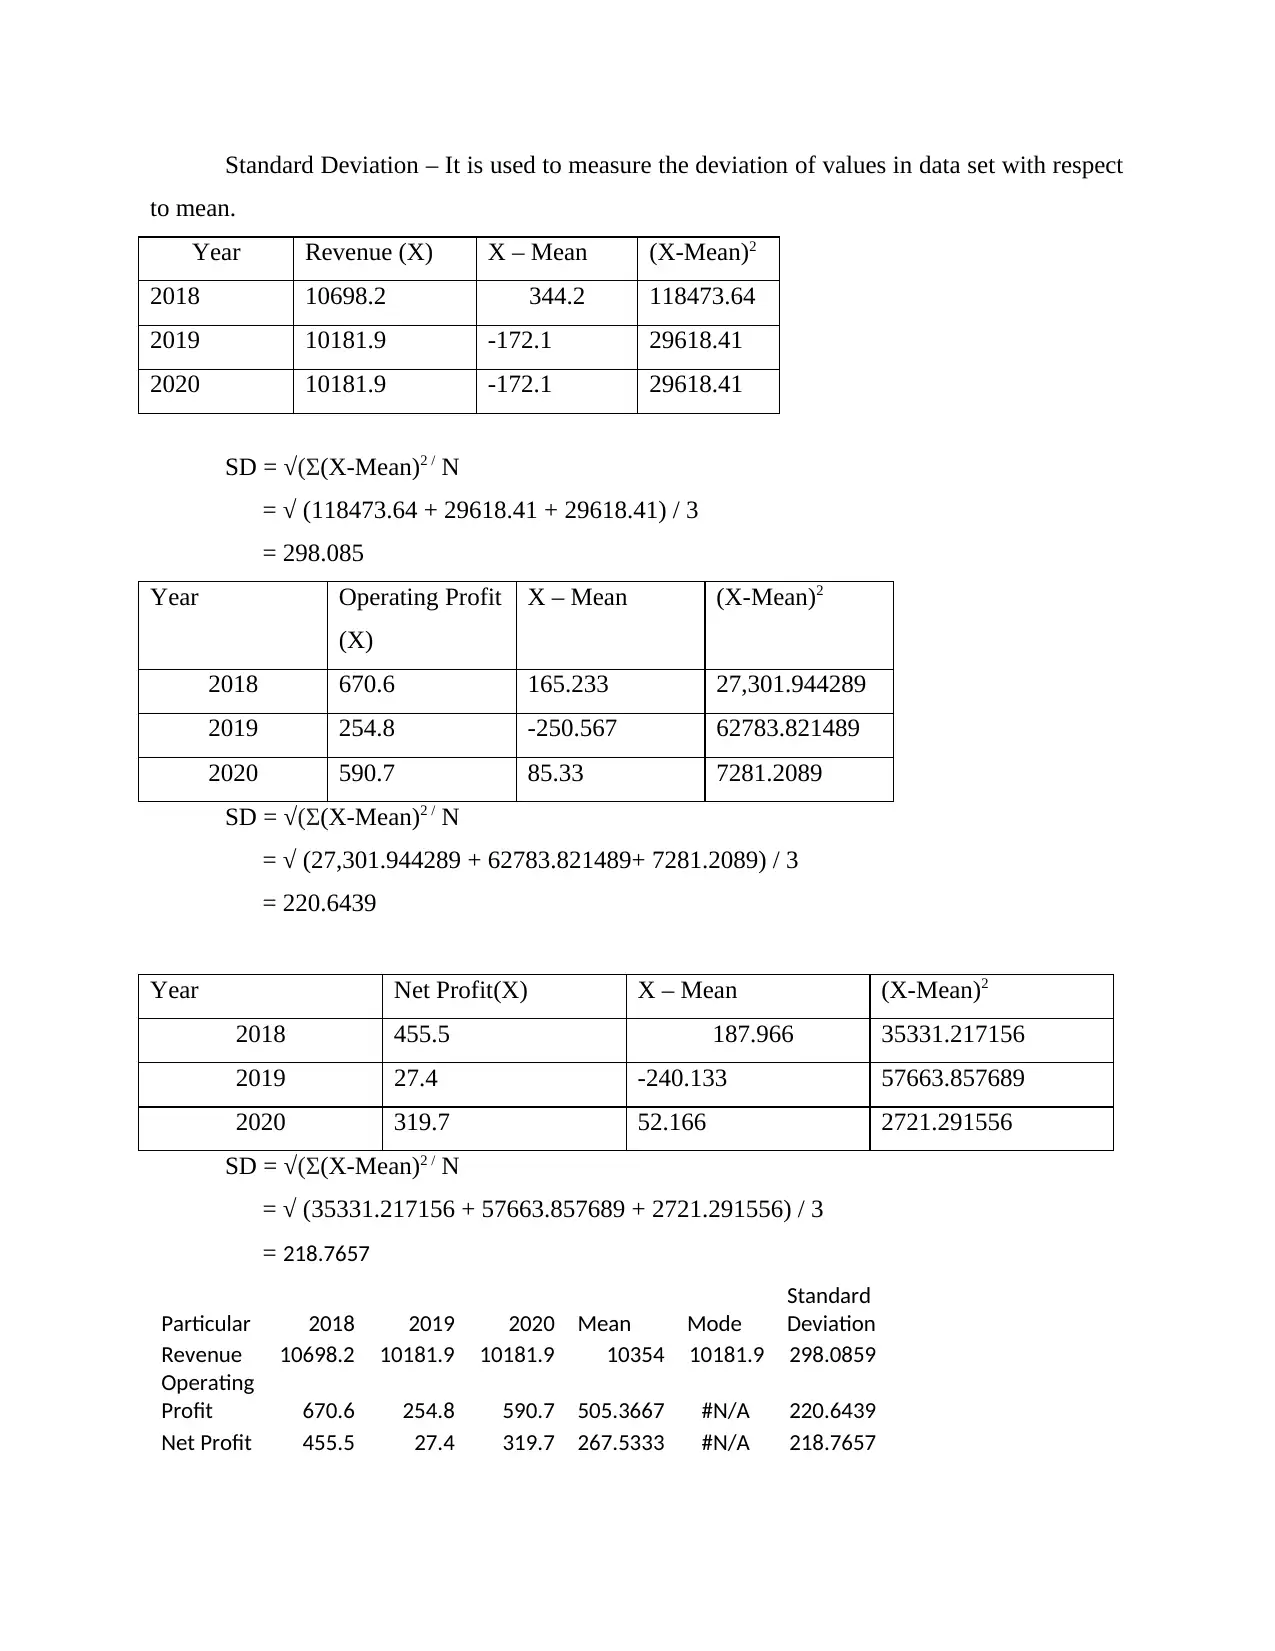
Standard Deviation – It is used to measure the deviation of values in data set with respect
to mean.
SD = √(Σ(X-Mean)2 / N
= √ (118473.64 + 29618.41 + 29618.41) / 3
= 298.085
Year Operating Profit
(X)
X – Mean (X-Mean)2
2018 670.6 165.233 27,301.944289
2019 254.8 -250.567 62783.821489
2020 590.7 85.33 7281.2089
SD = √(Σ(X-Mean)2 / N
= √ (27,301.944289 + 62783.821489+ 7281.2089) / 3
= 220.6439
Year Net Profit(X) X – Mean (X-Mean)2
2018 455.5 187.966 35331.217156
2019 27.4 -240.133 57663.857689
2020 319.7 52.166 2721.291556
SD = √(Σ(X-Mean)2 / N
= √ (35331.217156 + 57663.857689 + 2721.291556) / 3
= 218.7657
Particular 2018 2019 2020 Mean Mode
Standard
Deviation
Revenue 10698.2 10181.9 10181.9 10354 10181.9 298.0859
Operating
Profit 670.6 254.8 590.7 505.3667 #N/A 220.6439
Net Profit 455.5 27.4 319.7 267.5333 #N/A 218.7657
Year Revenue (X) X – Mean (X-Mean)2
2018 10698.2 344.2 118473.64
2019 10181.9 -172.1 29618.41
2020 10181.9 -172.1 29618.41
Question 4
Management Information System
The information system that is used in decision making process is known as management
information system. The system enables organization to synchronize, analyse, control
information and also in visualizing it. The study of management information system is inclusive
of study of people, technology and methods. Relationship between these three factors are
studied. The process is based on people and emphasis is laid over the providence of services
with use of technology. The aim is to use technology for implementing ease in lives of people. It
is a computer system that is comprised of both hardware and software providing basis to the
operations that are held within an organization. Varied online systems are approached for the
purpose of data gathering and then the collected data is analysed, on the basis of which reports
are prepared that facilitates managers in their decision making processes. The system is
beneficial in maintaining the improving levels of decision making by providing latest
information that is derived from accuracy in data (Huy and Hang, 2021). This accurate and
reliable data is maintained for various assets that are owned by organizations. These assets are
stock or inventory, finance, human resource or workforce, manufacturing, marketing, materials,
research and development, etc. with the use of MIS data is collected, stored and made accessible
to the management so that data can be analysed and reports are formulated.
There are different types of MIS. Transaction Processing System – the day to day
business related transactions are processed by TPS. For instance, processing of payroll, order,
etc. Management Support System – it is used for storing, organizing the data in order to enable
the user to make reports. It facilitates in providing solutions to the business problems with
analyzation of data and effective formulation of plans accordingly. The abbreviation used is
MSS. Third type of MIS is DSS, Decision Support System – It is used in analysing the data so
that managers can be helped in their decision making process. For instance, revenue data can be
generated on the basis of the assumptions regarding the sales of new product. Expert Systems –
It provides the managers overview of business problems and advise upon the same through the
use of AI. The object of using artificial intelligence is to bring expertise in the concerned subject
matter.
In an organization Management information system refers to software as well a specific
department. The companies can have competitive advantage; productivity of the company is
⊘ This is a preview!⊘
Do you want full access?
Subscribe today to unlock all pages.
Trusted by 1+ million students worldwide
1 out of 15
Related Documents


Your All-in-One AI-Powered Toolkit for Academic Success.
+13062052269
info@desklib.com
Available 24*7 on WhatsApp / Email
![[object Object]](/_next/static/media/star-bottom.7253800d.svg)
Unlock your academic potential
Copyright © 2020–2026 A2Z Services. All Rights Reserved. Developed and managed by ZUCOL.