BUS501 Business Analytics: Analyzing Payment Methods & Product Sales
VerifiedAdded on 2023/06/11
|11
|2327
|117
Report
AI Summary
This business analytics report investigates Nike's payment methods, product sales, and customer attitudes. The study uses a paired sample t-test to compare credit card and PayPal payments, finding a significant difference. Cross-tabulation identifies women's clothing as the top-selling product and girls' shoes/clothing as the worst. ANOVA tests reveal differences in customer attitudes based on user groups and gender. The report recommends encouraging PayPal usage and boosting marketing for underperforming product categories. Desklib offers similar resources for students.
Business analytics 1
BUS501
Research report
Student name:
Tutor name:
BUS501
Research report
Student name:
Tutor name:
Secure Best Marks with AI Grader
Need help grading? Try our AI Grader for instant feedback on your assignments.
Business analytics 2
Table of Contents
1.0 Introduction...........................................................................................................................................3
1.1 Problem statement and information required..................................................................................3
Whether there is a difference in payment methods............................................................................3
What are the top and worst selling product categories in terms of profit?.........................................4
Is there any difference in the user groups on all of the customer attitudes?......................................4
Is there any difference in gender on all of the customer attitudes?....................................................4
2.0 DATA ANALYSIS AND RESULTS...............................................................................................................5
Difference in payment methods..............................................................................................................5
Top and worst selling products in terms of profit....................................................................................6
Is there any difference in the user groups on all of the customer attitudes?......................................7
Is there any difference in the user groups on all of the customer attitudes?......................................8
3.0 DISCUSSION OF THE RESULTS................................................................................................................9
4.0 RECOMMENDATIONS............................................................................................................................9
Reference...................................................................................................................................................11
Business analytics 3
1.0 Introduction
Business operations in the world over has gone a notch higher to so many factors one of them
being technological advancement. Due to this, competition within industries has also heightened.
Small and weak companies which cannot cope with the level of competition have been forced
out of the market. The remaining companies have been forced to devise every method that will
allow them remain afloat in the market. Some of them have been doing market research in order
to trends in the market and their customers.
Nike Company is not an exception. It has also faced the wrath of technological advancement in
business operations. However, in order to remain in the market, the management has decided to
carry out a research survey on its various operations to understand their customers and their
position in the market. Nike Company deals in sports footwear and clothes. It has served for
several years that it has a major footprint in the production of sports products globally. The
Company’s management is so concerned about the trend in the market and their revenues. It is
against this background that they have initiated a research study to better understand their
position in terms of generation of new opportunities, sales and cost of their goods.
1.1 Problem statement and information required
The research study sought to answer various questions which include the following;
Whether there is a difference in payment methods
The Nike Company allowed customers to make payments through two methods. The methods
were credit card and PayPal. The company sought to find out whether there was a significant
difference in the two payment methods. In order to perform the test, we needed two establish the
number of variables involved. They were two related variables. This means that the test statistic
Business analytics 4
to be employed here is a paired sample t-test (Derrick, Toher, & White, 2017). Since this is a
parametric test certain assumptions had to be made about the data. One of the main and
important assumptions is normality (Leigh, 2008). The study assumed the data was normally
distributed since the size was greater than 30.
What are the top and worst selling product categories in terms of profit?
The research study sought to establish the best-selling products and the worst selling products in
terms of profit. May be there was a possibility that some category of products were bought in
high or low numbers due to their quality. The research employed cross tabulation in order to
determine the best-selling and worst selling products. The result was presented in a cross-tabular
manner. (Hinkelmann & Kempthorne, 2010).
Is there any difference in the user groups on all of the customer attitudes?
Due to different user groups, attitudes are bound to be different but to what extent? This research
study sought to establish whether there was a significant difference in user groups in terms of
attitude. Because the variables are more than two, it means that the test statistic to be employed
here is analysis of variance (ANOVA). Since analysis of variance is a parametric test, it is very
sensitive to normality thus the research study assumed normality of the sample.
Is there any difference in gender on all of the customer attitudes?
Due to different genders, attitudes are bound to be different but to what extent? This research
study sought to establish whether there was a significant difference in attitude in terms of gender.
Because the variables are more than two, it means that the test statistic to be employed here is
analysis of variance (ANOVA). Since analysis of variance is a parametric test, it is very sensitive
to normality thus the research study assumed normality of the sample.
Secure Best Marks with AI Grader
Need help grading? Try our AI Grader for instant feedback on your assignments.
Business analytics 5
2.0 DATA ANALYSIS AND RESULTS
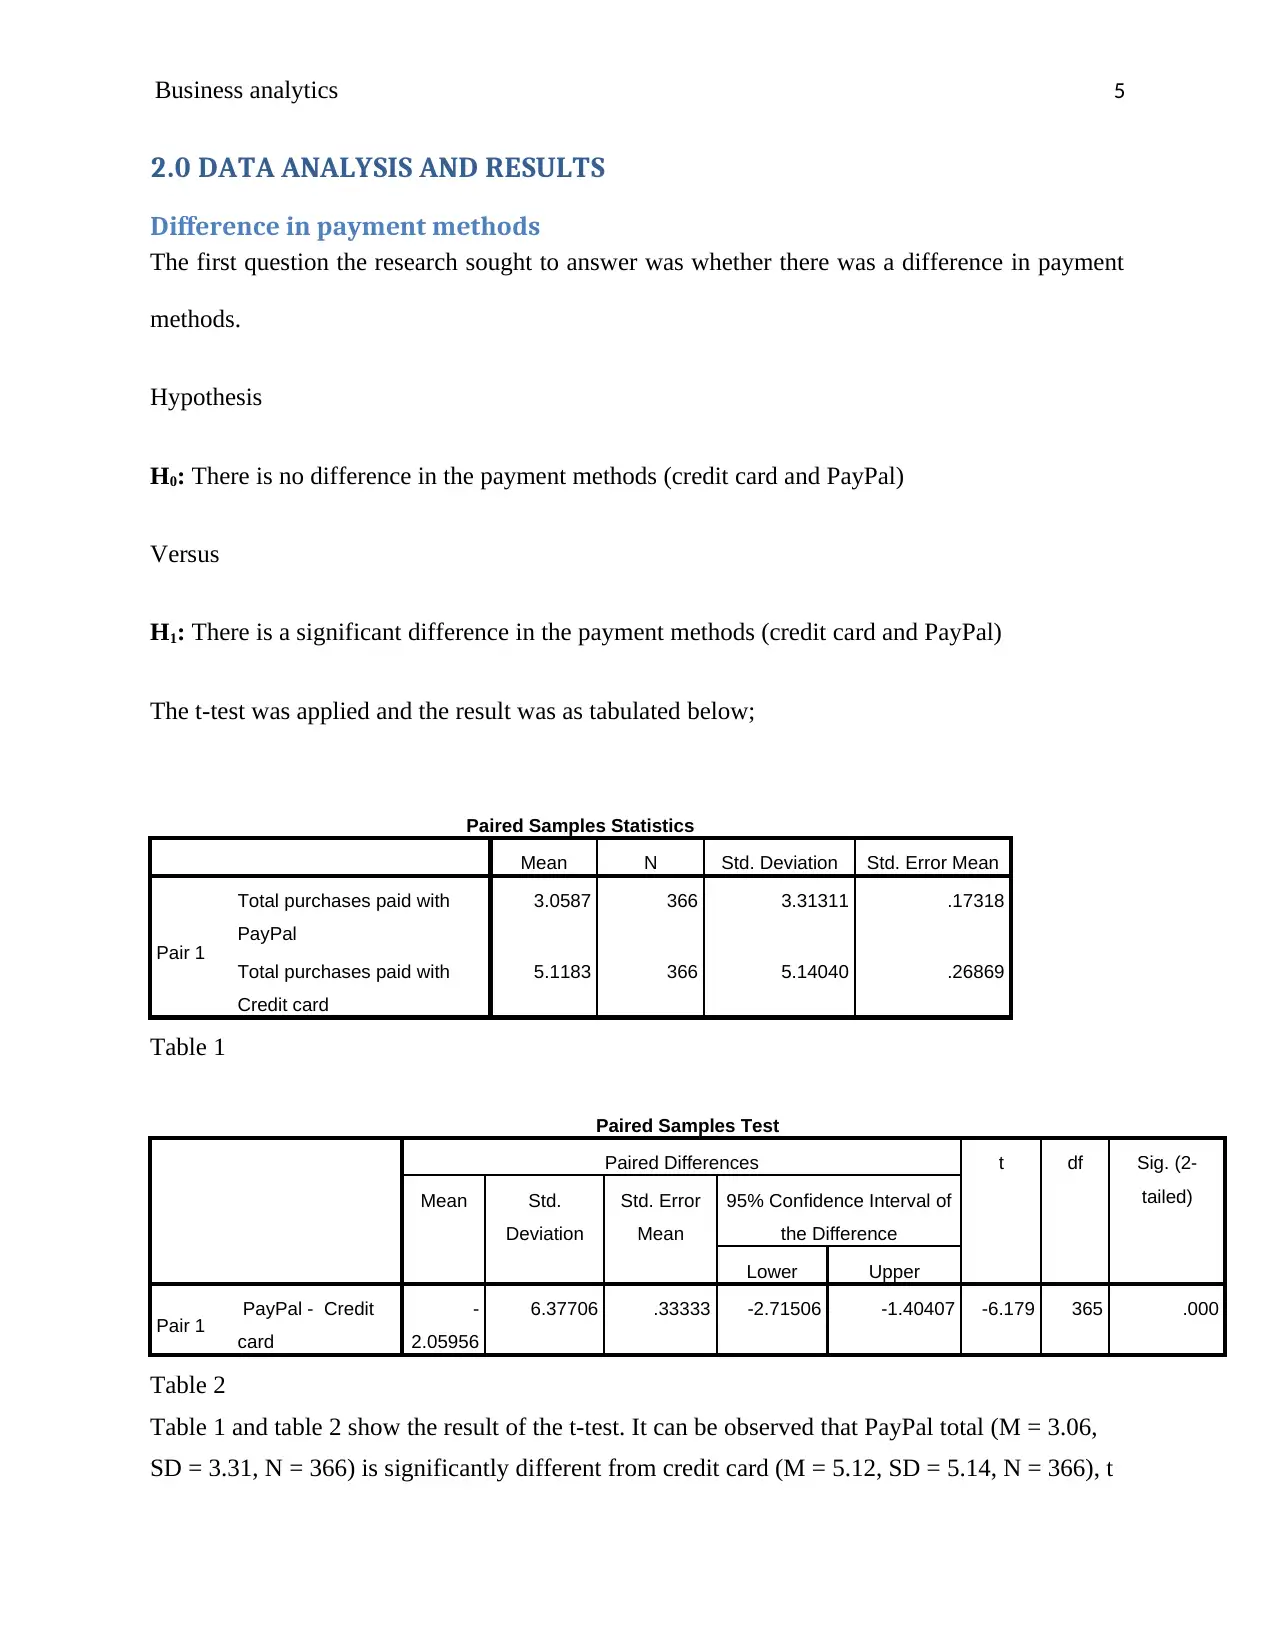
Difference in payment methods
The first question the research sought to answer was whether there was a difference in payment
methods.
Hypothesis
H0: There is no difference in the payment methods (credit card and PayPal)
Versus
H1: There is a significant difference in the payment methods (credit card and PayPal)
The t-test was applied and the result was as tabulated below;
Paired Samples Statistics
Mean N Std. Deviation Std. Error Mean
Pair 1
Total purchases paid with
PayPal
3.0587 366 3.31311 .17318
Total purchases paid with
Credit card
5.1183 366 5.14040 .26869
Table 1
Paired Samples Test
Paired Differences t df Sig. (2-
tailed)Mean Std.
Deviation
Std. Error
Mean
95% Confidence Interval of
the Difference
Lower Upper
Pair 1 PayPal - Credit
card
-
2.05956
6.37706 .33333 -2.71506 -1.40407 -6.179 365 .000
Table 2
Table 1 and table 2 show the result of the t-test. It can be observed that PayPal total (M = 3.06,
SD = 3.31, N = 366) is significantly different from credit card (M = 5.12, SD = 5.14, N = 366), t
2.0 DATA ANALYSIS AND RESULTS
Difference in payment methods
The first question the research sought to answer was whether there was a difference in payment
methods.
Hypothesis
H0: There is no difference in the payment methods (credit card and PayPal)
Versus
H1: There is a significant difference in the payment methods (credit card and PayPal)
The t-test was applied and the result was as tabulated below;
Paired Samples Statistics
Mean N Std. Deviation Std. Error Mean
Pair 1
Total purchases paid with
PayPal
3.0587 366 3.31311 .17318
Total purchases paid with
Credit card
5.1183 366 5.14040 .26869
Table 1
Paired Samples Test
Paired Differences t df Sig. (2-
tailed)Mean Std.
Deviation
Std. Error
Mean
95% Confidence Interval of
the Difference
Lower Upper
Pair 1 PayPal - Credit
card
-
2.05956
6.37706 .33333 -2.71506 -1.40407 -6.179 365 .000
Table 2
Table 1 and table 2 show the result of the t-test. It can be observed that PayPal total (M = 3.06,
SD = 3.31, N = 366) is significantly different from credit card (M = 5.12, SD = 5.14, N = 366), t
Business analytics 6
(365) = - 6.18, p < 0.05. Since p-value (0.00) is less than the level of significance (0.05), the null
hypothesis is rejected and the alternative hypothesis is accepted. It can also be observed from the
mean total values of the two methods of payment that there is a significant difference between
the two.
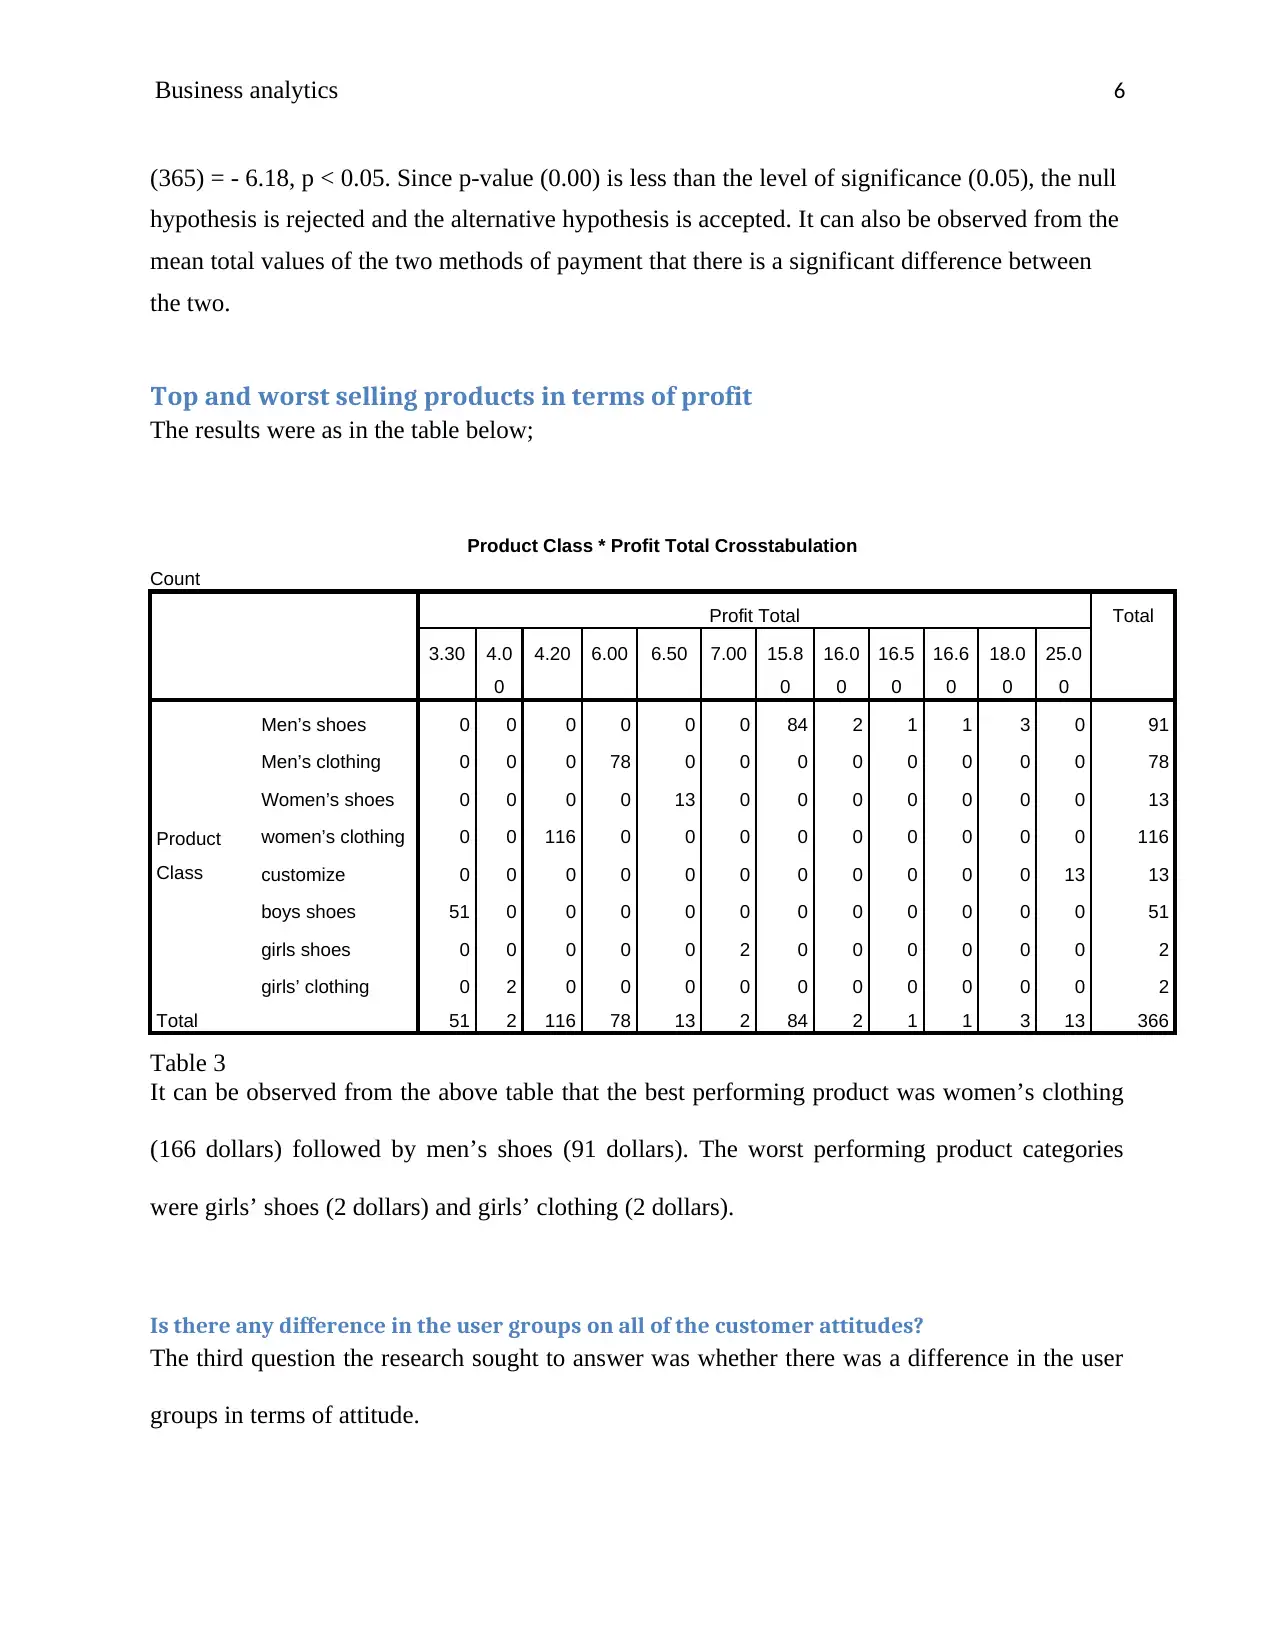
Top and worst selling products in terms of profit
The results were as in the table below;
Product Class * Profit Total Crosstabulation
Count
Profit Total Total
3.30 4.0
0
4.20 6.00 6.50 7.00 15.8
0
16.0
0
16.5
0
16.6
0
18.0
0
25.0
0
Product
Class
Men’s shoes 0 0 0 0 0 0 84 2 1 1 3 0 91
Men’s clothing 0 0 0 78 0 0 0 0 0 0 0 0 78
Women’s shoes 0 0 0 0 13 0 0 0 0 0 0 0 13
women’s clothing 0 0 116 0 0 0 0 0 0 0 0 0 116
customize 0 0 0 0 0 0 0 0 0 0 0 13 13
boys shoes 51 0 0 0 0 0 0 0 0 0 0 0 51
girls shoes 0 0 0 0 0 2 0 0 0 0 0 0 2
girls’ clothing 0 2 0 0 0 0 0 0 0 0 0 0 2
Total 51 2 116 78 13 2 84 2 1 1 3 13 366
Table 3
It can be observed from the above table that the best performing product was women’s clothing
(166 dollars) followed by men’s shoes (91 dollars). The worst performing product categories
were girls’ shoes (2 dollars) and girls’ clothing (2 dollars).
Is there any difference in the user groups on all of the customer attitudes?
The third question the research sought to answer was whether there was a difference in the user
groups in terms of attitude.
(365) = - 6.18, p < 0.05. Since p-value (0.00) is less than the level of significance (0.05), the null
hypothesis is rejected and the alternative hypothesis is accepted. It can also be observed from the
mean total values of the two methods of payment that there is a significant difference between
the two.
Top and worst selling products in terms of profit
The results were as in the table below;
Product Class * Profit Total Crosstabulation
Count
Profit Total Total
3.30 4.0
0
4.20 6.00 6.50 7.00 15.8
0
16.0
0
16.5
0
16.6
0
18.0
0
25.0
0
Product
Class
Men’s shoes 0 0 0 0 0 0 84 2 1 1 3 0 91
Men’s clothing 0 0 0 78 0 0 0 0 0 0 0 0 78
Women’s shoes 0 0 0 0 13 0 0 0 0 0 0 0 13
women’s clothing 0 0 116 0 0 0 0 0 0 0 0 0 116
customize 0 0 0 0 0 0 0 0 0 0 0 13 13
boys shoes 51 0 0 0 0 0 0 0 0 0 0 0 51
girls shoes 0 0 0 0 0 2 0 0 0 0 0 0 2
girls’ clothing 0 2 0 0 0 0 0 0 0 0 0 0 2
Total 51 2 116 78 13 2 84 2 1 1 3 13 366
Table 3
It can be observed from the above table that the best performing product was women’s clothing
(166 dollars) followed by men’s shoes (91 dollars). The worst performing product categories
were girls’ shoes (2 dollars) and girls’ clothing (2 dollars).
Is there any difference in the user groups on all of the customer attitudes?
The third question the research sought to answer was whether there was a difference in the user
groups in terms of attitude.
Business analytics 7
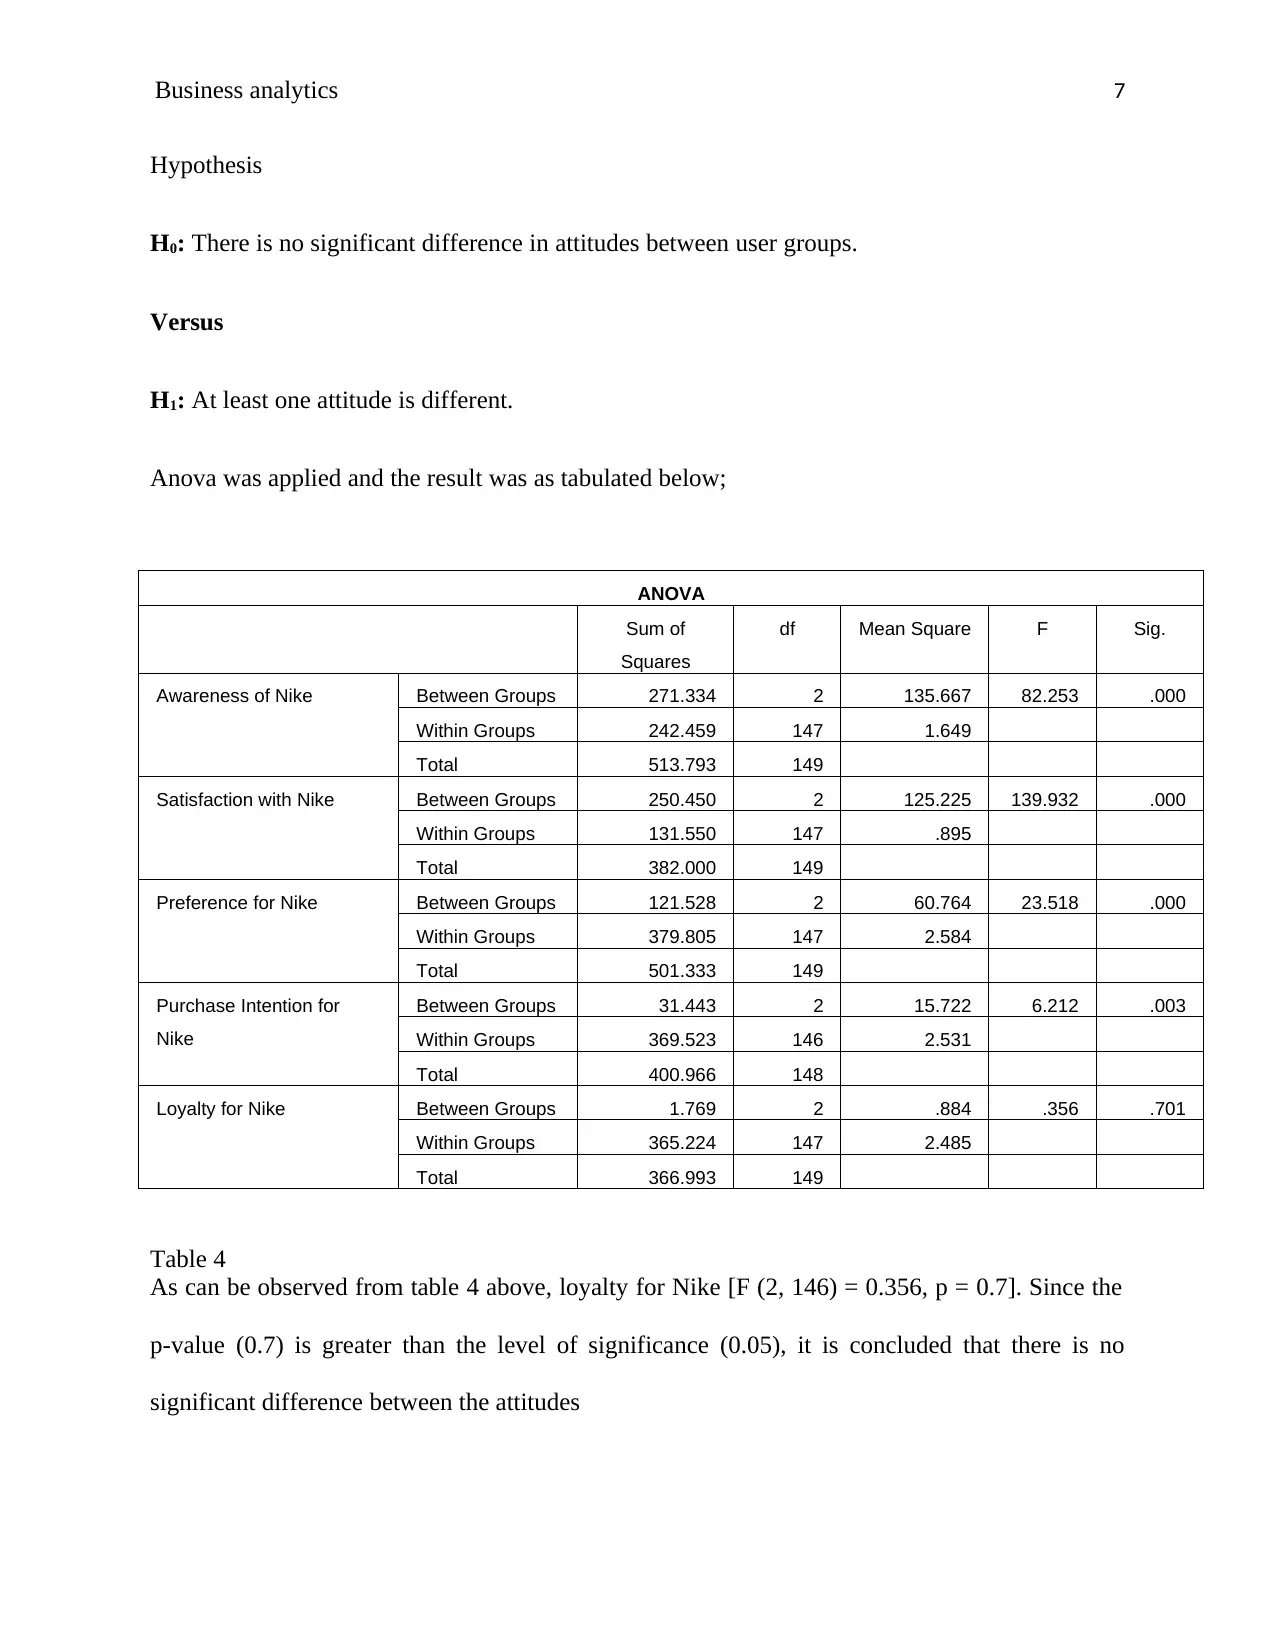
Hypothesis
H0: There is no significant difference in attitudes between user groups.
Versus
H1: At least one attitude is different.
Anova was applied and the result was as tabulated below;
ANOVA
Sum of
Squares
df Mean Square F Sig.
Awareness of Nike Between Groups 271.334 2 135.667 82.253 .000
Within Groups 242.459 147 1.649
Total 513.793 149
Satisfaction with Nike Between Groups 250.450 2 125.225 139.932 .000
Within Groups 131.550 147 .895
Total 382.000 149
Preference for Nike Between Groups 121.528 2 60.764 23.518 .000
Within Groups 379.805 147 2.584
Total 501.333 149
Purchase Intention for
Nike
Between Groups 31.443 2 15.722 6.212 .003
Within Groups 369.523 146 2.531
Total 400.966 148
Loyalty for Nike Between Groups 1.769 2 .884 .356 .701
Within Groups 365.224 147 2.485
Total 366.993 149
Table 4
As can be observed from table 4 above, loyalty for Nike [F (2, 146) = 0.356, p = 0.7]. Since the
p-value (0.7) is greater than the level of significance (0.05), it is concluded that there is no
significant difference between the attitudes
Paraphrase This Document
Need a fresh take? Get an instant paraphrase of this document with our AI Paraphraser

Business analytics 8
Is there any difference in the user groups on all of the customer attitudes?
The fourth question the research sought to answer was whether there was a difference in gender
in terms of attitude.
Hypothesis
H0: There is no significant difference in attitudes between the genders
Versus
H1: At least one attitude is different.
ANOVA
Sum of Squares df Mean Square F Sig.
Awareness of Nike
Between Groups 20.176 1 20.176 6.049 .015
Within Groups 493.617 148 3.335
Total 513.793 149
Satisfaction with Nike
Between Groups .684 1 .684 .266 .607
Within Groups 381.316 148 2.576
Total 382.000 149
Preference for Nike
Between Groups 35.979 1 35.979 11.443 .001
Within Groups 465.355 148 3.144
Total 501.333 149
Purchase Intention for Nike
Between Groups 6.054 1 6.054 2.253 .135
Within Groups 394.913 147 2.686
Total 400.966 148
Loyalty for Nike
Between Groups 84.526 1 84.526 44.288 .000
Within Groups 282.467 148 1.909
Total 366.993 149
Table 5
As can be observed from table 5 above, it can be observed that some p-values were greater than
level of significance (0.05) while other p-values were less than the level of significance (0.05).
This means that the attitudes are significantly different in terms of gender.
Business analytics 9
3.0 DISCUSSION OF THE RESULTS
The analysis of the data of this research highlighted various outcomes that went along in
answering this research’s questions. First Nike Company management sought to know whether
there was any significant difference in the two payment methods; that is credit card and PayPal.
The results from analysis gave varying means in the total amounts of credit card and PayPal. The
mean total purchases from credit cards were higher than the mean total purchases from PayPal.
This is an indication that customers are likely to use credit card more than PayPal.
The other question that the management wanted to find answers to was whether there was a
significant difference in customer attitude based on user groups. The results showed that some
user groups had significant differences in terms of attitude. This means that some user groups
were either light users or heavy users. Girls’ clothes and girls’ shoes were found to have the least
profit while women’s clothing was found to earn the company the highest profit.
4.0 RECOMMENDATIONS
After a keen analysis of the research results, the research recommends a number of things to the
C.E.O of Nike Company. Firstly, the company should encourage payments through PayPal. This
is because most of the payments have been seen to be done through credit card. If there are any
barriers or disadvantages of using PayPal, the company should address the issue as this will
widen their market as some of the customers might be purchasing goods somewhere else due to
payment method. However, it should also try to find out why many people use credit card as
opposed to PayPal. Since there was a significant difference in user groups, it means that some
users were heavy users. The research therefore recommends that online platform be also used as
Business analytics
10
a platform for marketing. On the same breadth, the management of the company should step up
marketing of girls’ shoes and clothing so as to boost their profits to the company.
Reference
Derrick, B., Toher, D., & White, P. (2017). How to compare the mean of two samples that
include paired observations and independent observations. Quantitative methods for
Psychology, 13(2), 120 - 126.
Secure Best Marks with AI Grader
Need help grading? Try our AI Grader for instant feedback on your assignments.
Business analytics
11
Gelman, A. (2005). Analysis of variance? Why it is more important than ever. The anals of
Statistics, 33, 1 - 53.
Hinkelmann, K., & Kempthorne, O. (2010). Design and analysis of experiments.
Howell, D. C. (2007). Statistical methods for Psychology.
Leigh, E. S. (2008). Consumer rites. Selling of American Holidays, 106 - 191.
1 out of 11
Related Documents


Your All-in-One AI-Powered Toolkit for Academic Success.
+13062052269
info@desklib.com
Available 24*7 on WhatsApp / Email
![[object Object]](/_next/static/media/star-bottom.7253800d.svg)
Unlock your academic potential
© 2024 | Zucol Services PVT LTD | All rights reserved.