BUS501: Data Analysis and Strategic Recommendations for Retail Surge
VerifiedAdded on 2023/06/04
|26
|4747
|387
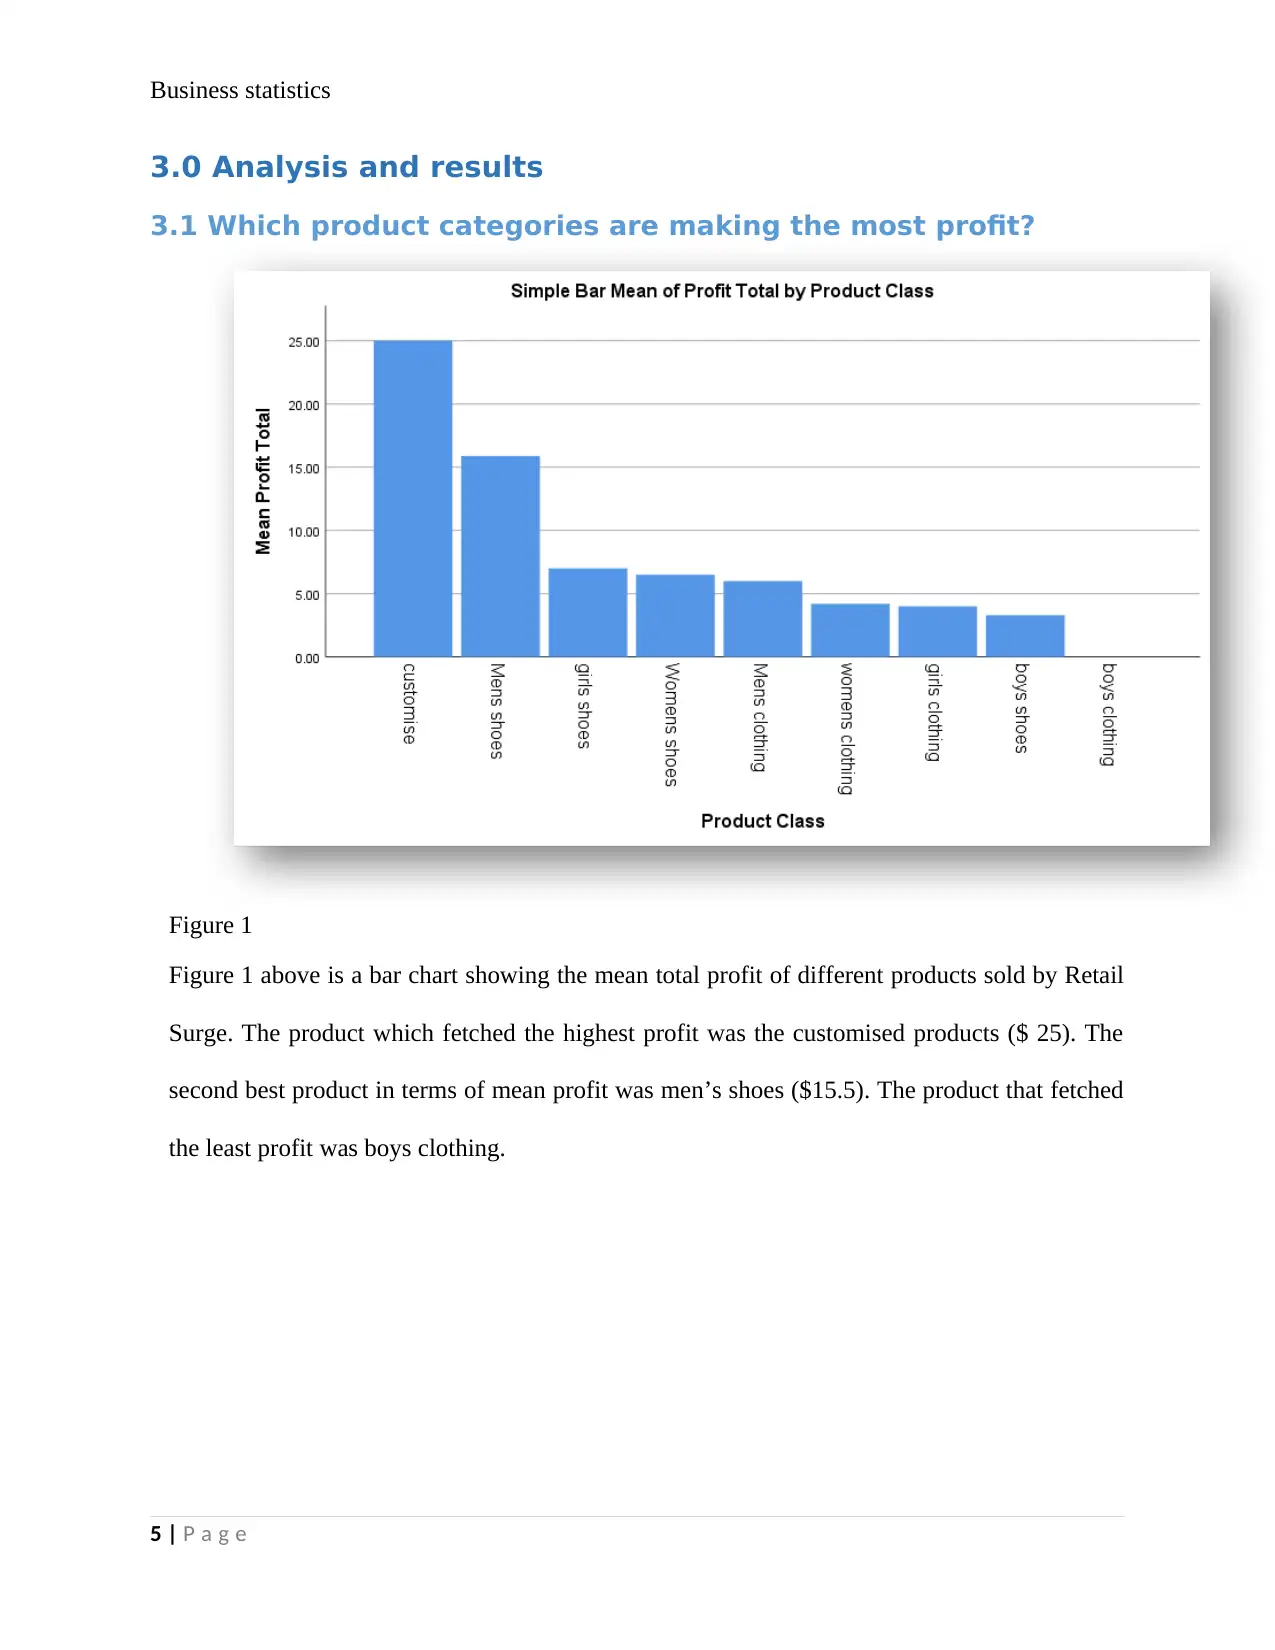
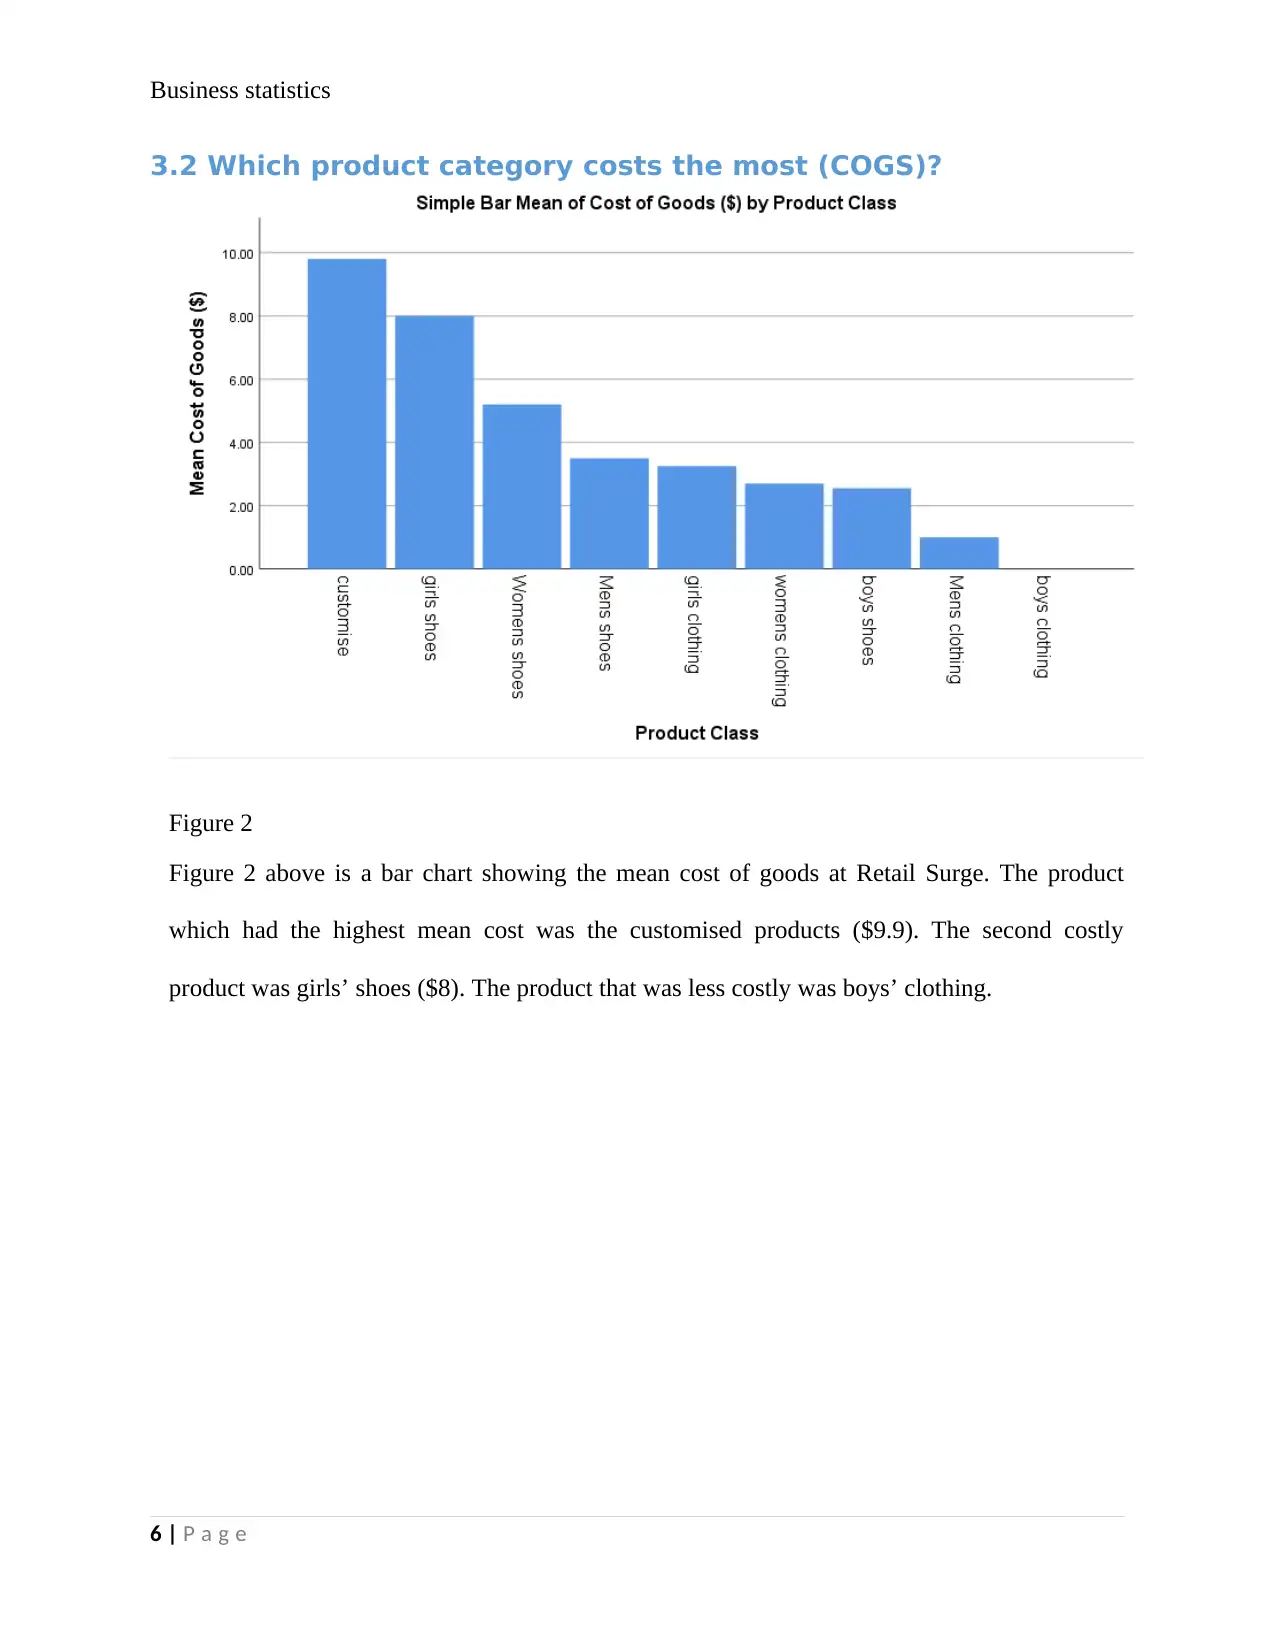
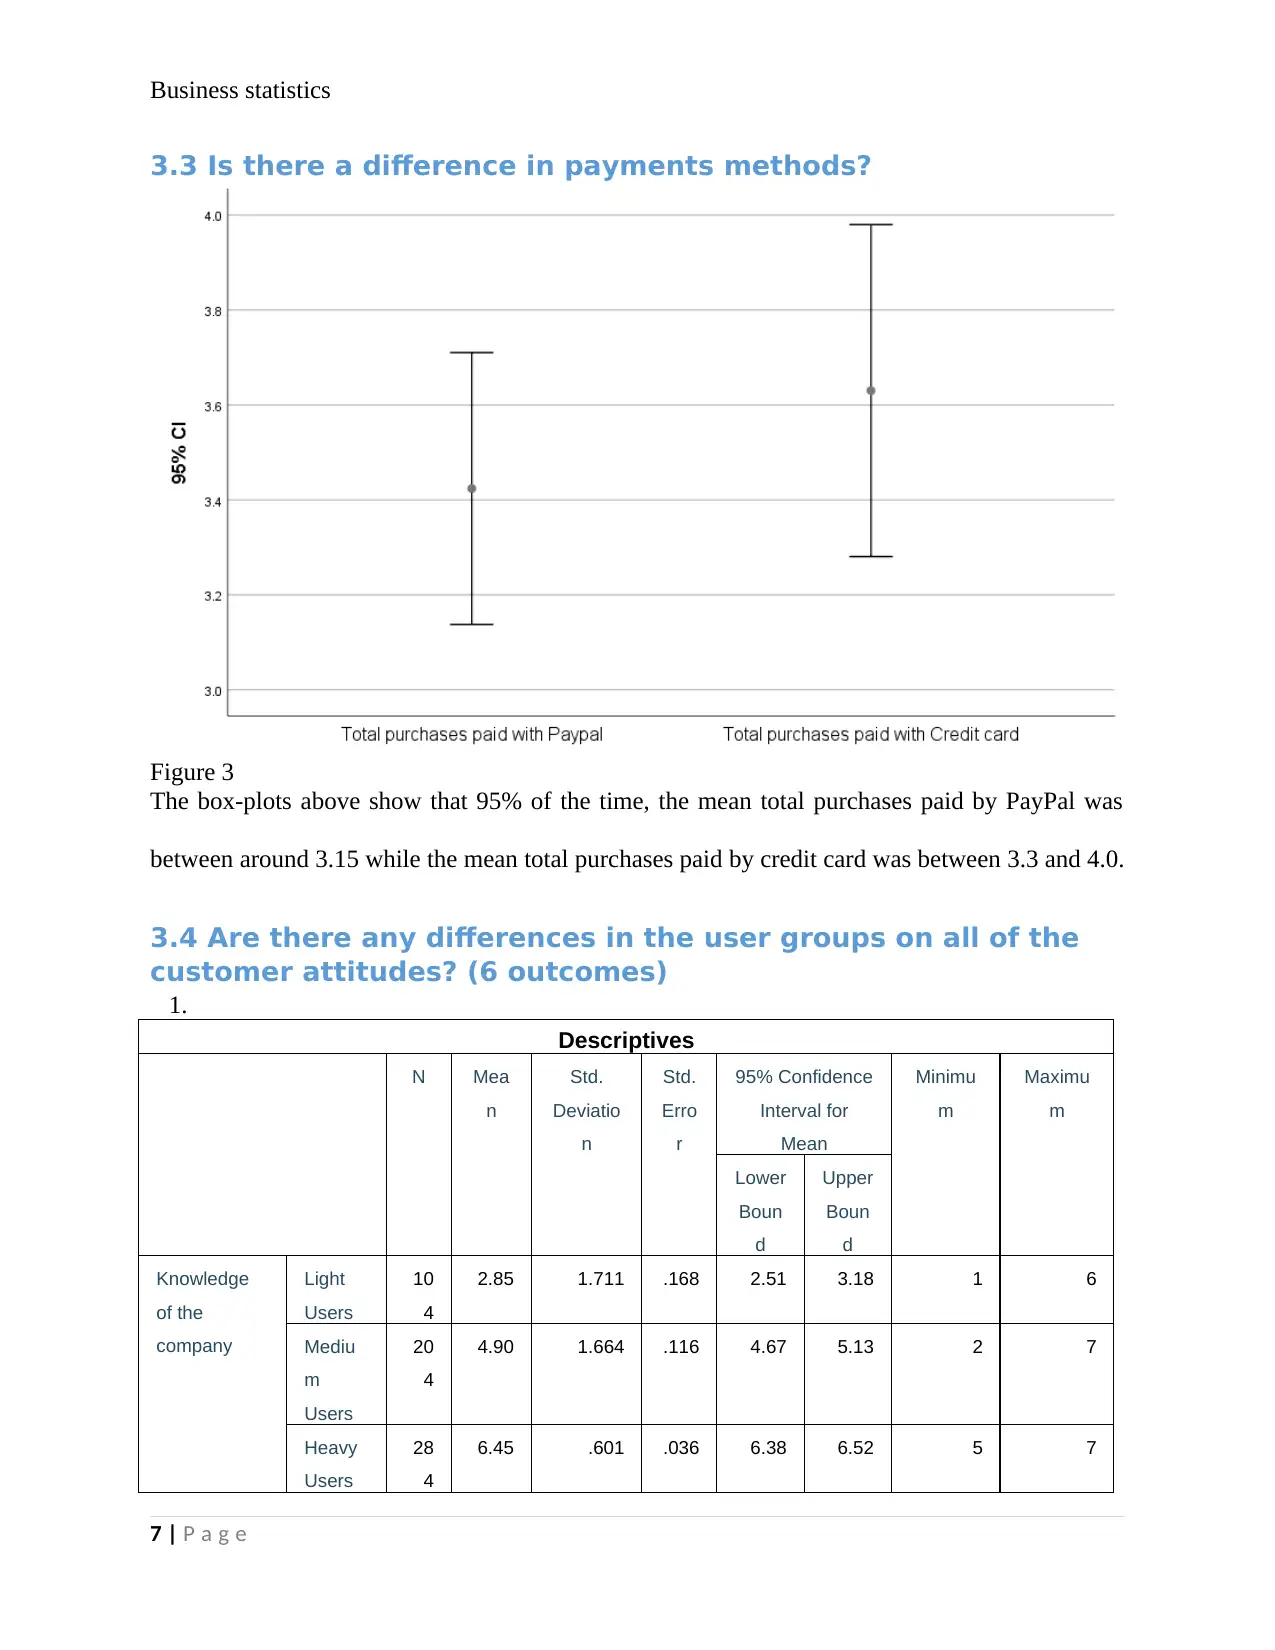
Report
AI Summary
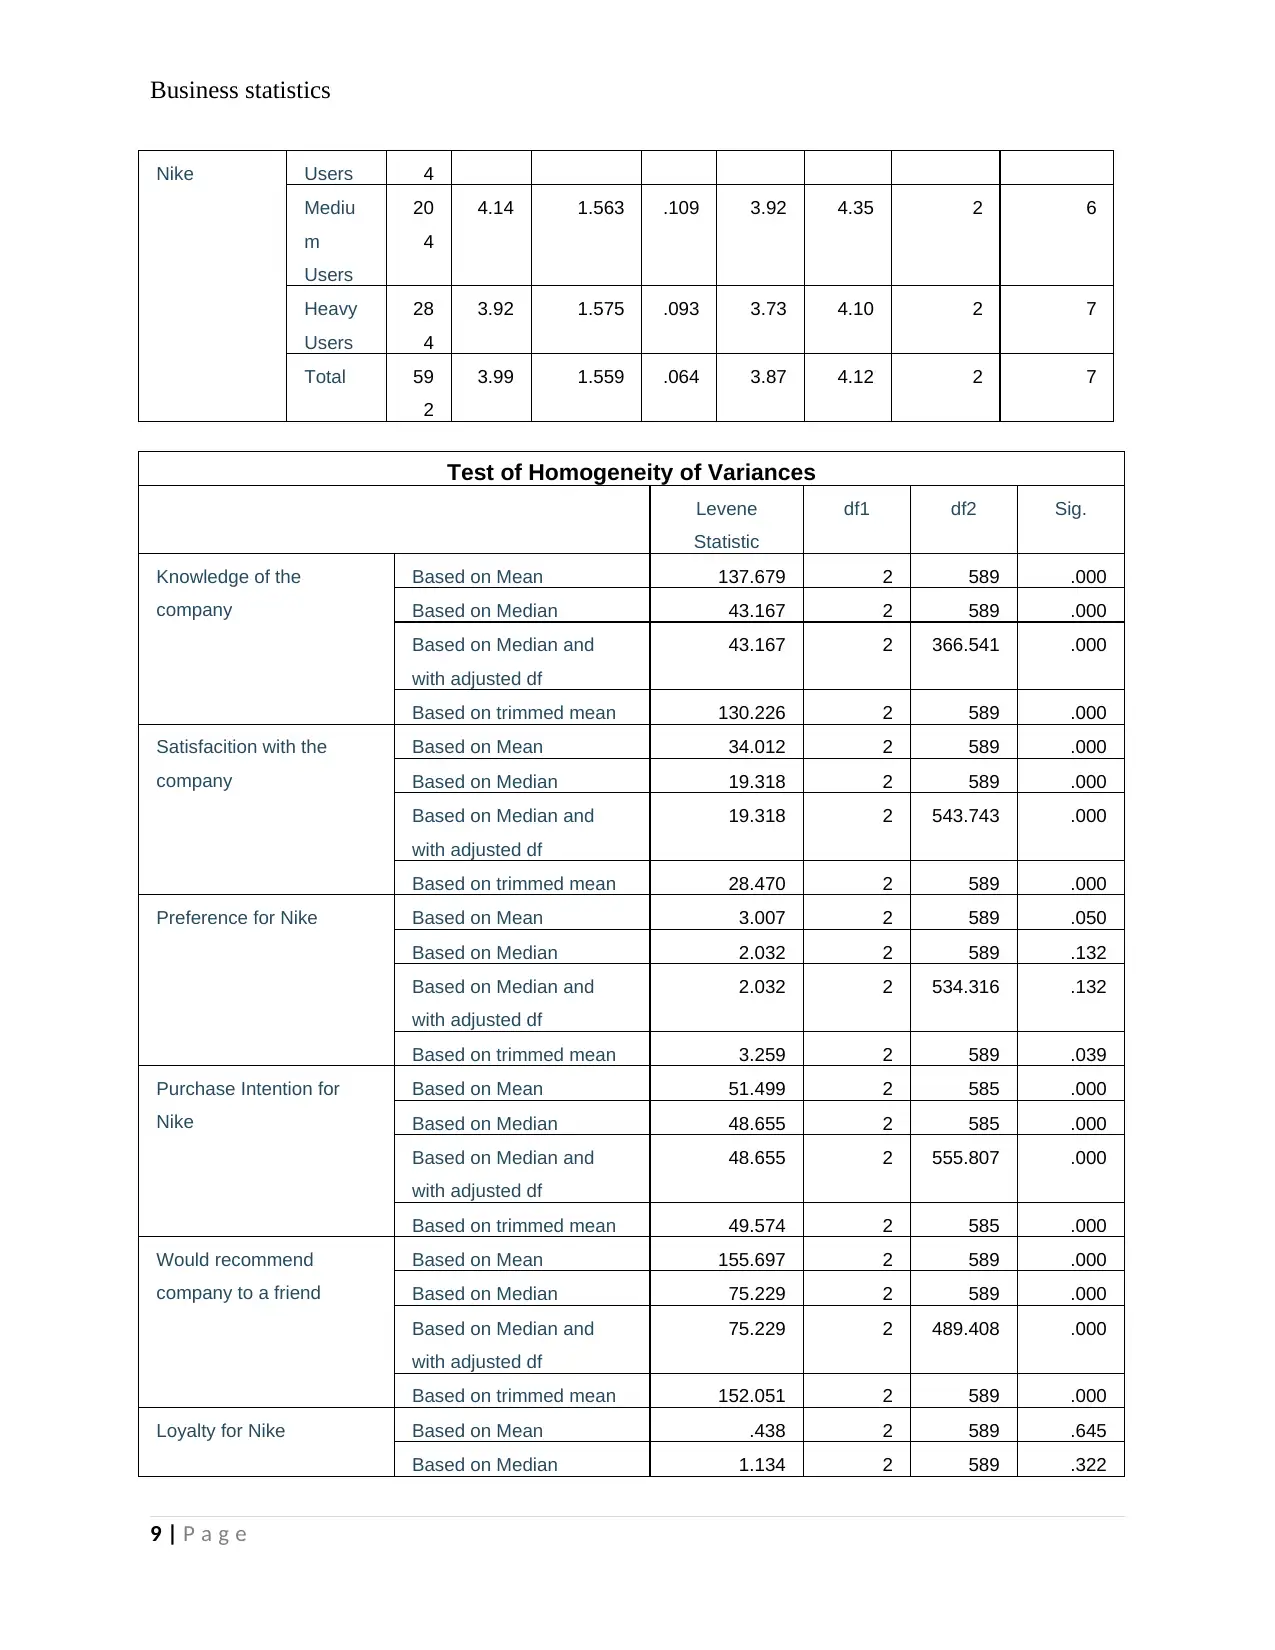
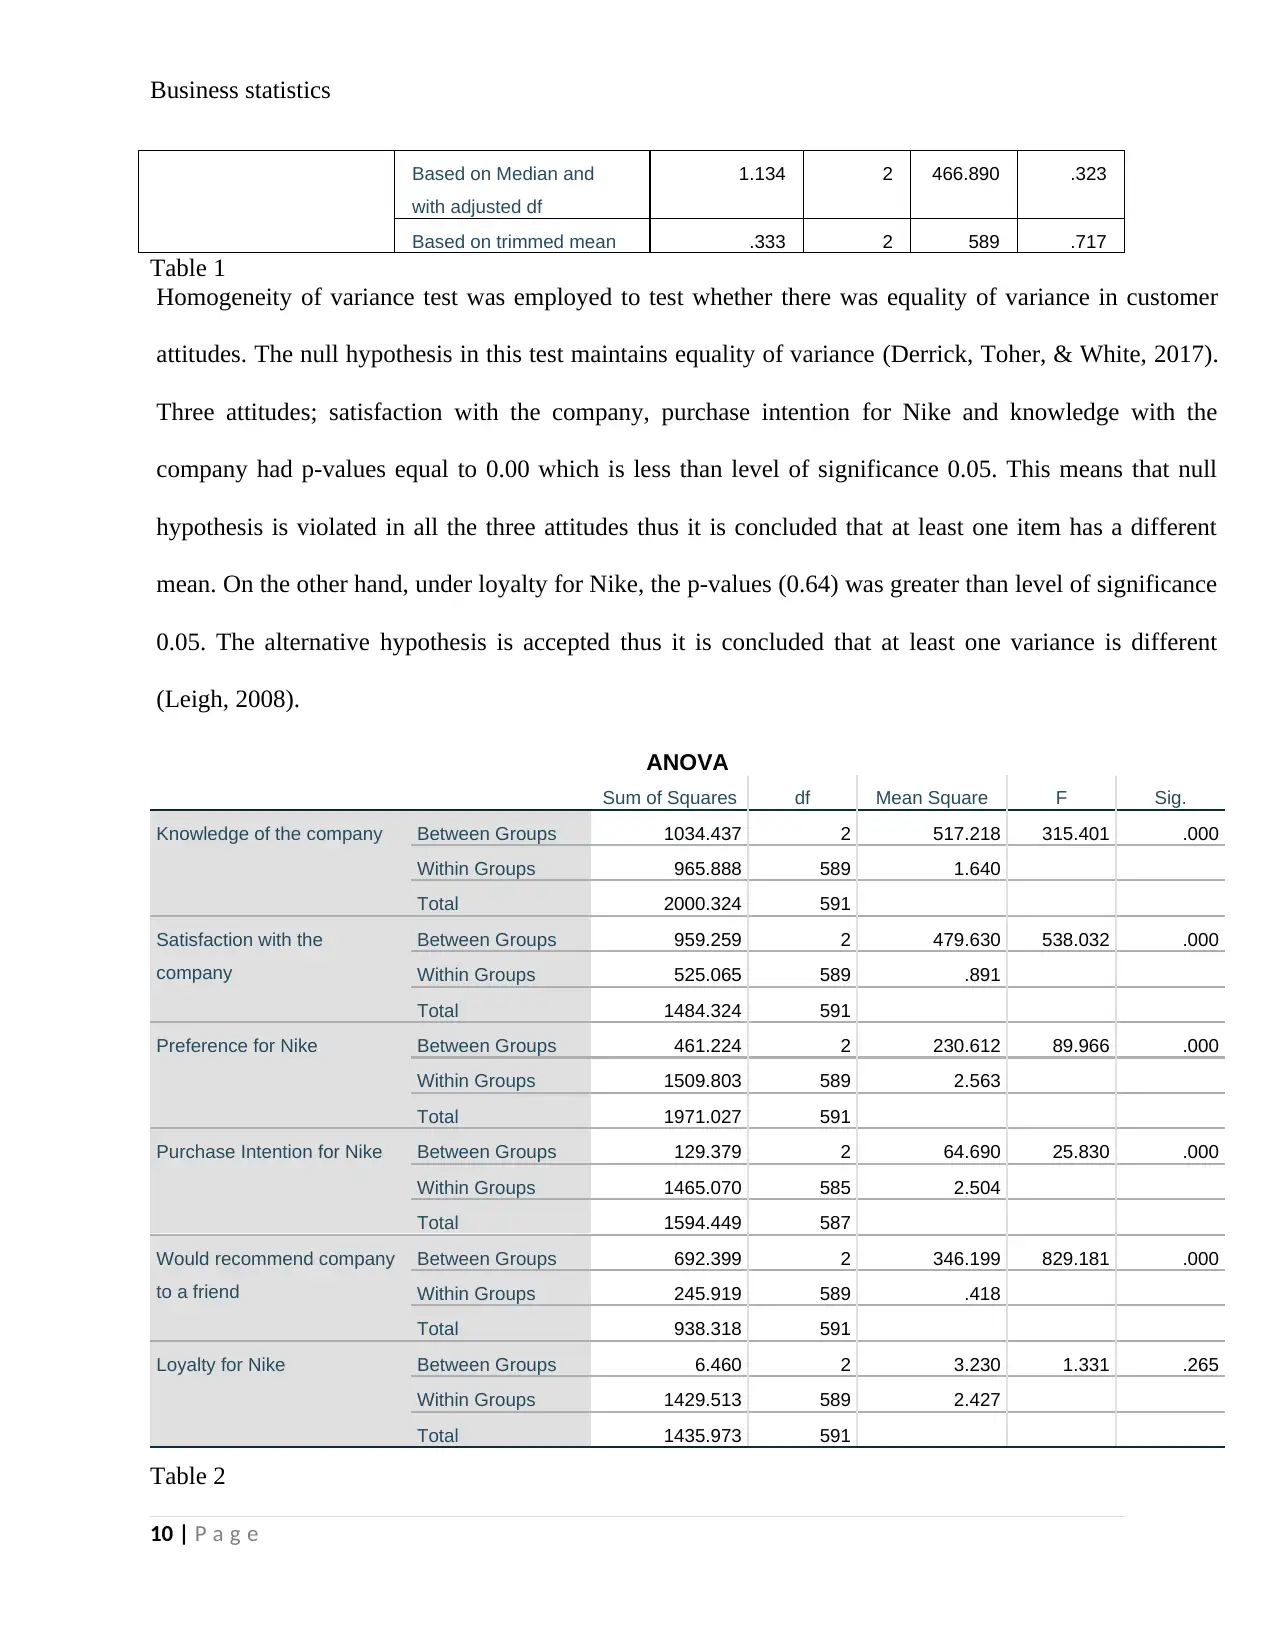
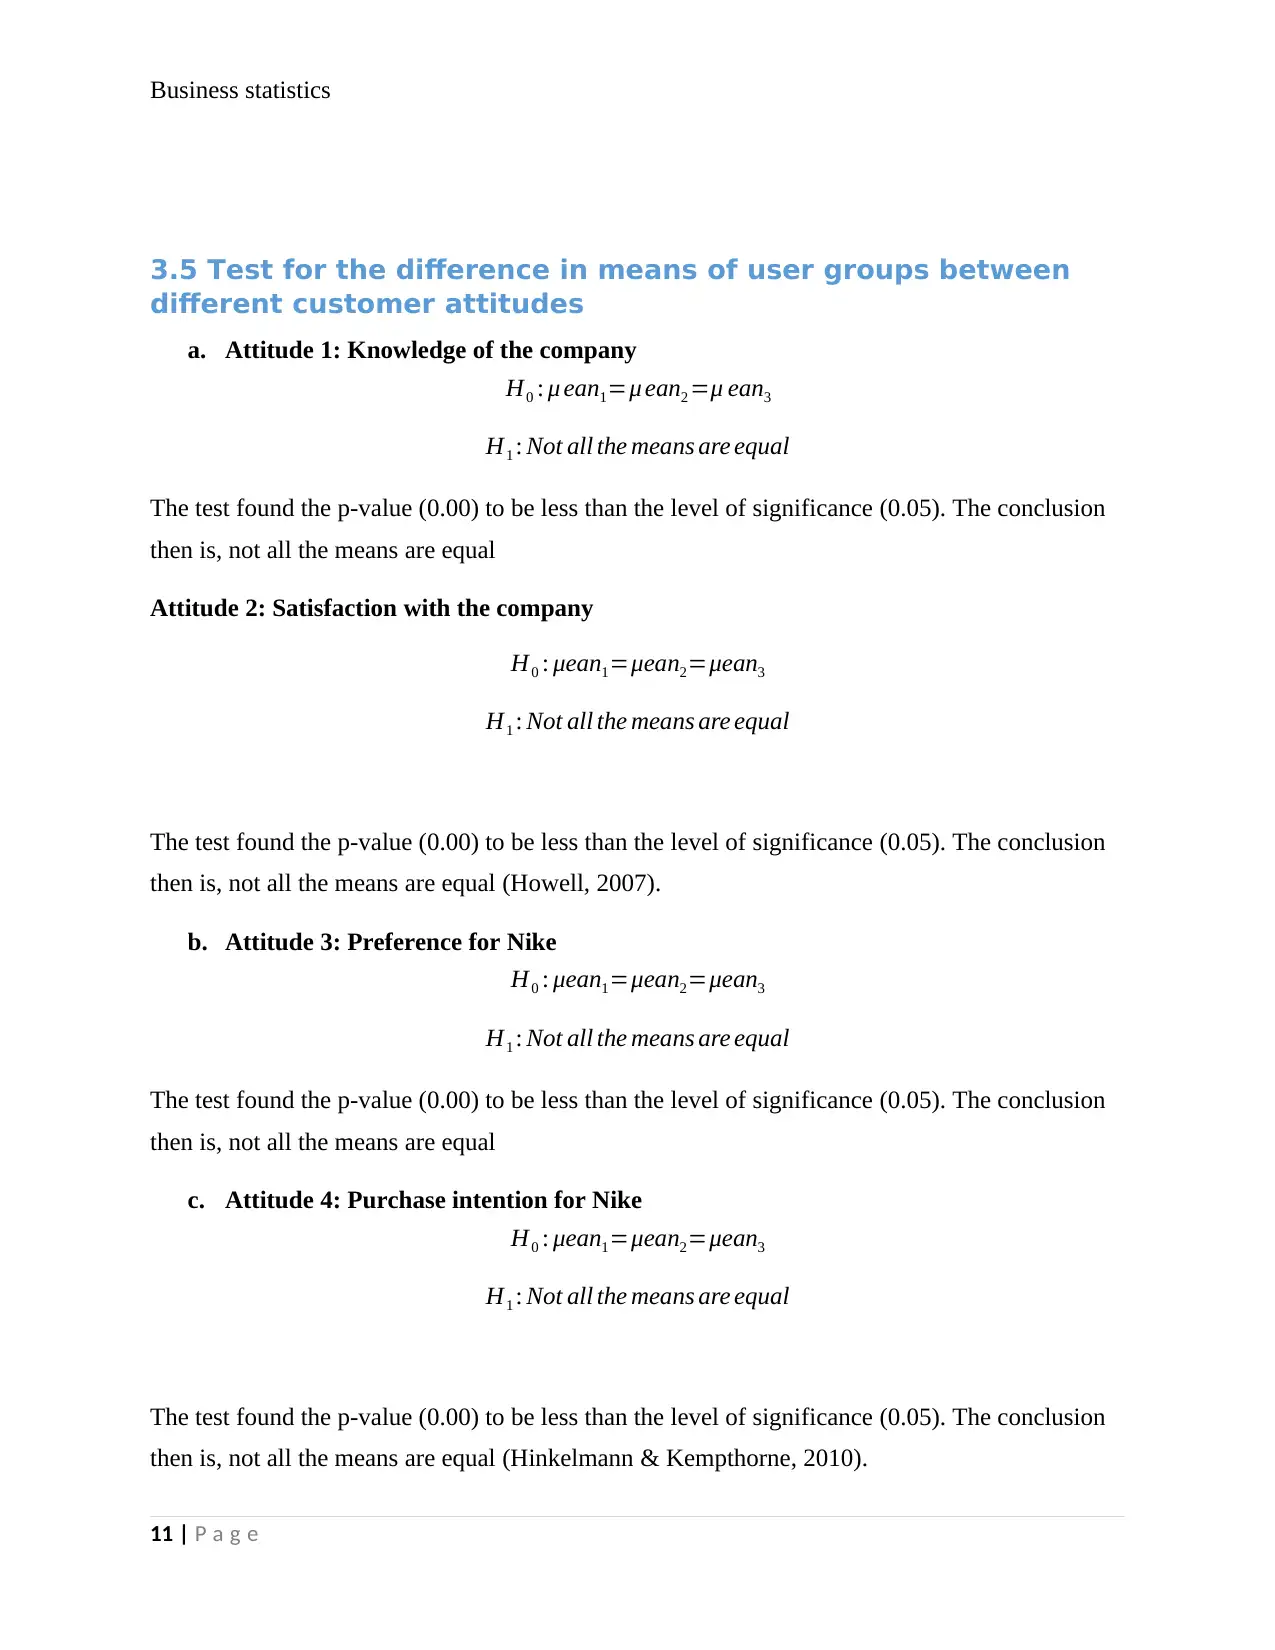
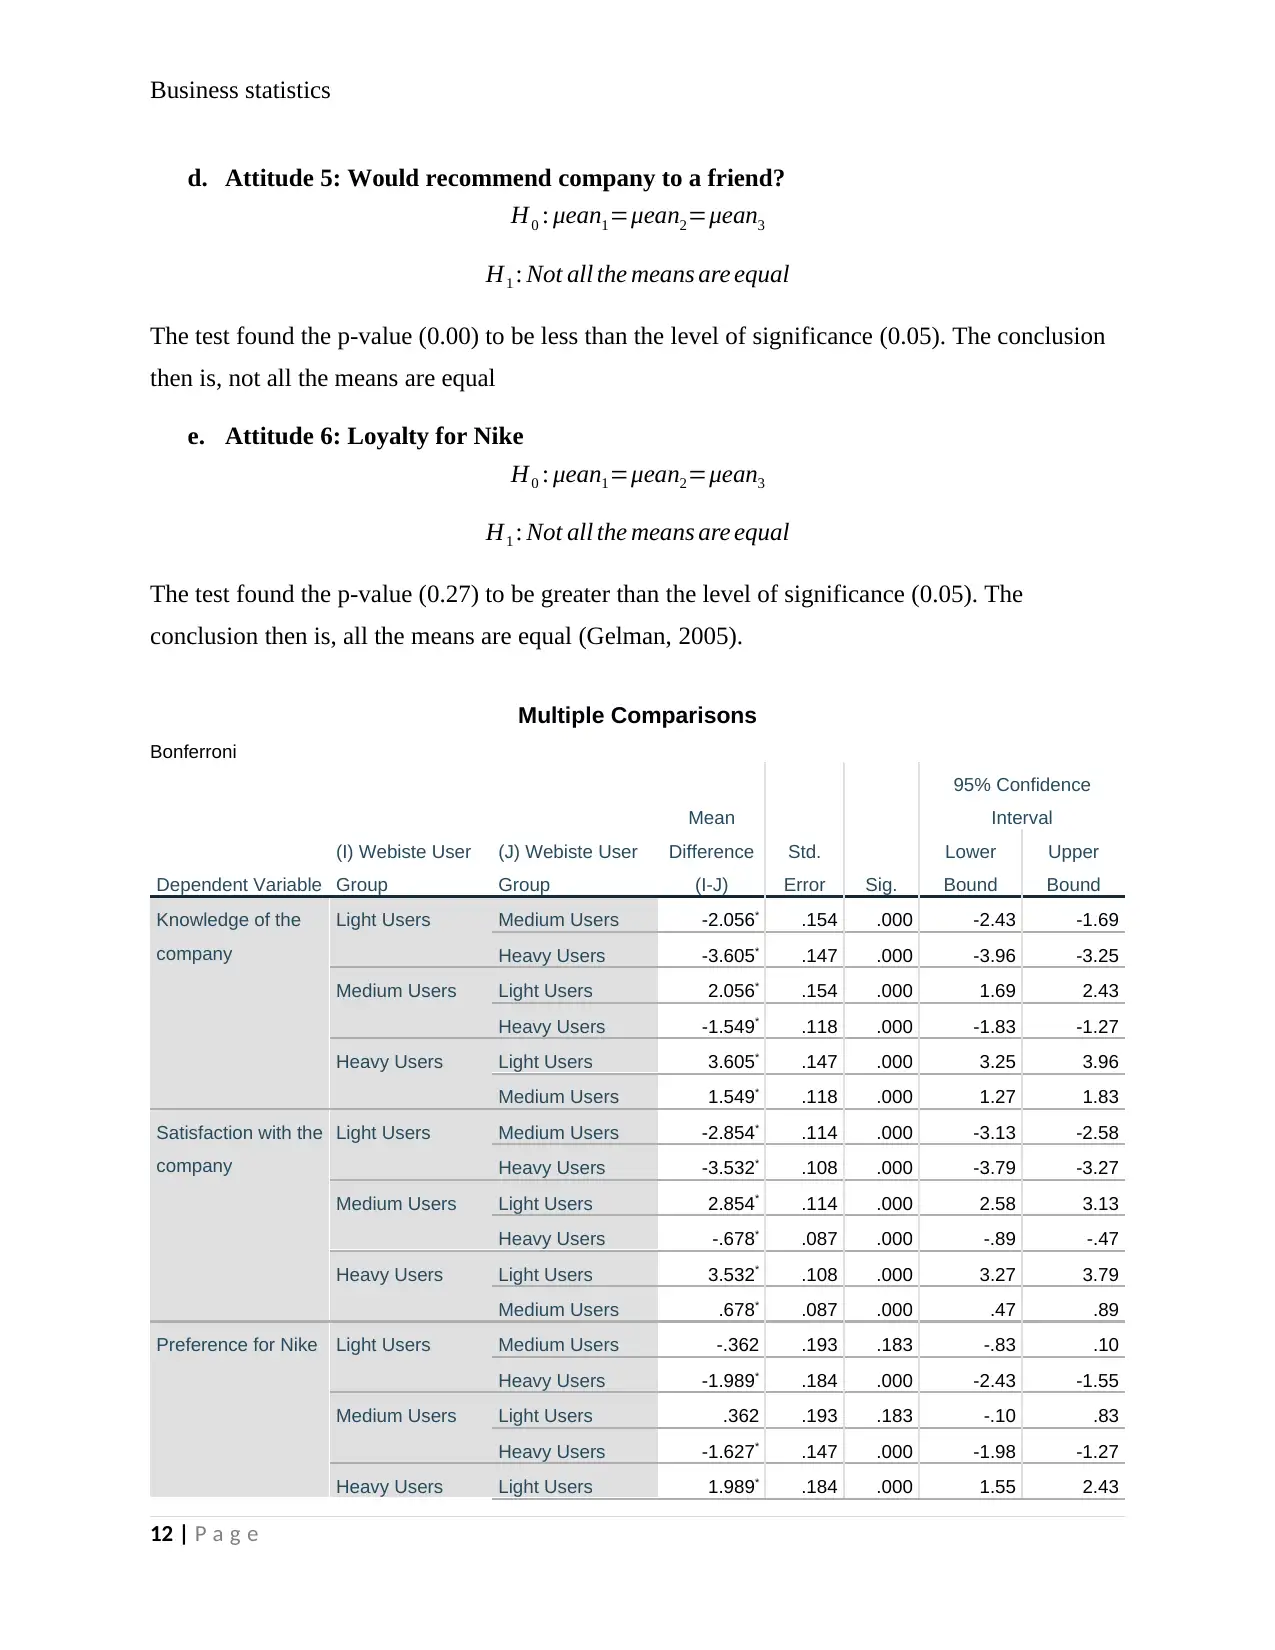
This report presents a comprehensive analysis of Retail Surge, an online retail company, focusing on key business aspects derived from customer data. The analysis identifies the most profitable product categories, with customized products leading in profit and cost. It examines payment method preferences, revealing differences in purchase amounts between PayPal and credit card users. Furthermore, the report investigates customer attitudes across different user groups (light, medium, heavy) and genders, assessing knowledge, satisfaction, preference, purchase intention, likelihood to recommend, and loyalty. Statistical tests, including ANOVA and independent t-tests, are employed to determine significant differences in means across these groups. The findings provide actionable insights for Retail Surge to optimize its product offerings, marketing strategies, and customer engagement efforts, ultimately aiming to improve sales and profitability. Desklib provides access to similar reports and solved assignments for students.
1 out of 26
Related Documents


![Harvest Kitchen: Sales Performance Analysis Report - [Course Name]](/_next/image/?url=https%3A%2F%2Fdesklib.com%2Fmedia%2Fimages%2Fqi%2F14aa28e27baa43b8a0e4a08921cb48ba.jpg&w=256&q=75)
Your All-in-One AI-Powered Toolkit for Academic Success.
+13062052269
info@desklib.com
Available 24*7 on WhatsApp / Email
![[object Object]](/_next/static/media/star-bottom.7253800d.svg)
Copyright © 2020–2026 A2Z Services. All Rights Reserved. Developed and managed by ZUCOL.