BUS5ATE Semester 1: Statistical Replication & Stock Market Analysis
VerifiedAdded on 2023/06/13
|18
|3781
|325
Report
AI Summary
This report presents a statistical replication and analysis of research on the FIFA World Cup's effect on the U.S. stock market. The original study, by Kaplanski and Levi, suggests that investor sentiment, influenced by the outcomes of World Cup matches, affects stock market returns. Losing, in particular, has a negative impact. The replication employs ordinary least squares regression and ANOVA in R to analyze the relationship between stock returns and various factors, including event days and dummy variables. The analysis confirms a statistically significant relationship between world cup events and stock market returns, supporting the idea that major sports events can influence investor behavior. This website provides access to past papers and solved assignments for students seeking further insights.

1
RUNNING HEAD: Research Statistical Replication and Analysis
SUMMARY
There are many factors influencing the stock market, these include events as unimagined as
sports and even obvious ones such as war. Generally, there is a relationship between change in
stock prices and investor sentiment. This is as demonstrated by Guy Kaplanski and Levi in their
paper on “Exploitable Predictable Irrationality” taking into account the FIFA world cup event.
( Kaplanski & Levi. 2010. Pp 535-553)
In the paper, the writers argue that losing and winning often shift the investor sentiment, which
in the end affect their investment decisions. Naturally, there is only a single winner out of every
football match encounter and therefore after every game the stock market gets affected.
To investigate this hypothesis, an ideal neutral market is chosen, in this case the US stock
market. This is due to its versatility of global investors and therefore all the games played in the
world cup are likely to affect it. In their findings, a conclusion that losing affects the stock
market negatively whereas the effect of winning is negligible.
One of the main hypotheses is that losing instigates a negative effect by the fans whose countries
lose. To test this, three methods are employed, i.e.:
i. Theoretical, independent of match results
ii. Comparing average returns on the stock market, given that during the game period. On
about 30 teams lose.
iii. Technical analysis, through use of exact data to determine relationship in stock market
and sporting periods
Paraphrase This Document
Need a fresh take? Get an instant paraphrase of this document with our AI Paraphraser

2
Research Statistical Replication and Analysis
In brief, the paper focuses on sentimental influence on the investment decisions made by
investors. Not only on local stock markets but also on international markets.
The major points drawn include:
i. US market has large number of investors compared to other markets
ii. Sentiments affect investor decisions, hence stock market. Hence there is a relationship
between stock market and investor sentiment
iii. Losing of country teams affects the stock market rather adversely
iv. Winning has a negligible positive effect

3
Research Statistical Replication and Analysis
CRITICAL EVALUATION
Several scholars have carried out research in order to answer the question of whether there is a
relationship between investor sentiment and investments. There have been a number of
researches conducted such as:
i. Investor sentiment and stock returns (Fisher & Meir. 2000)
ii. Sports sentiment and stock market returns (Sevil & Polat. 2015)
All these articles and many others seek to answer the same question as that rose in the research.
It is therefore important to determine the factors that influence the investor decision since it is
through this that the market may be modeled for prediction. Interestingly, games are among
instigators for sentiments, this is due to the loyalty attached to a particular team and even more
the spirit of nationalism. Therefore, the research question is important in contributing to the
learning of the mindset of the investor in relation to stock returns.
The research process is designed into six sections, each covering a specific aspect to consolidate
the whole research process, i.e.:
i. Introduction
ii. Background to the research motivation
iii. Methodology used in the research process
iv. Results and interpretations
v. Recommendations based on the results
vi. Conclusion
⊘ This is a preview!⊘
Do you want full access?
Subscribe today to unlock all pages.
Trusted by 1+ million students worldwide

4
Research Statistical Replication and Analysis
The study design is a standard research procedure; therefore, it captures most of the research
aspects. However, inclusion of the areas into which the research features would improve the
relevancy to the readers. I.e. explanation of the study context, hence it is sensible
The method on data analysis involves regression to determine the relationship presented among
the data variables; which include:
Date of investigated events
Return on stock
Influential variables i.e. dummy variables
The research involves multiple regressions i.e. Ri= Yo+ βXi + £I where R is the daily stock
returns, Y correlation coefficient intercept and Xi are the independent variables robustness check
and visual graphing, which is adequate to investigate multiple relations between interest
variables and in carrying out data interpretation. This enables to establish the significant factors.
The process of data analysis and output processing was done using Eview software.
Interestingly, despite the indirect relation between football and stock in America, the research
pitches the economic specification to determine stock trends during world cup events. In the
American stock market, this is because, according to the authors the fact that approximately a
third of the companies quoted in the stock market are foreign and therefore the stock market is
most likely to be influenced by foreign investor decisions. Therefore
In application of mathematics and statistics to economics, the authors set up an economic model
used to show the effect of football sport during world cup events in a period after the Second
Paraphrase This Document
Need a fresh take? Get an instant paraphrase of this document with our AI Paraphraser

5
Research Statistical Replication and Analysis
World War and 2006. The model specification includes outliers so as to be realistic and in line
with real life situation.
Model:
Ri= yo + ∑
1
2
y1iRi-1+ ∑
1
4
y2iDii+y3Hi + y4Ti + y5Pi+ y6Ei + ∑
1
2
y7iJii+ ɛi
Where ( Rt =daily return,Y0= regression intercept coefficient, Rt-1, Rt-2 =
1st and 2nd preceding day returns, Dit , [1,2,3,4], are dummy days of the week: Monday, Tuesday,
Wednesday, and Thursday,10 Ht is a dummy variable for days after a non-weekend holiday and
Tt is a dummy for first five days of taxation year, Pt is a dummy variable for the world cup
(June–July) event.) (Kaplanski & Levi, 2010. Pp 545).
The authors carry out a sensitivity analysis through:
i. Explaining the association between the inputted and outputted variables
ii. Simplifying the regression model to remove insignificant structure parts
iii. Lowering uncertainty by identifying the inputs
iv. Locating errors in the model
v. Testing model robustness
vi. Investigating key connections in the observations and forecasts
Therefore, the researchers carry out adequate sensitivity analysis.
After testing the null hypothesis, carrying out analysis and interpretation of the output, the
authors find a relationship between stock prices during the world cup events and the winning or
losing of teams. Therefore, they conclude that the world cup effect is:
Large

6
Research Statistical Replication and Analysis
Highly significant
Long-lasting
Such that the average return during the event is -2.58%, compared to normal days on the same
period when returns average on +1.21%.
This conclusion is sensible and is important in determining when to buy and sell stocks as major
sports events happen, it also suggests balancing on stocks bought to avoid bad losses during
world cup event.
⊘ This is a preview!⊘
Do you want full access?
Subscribe today to unlock all pages.
Trusted by 1+ million students worldwide
7
Research Statistical Replication and Analysis
REPLICATION
Ordinary Least Squares
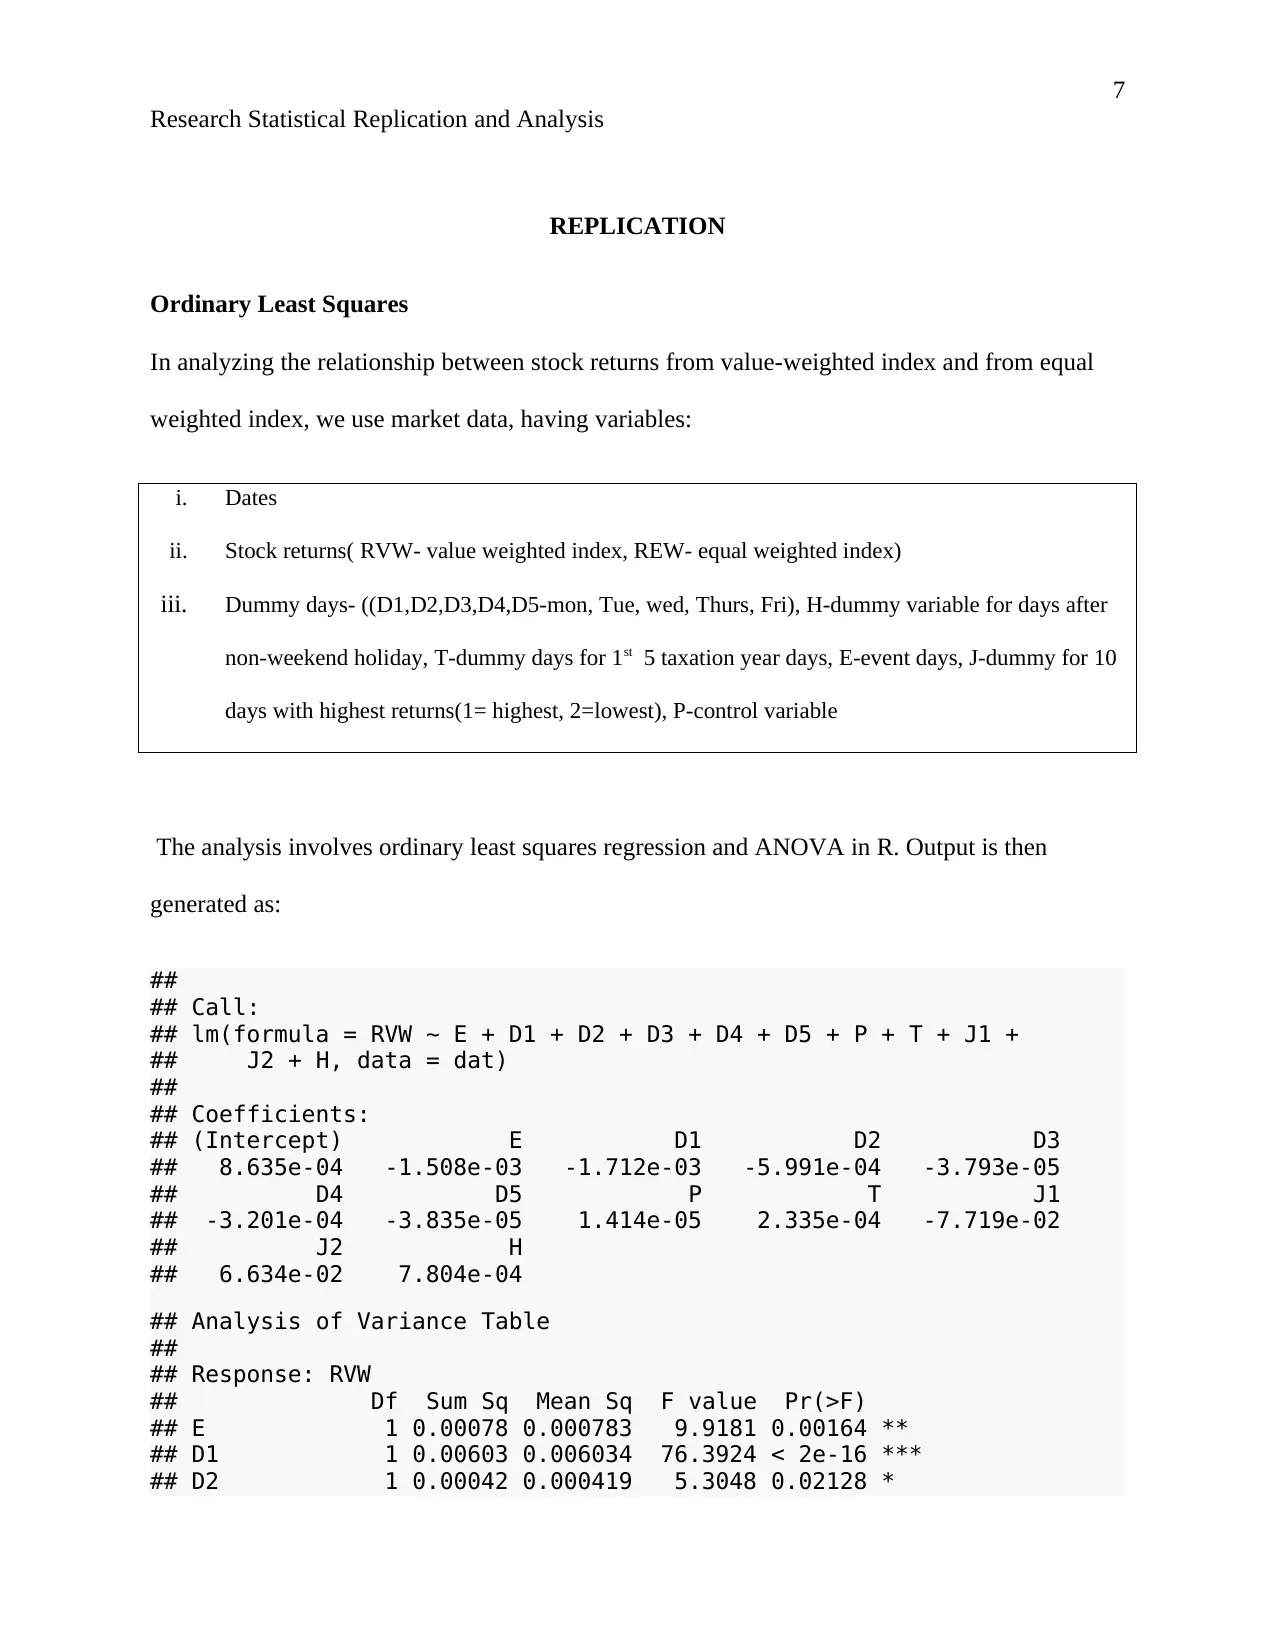
In analyzing the relationship between stock returns from value-weighted index and from equal
weighted index, we use market data, having variables:
i. Dates
ii. Stock returns( RVW- value weighted index, REW- equal weighted index)
iii. Dummy days- ((D1,D2,D3,D4,D5-mon, Tue, wed, Thurs, Fri), H-dummy variable for days after
non-weekend holiday, T-dummy days for 1st 5 taxation year days, E-event days, J-dummy for 10
days with highest returns(1= highest, 2=lowest), P-control variable
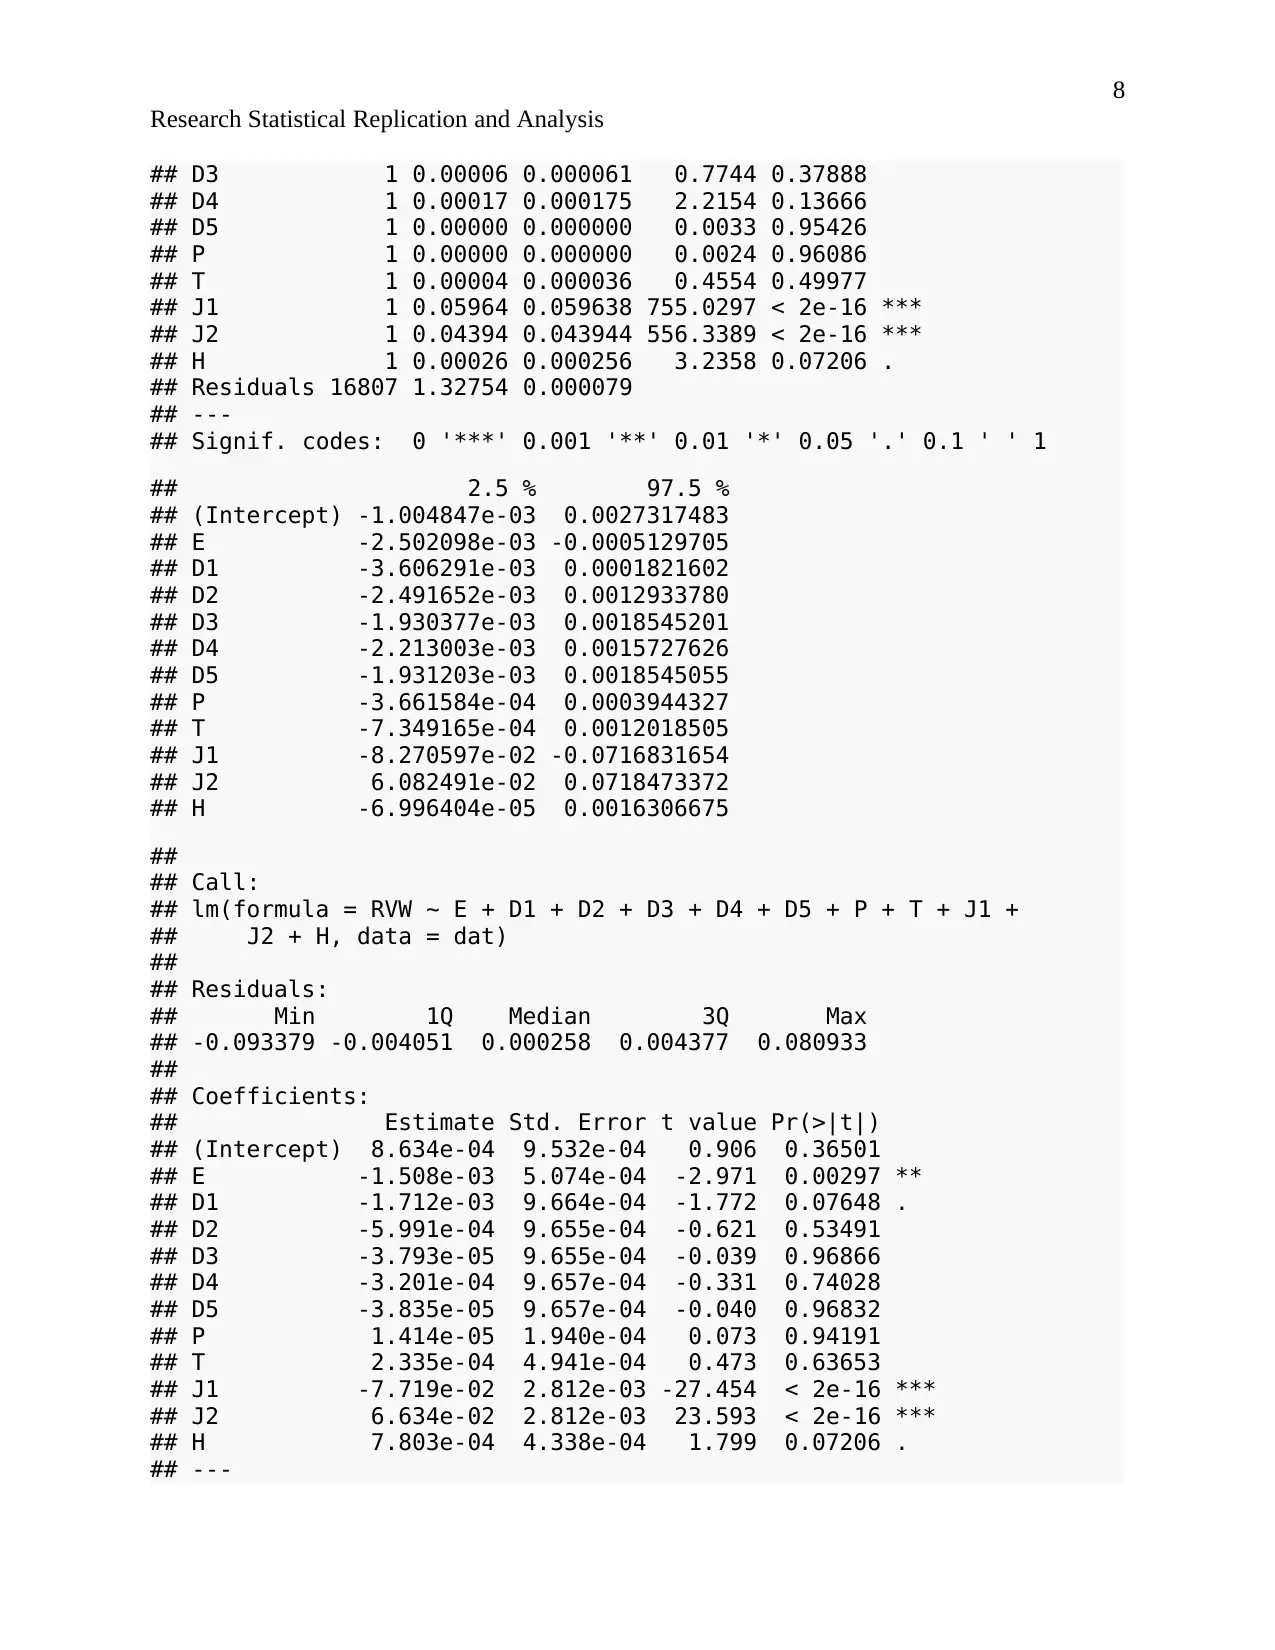
The analysis involves ordinary least squares regression and ANOVA in R. Output is then
generated as:
##
## Call:
## lm(formula = RVW ~ E + D1 + D2 + D3 + D4 + D5 + P + T + J1 +
## J2 + H, data = dat)
##
## Coefficients:
## (Intercept) E D1 D2 D3
## 8.635e-04 -1.508e-03 -1.712e-03 -5.991e-04 -3.793e-05
## D4 D5 P T J1
## -3.201e-04 -3.835e-05 1.414e-05 2.335e-04 -7.719e-02
## J2 H
## 6.634e-02 7.804e-04
## Analysis of Variance Table
##
## Response: RVW
## Df Sum Sq Mean Sq F value Pr(>F)
## E 1 0.00078 0.000783 9.9181 0.00164 **
## D1 1 0.00603 0.006034 76.3924 < 2e-16 ***
## D2 1 0.00042 0.000419 5.3048 0.02128 *
Research Statistical Replication and Analysis
REPLICATION
Ordinary Least Squares
In analyzing the relationship between stock returns from value-weighted index and from equal
weighted index, we use market data, having variables:
i. Dates
ii. Stock returns( RVW- value weighted index, REW- equal weighted index)
iii. Dummy days- ((D1,D2,D3,D4,D5-mon, Tue, wed, Thurs, Fri), H-dummy variable for days after
non-weekend holiday, T-dummy days for 1st 5 taxation year days, E-event days, J-dummy for 10
days with highest returns(1= highest, 2=lowest), P-control variable
The analysis involves ordinary least squares regression and ANOVA in R. Output is then
generated as:
##
## Call:
## lm(formula = RVW ~ E + D1 + D2 + D3 + D4 + D5 + P + T + J1 +
## J2 + H, data = dat)
##
## Coefficients:
## (Intercept) E D1 D2 D3
## 8.635e-04 -1.508e-03 -1.712e-03 -5.991e-04 -3.793e-05
## D4 D5 P T J1
## -3.201e-04 -3.835e-05 1.414e-05 2.335e-04 -7.719e-02
## J2 H
## 6.634e-02 7.804e-04
## Analysis of Variance Table
##
## Response: RVW
## Df Sum Sq Mean Sq F value Pr(>F)
## E 1 0.00078 0.000783 9.9181 0.00164 **
## D1 1 0.00603 0.006034 76.3924 < 2e-16 ***
## D2 1 0.00042 0.000419 5.3048 0.02128 *
Paraphrase This Document
Need a fresh take? Get an instant paraphrase of this document with our AI Paraphraser
8
Research Statistical Replication and Analysis
## D3 1 0.00006 0.000061 0.7744 0.37888
## D4 1 0.00017 0.000175 2.2154 0.13666
## D5 1 0.00000 0.000000 0.0033 0.95426
## P 1 0.00000 0.000000 0.0024 0.96086
## T 1 0.00004 0.000036 0.4554 0.49977
## J1 1 0.05964 0.059638 755.0297 < 2e-16 ***
## J2 1 0.04394 0.043944 556.3389 < 2e-16 ***
## H 1 0.00026 0.000256 3.2358 0.07206 .
## Residuals 16807 1.32754 0.000079
## ---
## Signif. codes: 0 '***' 0.001 '**' 0.01 '*' 0.05 '.' 0.1 ' ' 1
## 2.5 % 97.5 %
## (Intercept) -1.004847e-03 0.0027317483
## E -2.502098e-03 -0.0005129705
## D1 -3.606291e-03 0.0001821602
## D2 -2.491652e-03 0.0012933780
## D3 -1.930377e-03 0.0018545201
## D4 -2.213003e-03 0.0015727626
## D5 -1.931203e-03 0.0018545055
## P -3.661584e-04 0.0003944327
## T -7.349165e-04 0.0012018505
## J1 -8.270597e-02 -0.0716831654
## J2 6.082491e-02 0.0718473372
## H -6.996404e-05 0.0016306675
##
## Call:
## lm(formula = RVW ~ E + D1 + D2 + D3 + D4 + D5 + P + T + J1 +
## J2 + H, data = dat)
##
## Residuals:
## Min 1Q Median 3Q Max
## -0.093379 -0.004051 0.000258 0.004377 0.080933
##
## Coefficients:
## Estimate Std. Error t value Pr(>|t|)
## (Intercept) 8.634e-04 9.532e-04 0.906 0.36501
## E -1.508e-03 5.074e-04 -2.971 0.00297 **
## D1 -1.712e-03 9.664e-04 -1.772 0.07648 .
## D2 -5.991e-04 9.655e-04 -0.621 0.53491
## D3 -3.793e-05 9.655e-04 -0.039 0.96866
## D4 -3.201e-04 9.657e-04 -0.331 0.74028
## D5 -3.835e-05 9.657e-04 -0.040 0.96832
## P 1.414e-05 1.940e-04 0.073 0.94191
## T 2.335e-04 4.941e-04 0.473 0.63653
## J1 -7.719e-02 2.812e-03 -27.454 < 2e-16 ***
## J2 6.634e-02 2.812e-03 23.593 < 2e-16 ***
## H 7.803e-04 4.338e-04 1.799 0.07206 .
## ---
9
Research Statistical Replication and Analysis
## Signif. codes: 0 '***' 0.001 '**' 0.01 '*' 0.05 '.' 0.1 ' ' 1
##
## Residual standard error: 0.008887 on 16807 degrees of freedom
## Multiple R-squared: 0.07738, Adjusted R-squared: 0.07678
## F-statistic: 128.2 on 11 and 16807 DF, p-value: < 2.2e-16
##
## Call:
## lm(formula = REW ~ E + D1 + D2 + D3 + D4 + D5 + P + T + J1 +
## J2 + H, data = dat)
##
## Coefficients:
## (Intercept) E D1 D2 D3
## 0.0014420 -0.0015814 -0.0026029 -0.0015233 -0.0003506
## D4 D5 P T J1
## -0.0003392 0.0004399 -0.0001446 0.0038606 -0.0742936
## J2 H
## 0.0642939 0.0011366
## Analysis of Variance Table
##
## Response: REW
## Df Sum Sq Mean Sq F value Pr(>F)
## E 1 0.00113 0.001132 19.8745 8.323e-06 ***
## D1 1 0.01289 0.012892 226.4225 < 2.2e-16 ***
## D2 1 0.00472 0.004717 82.8424 < 2.2e-16 ***
## D3 1 0.00032 0.000323 5.6813 0.017158 *
## D4 1 0.00113 0.001129 19.8209 8.560e-06 ***
## D5 1 0.00001 0.000010 0.1750 0.675733
## P 1 0.00012 0.000121 2.1253 0.144903
## T 1 0.00523 0.005230 91.8443 < 2.2e-16 ***
## J1 1 0.05525 0.055248 970.3085 < 2.2e-16 ***
## J2 1 0.04127 0.041269 724.7842 < 2.2e-16 ***
## H 1 0.00054 0.000542 9.5230 0.002032 **
## Residuals 16807 0.95698 0.000057
## ---
## Signif. codes: 0 '***' 0.001 '**' 0.01 '*' 0.05 '.' 0.1 ' ' 1
## 2.5 % 97.5 %
## (Intercept) -0.0001442574 3.028253e-03
## E -0.0024258467 -7.370025e-04
## D1 -0.0042112063 -9.946690e-04
## D2 -0.0031301073 8.352524e-05
## D3 -0.0019573948 1.256125e-03
## D4 -0.0019462919 1.267965e-03
## D5 -0.0011671802 2.047028e-03
## P -0.0004674439 1.783265e-04
## T 0.0030383836 4.682772e-03
## J1 -0.0789730126 -6.961424e-02
⊘ This is a preview!⊘
Do you want full access?
Subscribe today to unlock all pages.
Trusted by 1+ million students worldwide
10
Research Statistical Replication and Analysis
## J2 0.0596146273 6.897309e-02
## H 0.0004146666 1.858567e-03
##
## Call:
## lm(formula = REW ~ E + D1 + D2 + D3 + D4 + D5 + P + T + J1 +
## J2 + H, data = dat)
##
## Residuals:
## Min 1Q Median 3Q Max
## -0.062057 -0.003094 0.000523 0.003706 0.048395
##
## Coefficients:
## Estimate Std. Error t value Pr(>|t|)
## (Intercept) 0.0014420 0.0008093 1.782 0.074792 .
## E -0.0015814 0.0004308 -3.671 0.000242 ***
## D1 -0.0026029 0.0008205 -3.172 0.001515 **
## D2 -0.0015233 0.0008198 -1.858 0.063156 .
## D3 -0.0003506 0.0008197 -0.428 0.668844
## D4 -0.0003392 0.0008199 -0.414 0.679132
## D5 0.0004399 0.0008199 0.537 0.591583
## P -0.0001446 0.0001647 -0.878 0.380197
## T 0.0038606 0.0004195 9.204 < 2e-16 ***
## J1 -0.0742936 0.0023873 -31.120 < 2e-16 ***
## J2 0.0642939 0.0023872 26.932 < 2e-16 ***
## H 0.0011366 0.0003683 3.086 0.002032 **
## ---
## Signif. codes: 0 '***' 0.001 '**' 0.01 '*' 0.05 '.' 0.1 ' ' 1
##
## Residual standard error: 0.007546 on 16807 degrees of freedom
## Multiple R-squared: 0.1136, Adjusted R-squared: 0.113
## F-statistic: 195.8 on 11 and 16807 DF, p-value: < 2.2e-16
Paraphrase This Document
Need a fresh take? Get an instant paraphrase of this document with our AI Paraphraser

11
Research Statistical Replication and Analysis
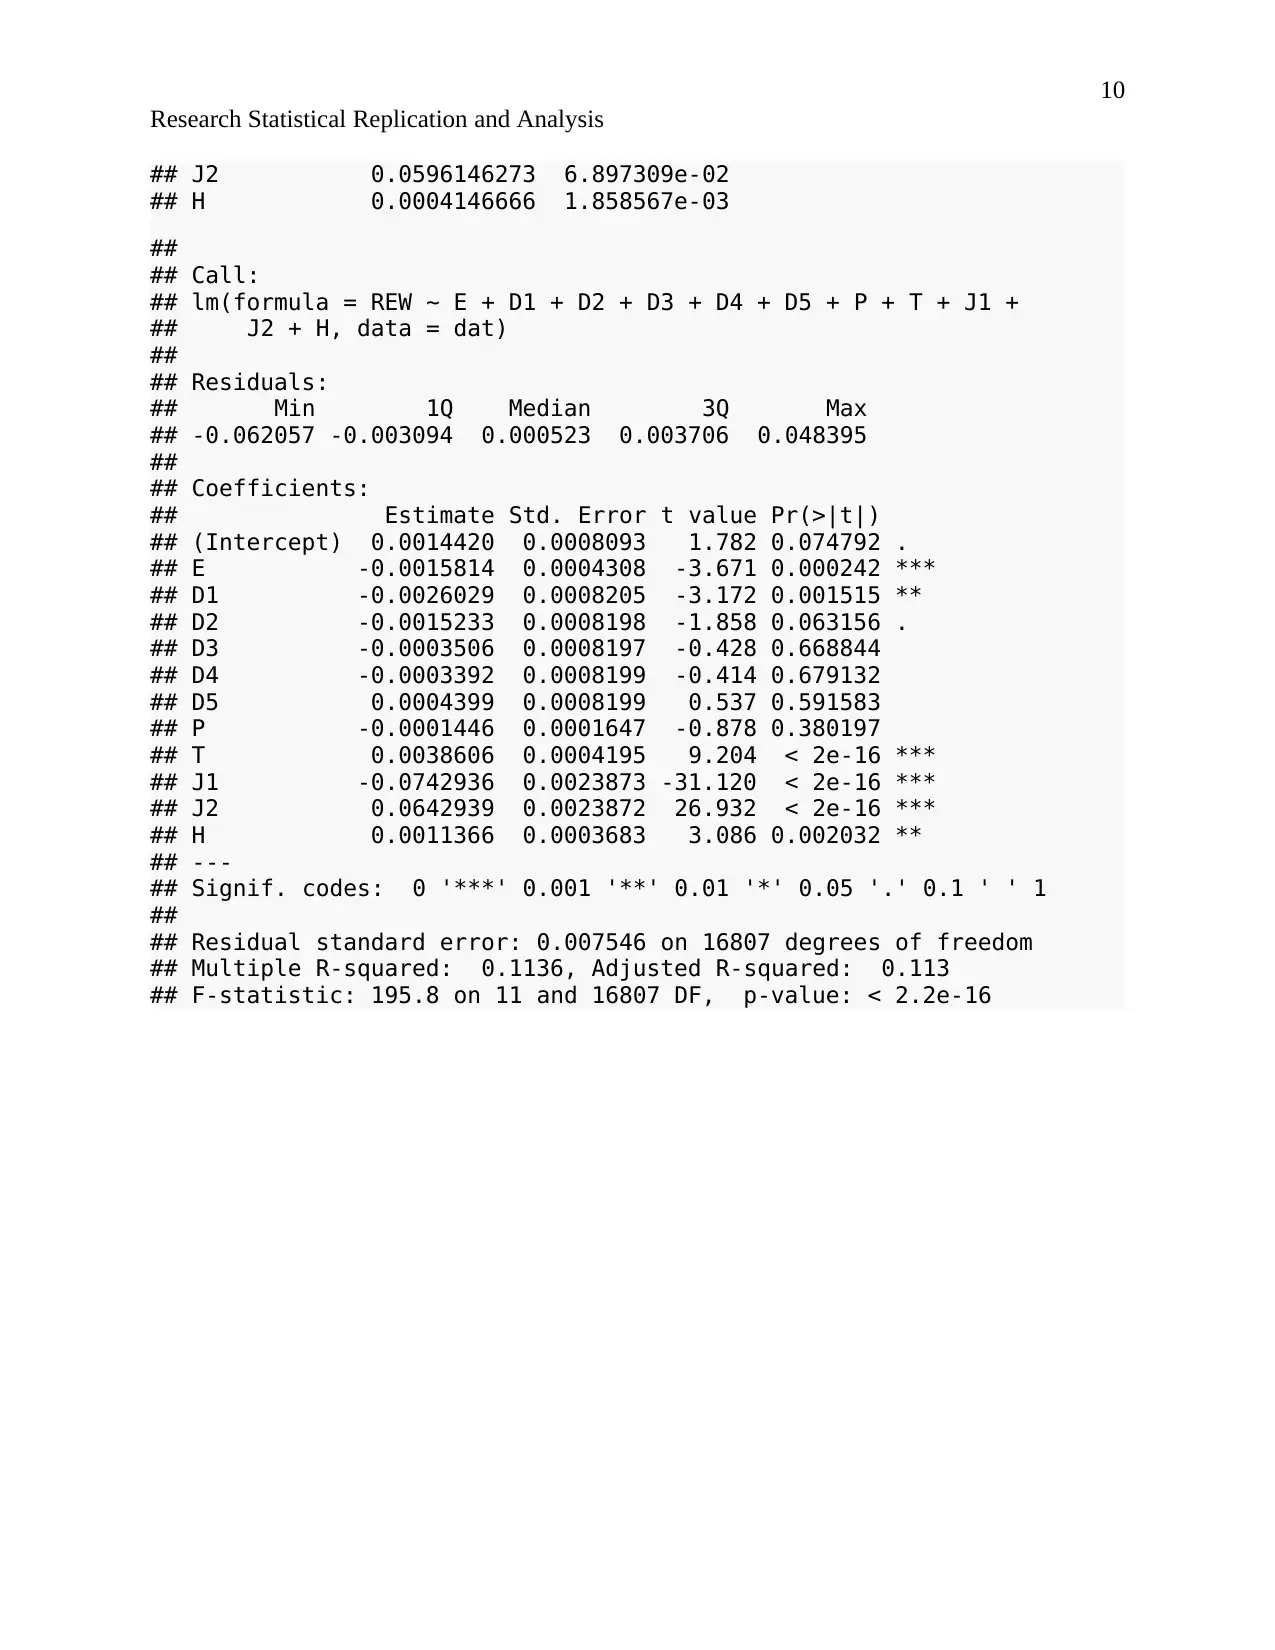
The conclusions drawn from the analysis include:
i. The world cup coefficient is positive for returns on stock from equal weighted index and
for value weighted index
ii. REW is the most affected during the world cup event days more than RVW
iii. The world cup coefficient is very large and enormously significant( t-value ranges from -
6.371 to -31.120)
iv. There is a negligible robust significance in most of the test variables
v. There are few outliers in the models used, i.e. all the variables affected the equal and
valued stock returns during the world cup event
Research Statistical Replication and Analysis
The conclusions drawn from the analysis include:
i. The world cup coefficient is positive for returns on stock from equal weighted index and
for value weighted index
ii. REW is the most affected during the world cup event days more than RVW
iii. The world cup coefficient is very large and enormously significant( t-value ranges from -
6.371 to -31.120)
iv. There is a negligible robust significance in most of the test variables
v. There are few outliers in the models used, i.e. all the variables affected the equal and
valued stock returns during the world cup event

12
Research Statistical Replication and Analysis
FURTHER ANALYSIS
Do Olympic Games affect market returns
Economic theorists often argue that major multiregional boost local economies of the host
countries, this includes:
i. International games such as world cup and Olympics
ii. Trade conventions
iii. Democratic national conventions
This is suggested to be due to a gush in the economic activities connected to the event. (Ross.
2018) . Previous research shows that when a country wins an Olympic medal, national stock
activity decreases (Jessica & Markellos, 2018).
The suggested reasons infer that games distract both the public and investors alike. The main
hypothesis is that Olympic games affect the stock market of the host country and the
international markets of other countries participating in the event. Our null hypothesis is that
Olympic Games do not affect the stock market and that stock markets are independent of
investor swayed sentiments.
⊘ This is a preview!⊘
Do you want full access?
Subscribe today to unlock all pages.
Trusted by 1+ million students worldwide
1 out of 18

Your All-in-One AI-Powered Toolkit for Academic Success.
+13062052269
info@desklib.com
Available 24*7 on WhatsApp / Email
![[object Object]](/_next/static/media/star-bottom.7253800d.svg)
Unlock your academic potential
Copyright © 2020–2026 A2Z Services. All Rights Reserved. Developed and managed by ZUCOL.