BUS5CA Customer Analytics and Social Media: Customer Segmentation
VerifiedAdded on 2023/06/04
|11
|2484
|257
Case Study
AI Summary
This case study focuses on customer segmentation and profiling within the retail sector, aiming to develop analytical skills for categorizing customers based on their purchasing behavior. The analysis utilizes demographic and behavioral data to create targeted marketing models. The study employs SAS Miner for K-means clustering, identifying five distinct customer clusters based on demographic variables such as age, profession, education, and marital status. It further explores customer segmentation using behavioral data, including personal loans, mortgages, and credit defaults, to understand subscription patterns. A cross-cluster analysis combines demographic and behavioral segments to identify key customer groups. The study concludes by integrating both data types to determine the most influential variables, such as default credit and personal loans, in predicting customer behavior and informing targeted business strategies. Desklib provides this document as a valuable resource for students seeking solved assignments and study materials.
BUS5CA Customer Analytics and Social Media
Assignment 2 – Customer Segmentation and Profiling
Table of Contents
Introduction:...............................................................................................................................1
Case Study task 1: Customer Segmentation on the basis of the demographic profile...........2
Case Study task 2: Customer segmentation on the basis of the behavioural data..................4
Case Study task 3: Cross cluster analysis – demographics to behavioural segments............6
Case Study task 4: Customer segmentation based on combined demographic and
behavioural data......................................................................................................................8
References..................................................................................................................................9
Appendix..................................................................................................................................10
Introduction:
The current project is aimed to analyse and create a targeting market model for the retail
sector. In other words, the main objective is to develop analytical skills in customer’s
Paraphrase This Document
Need a fresh take? Get an instant paraphrase of this document with our AI Paraphraser
analytics and categorise customers in different groups and segments based on their
purchasing behaviour (Chen, 2014). In the current time there is a lot of data generated each
day. This data can be used to make customized offers to the customers based on their
purchasing behaviour(Akbar & Parvez, 2009; Linof & Berry, 2011; Ziafat & Shakeri, 2014).
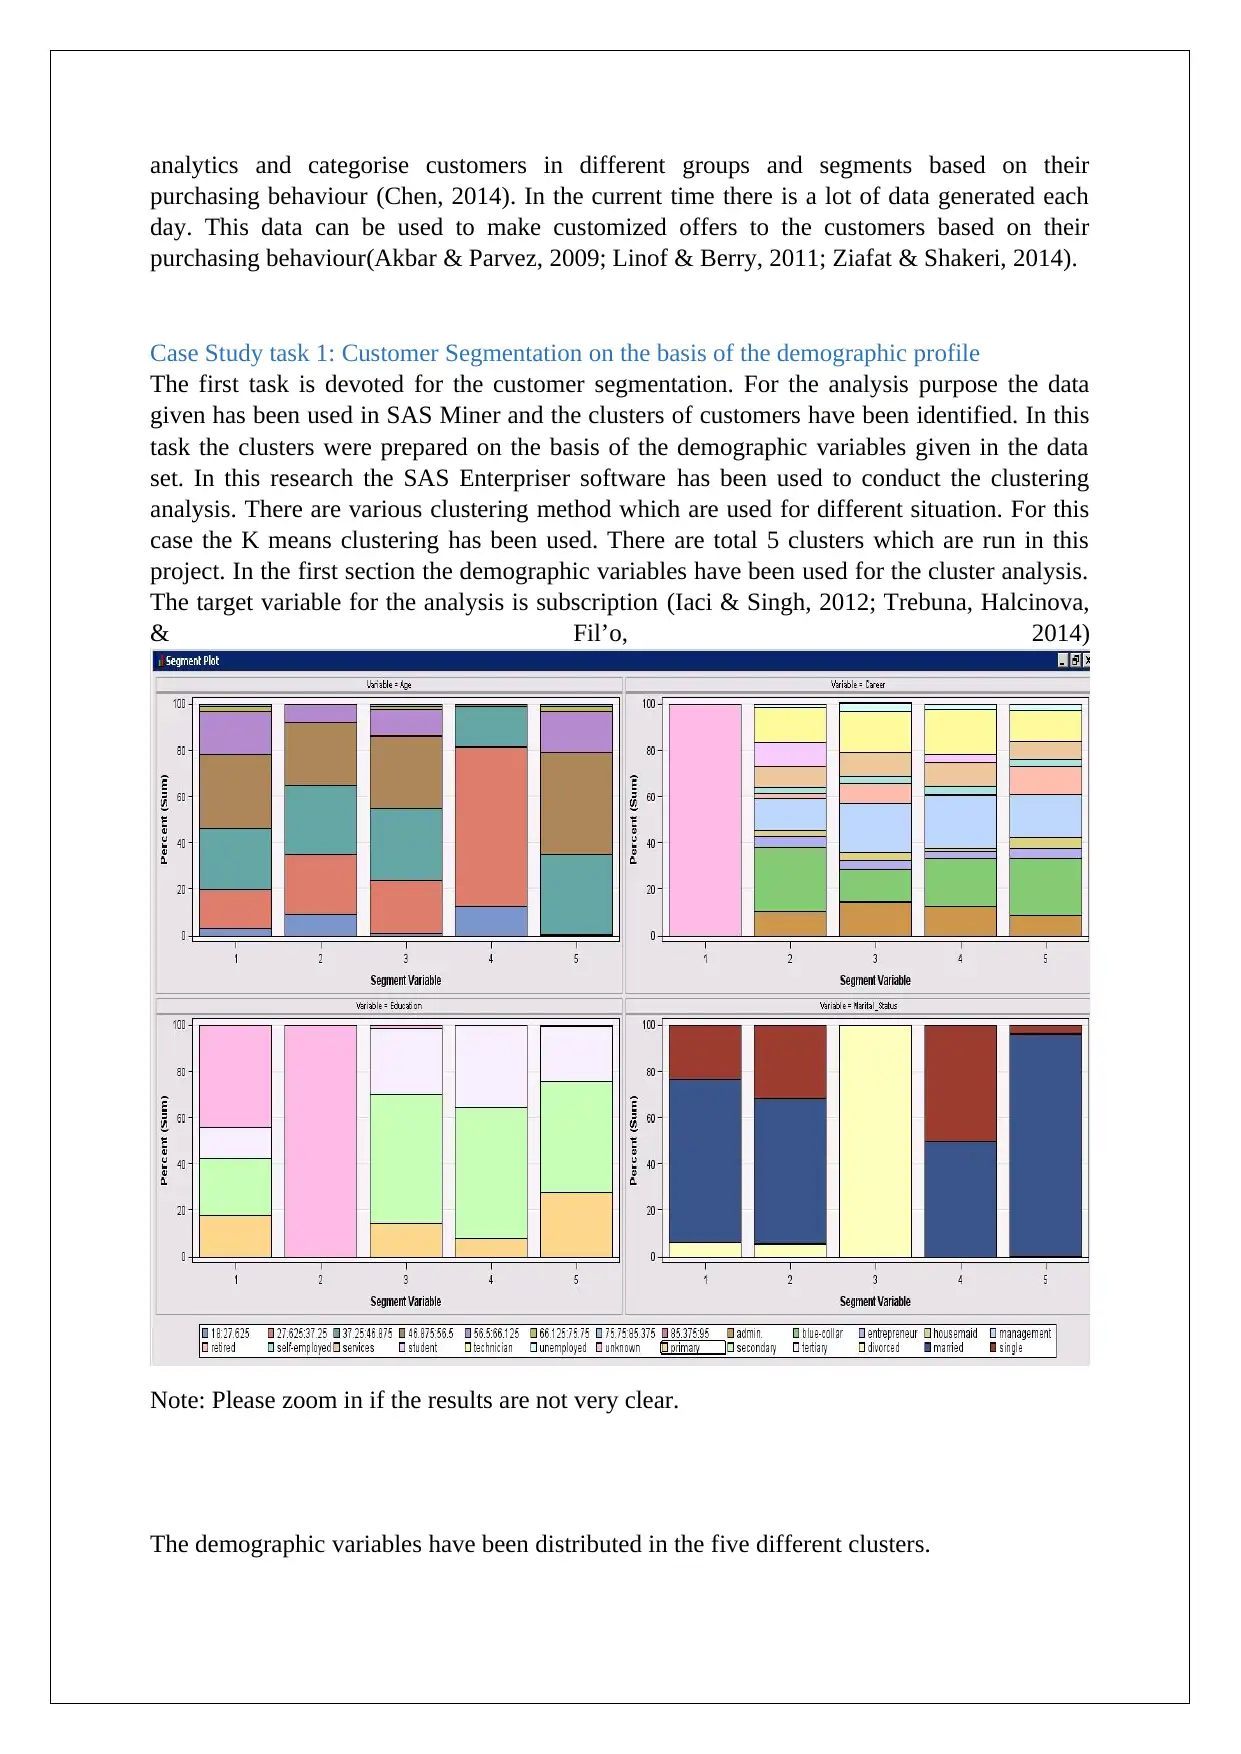
Case Study task 1: Customer Segmentation on the basis of the demographic profile
The first task is devoted for the customer segmentation. For the analysis purpose the data
given has been used in SAS Miner and the clusters of customers have been identified. In this
task the clusters were prepared on the basis of the demographic variables given in the data
set. In this research the SAS Enterpriser software has been used to conduct the clustering
analysis. There are various clustering method which are used for different situation. For this
case the K means clustering has been used. There are total 5 clusters which are run in this
project. In the first section the demographic variables have been used for the cluster analysis.
The target variable for the analysis is subscription (Iaci & Singh, 2012; Trebuna, Halcinova,
& Fil’o, 2014)
Note: Please zoom in if the results are not very clear.
The demographic variables have been distributed in the five different clusters.
purchasing behaviour (Chen, 2014). In the current time there is a lot of data generated each
day. This data can be used to make customized offers to the customers based on their
purchasing behaviour(Akbar & Parvez, 2009; Linof & Berry, 2011; Ziafat & Shakeri, 2014).
Case Study task 1: Customer Segmentation on the basis of the demographic profile
The first task is devoted for the customer segmentation. For the analysis purpose the data
given has been used in SAS Miner and the clusters of customers have been identified. In this
task the clusters were prepared on the basis of the demographic variables given in the data
set. In this research the SAS Enterpriser software has been used to conduct the clustering
analysis. There are various clustering method which are used for different situation. For this
case the K means clustering has been used. There are total 5 clusters which are run in this
project. In the first section the demographic variables have been used for the cluster analysis.
The target variable for the analysis is subscription (Iaci & Singh, 2012; Trebuna, Halcinova,
& Fil’o, 2014)
Note: Please zoom in if the results are not very clear.
The demographic variables have been distributed in the five different clusters.

First cluster: This cluster consists of the cluster on the basis of the age. This cluster comprises
the respondents who are students as profession. In this cluster respondents from the other
profession are not included as the cluster is only focused for the students. Respondents in this
cluster are married and the level of the education of the people are not known(Akguc & Akg,
2010; Alibeli, 2014).
Second cluster: Respondents in this cluster are not only of the particular age and the
profession of the respondents in this cluster also varies. The main differentiating point for this
cluster is that the people with specific education level are included in this segment which was
not the case in the previous cluster. In terms of the marital status most of the people are
married and it was not possible to map this segment with any particular segment of the Roy
Morgan.
Third Cluster: The cluster also consists of the people with different age and different
profession, however none of the variables in this cluster are statistically significant. One point
to notice in this segment is that most of the people have obtained the education level till
secondary. Another distinguished factor is of marital status as all the people in this segment
are divorced. As compare to the previous two segments, this cluster can be mapped as the
“Something better” from the Roy Morgan. This conclusion has been derived from the fact
that the people in this segment are divorced and educated. So it is expected that the people
wants something better in life and get out of the current situation.
Fourth Cluster: The fourth cluster also takes into consideration the age and the profession of
the people included in the data set. As compared to the other cluster, this cluster is more of
the young people as the people in this group are between the 27 and 37 years of age. So, this
is the cluster of the young people. In terms of the marital status people are either single or
married. In terms of the education level most of them have attained the secondary level of
education. While analysing the cluster, it can be said that this cluster is the “young optimism”
while mapping to the segments from the Roy Morgan. This is because are settled and want to
improve the standard of living.
Fifth Cluster: The fifth and the final cluster of this section is also the mix of the people in
different age with different education level and also different career options. In this section
most of the people are married, which means that they are settled in life. There is no divorced
people included in this cluster. However this segment could not be directly mapped to any
other section of the Roy Morgan.
With Outcome Variable:
In this section the clustering has been conducted using the outcome variable also in the
analysis. The graphical presentation of the clusters is shown in the figure below.
⊘ This is a preview!⊘
Do you want full access?
Subscribe today to unlock all pages.
Trusted by 1+ million students worldwide
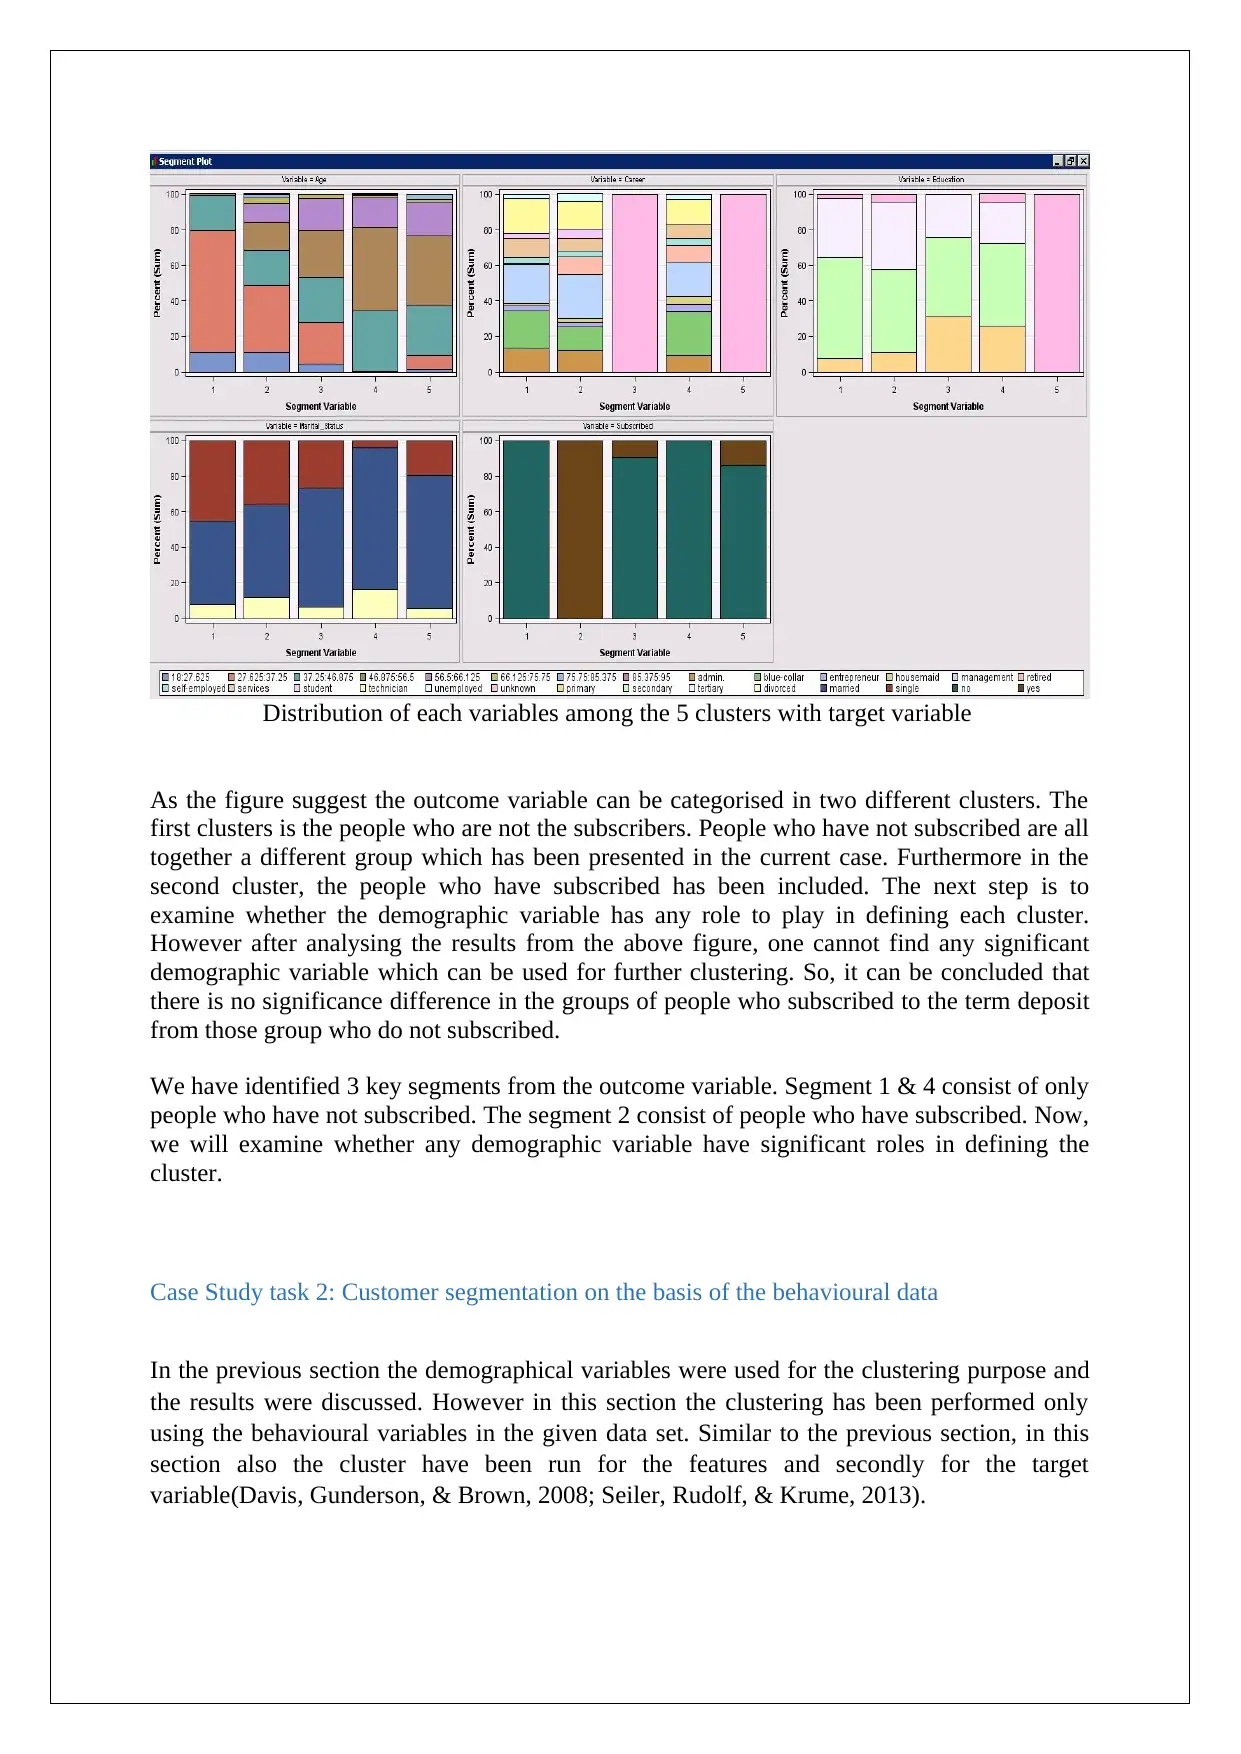
Distribution of each variables among the 5 clusters with target variable
As the figure suggest the outcome variable can be categorised in two different clusters. The
first clusters is the people who are not the subscribers. People who have not subscribed are all
together a different group which has been presented in the current case. Furthermore in the
second cluster, the people who have subscribed has been included. The next step is to
examine whether the demographic variable has any role to play in defining each cluster.
However after analysing the results from the above figure, one cannot find any significant
demographic variable which can be used for further clustering. So, it can be concluded that
there is no significance difference in the groups of people who subscribed to the term deposit
from those group who do not subscribed.
We have identified 3 key segments from the outcome variable. Segment 1 & 4 consist of only
people who have not subscribed. The segment 2 consist of people who have subscribed. Now,
we will examine whether any demographic variable have significant roles in defining the
cluster.
Case Study task 2: Customer segmentation on the basis of the behavioural data
In the previous section the demographical variables were used for the clustering purpose and
the results were discussed. However in this section the clustering has been performed only
using the behavioural variables in the given data set. Similar to the previous section, in this
section also the cluster have been run for the features and secondly for the target
variable(Davis, Gunderson, & Brown, 2008; Seiler, Rudolf, & Krume, 2013).
Paraphrase This Document
Need a fresh take? Get an instant paraphrase of this document with our AI Paraphraser
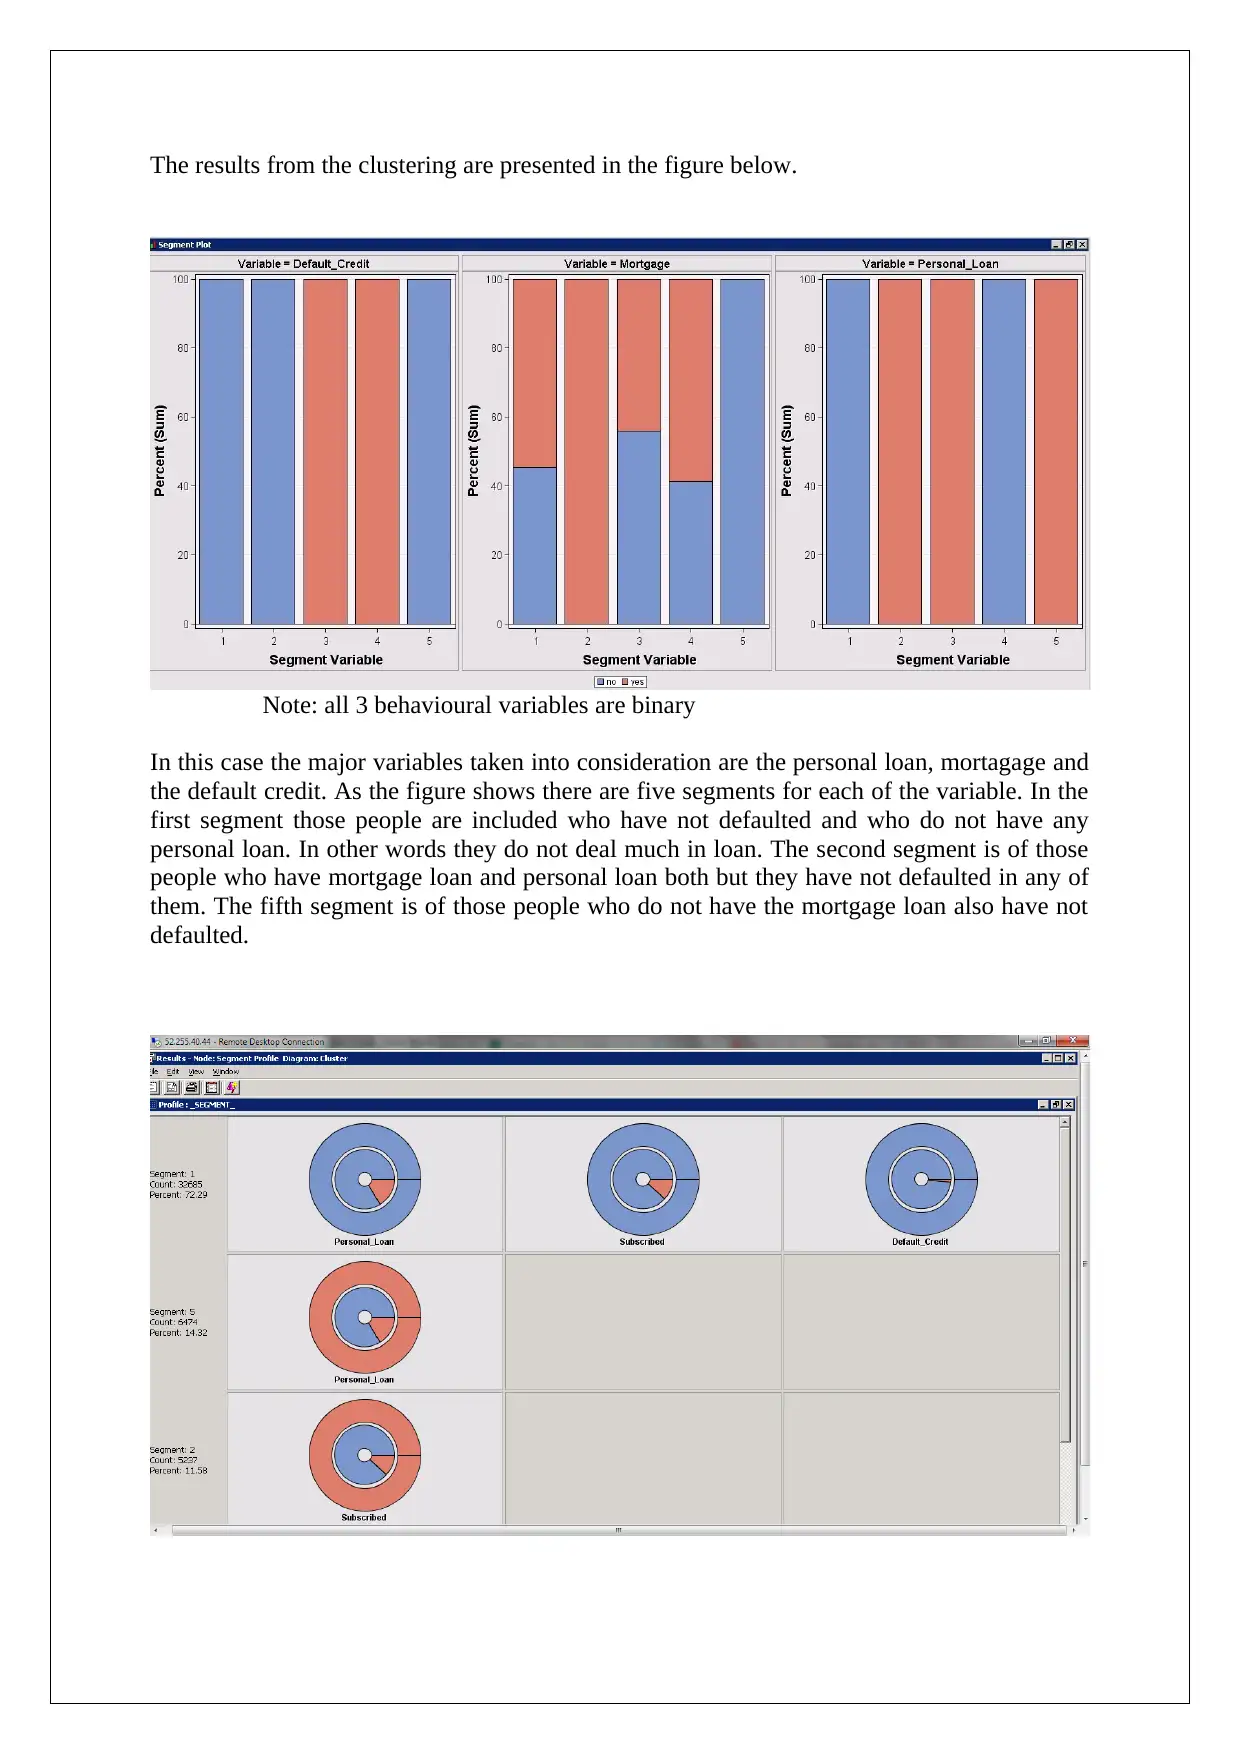
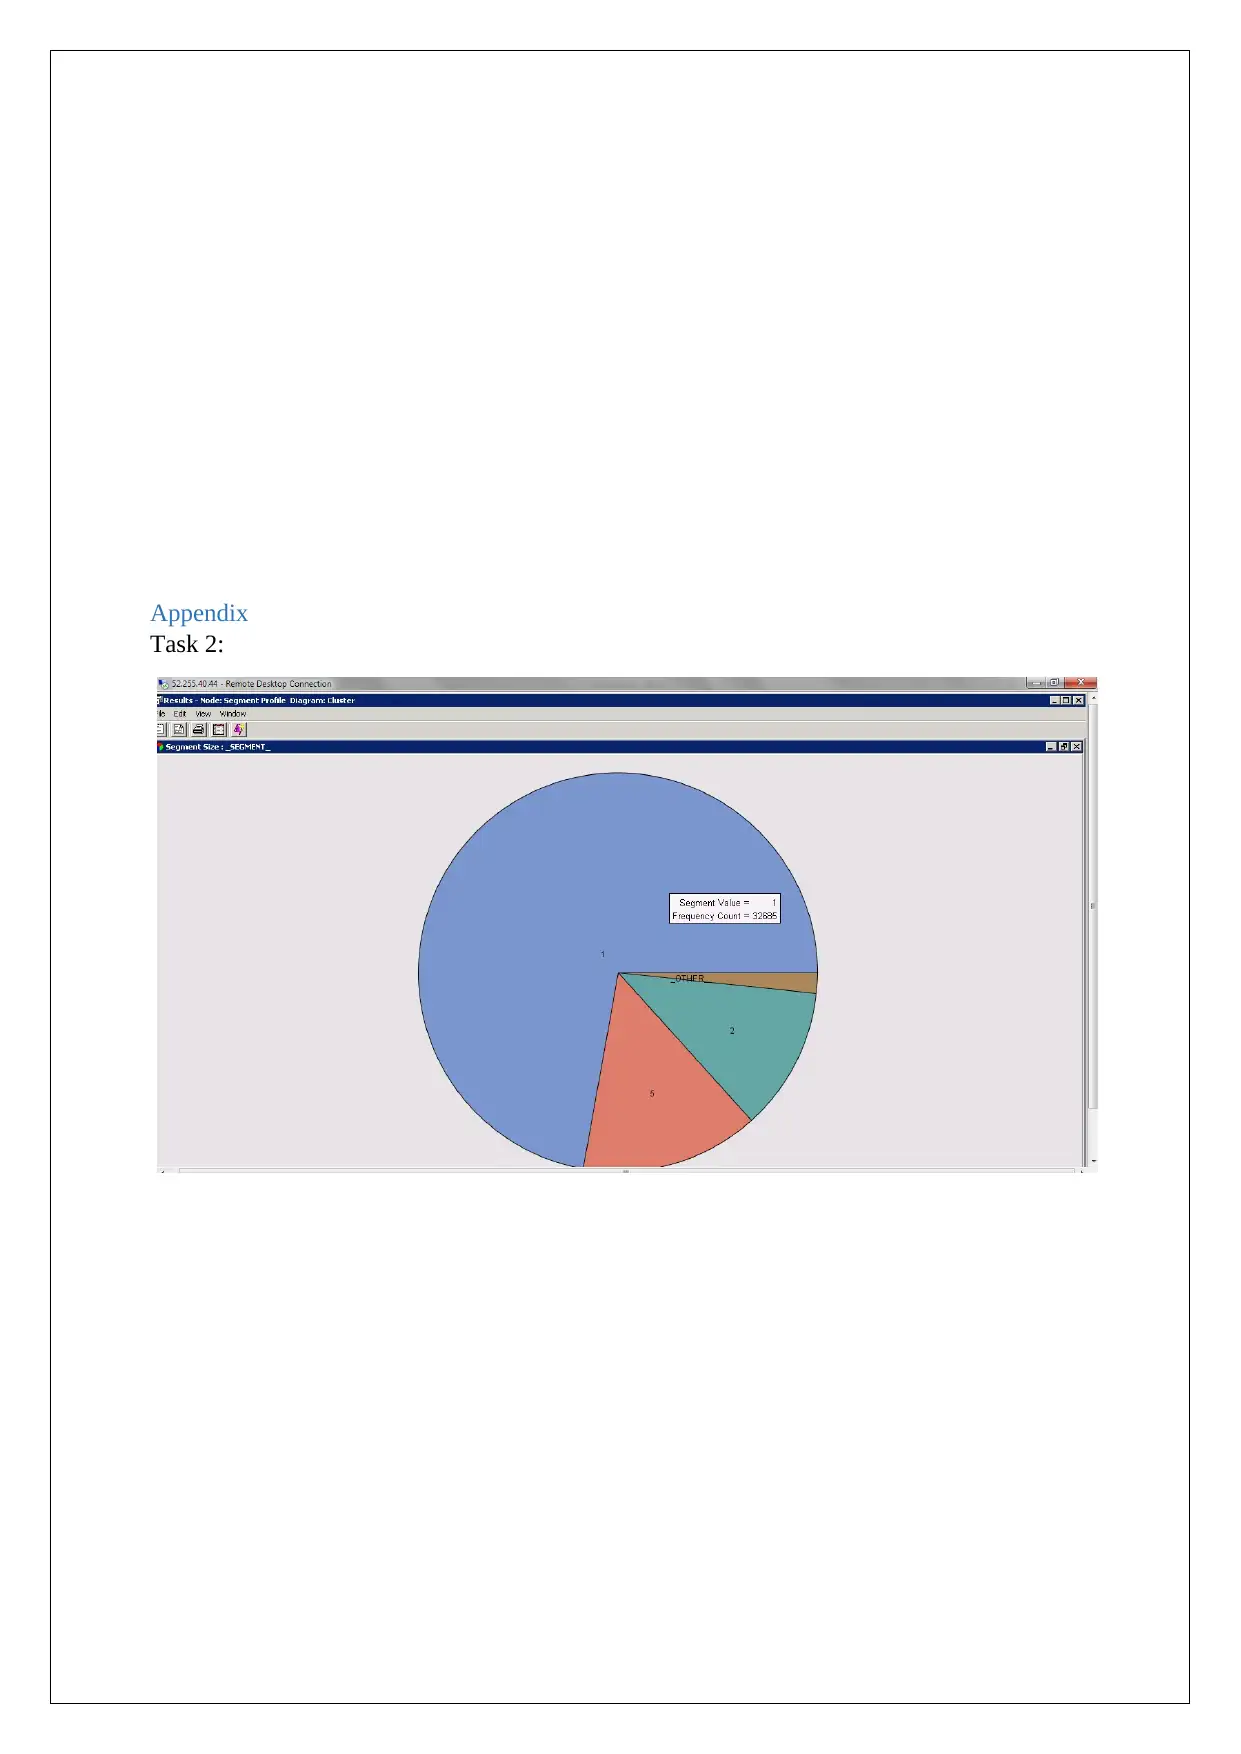
The results from the clustering are presented in the figure below.
Note: all 3 behavioural variables are binary
In this case the major variables taken into consideration are the personal loan, mortagage and
the default credit. As the figure shows there are five segments for each of the variable. In the
first segment those people are included who have not defaulted and who do not have any
personal loan. In other words they do not deal much in loan. The second segment is of those
people who have mortgage loan and personal loan both but they have not defaulted in any of
them. The fifth segment is of those people who do not have the mortgage loan also have not
defaulted.
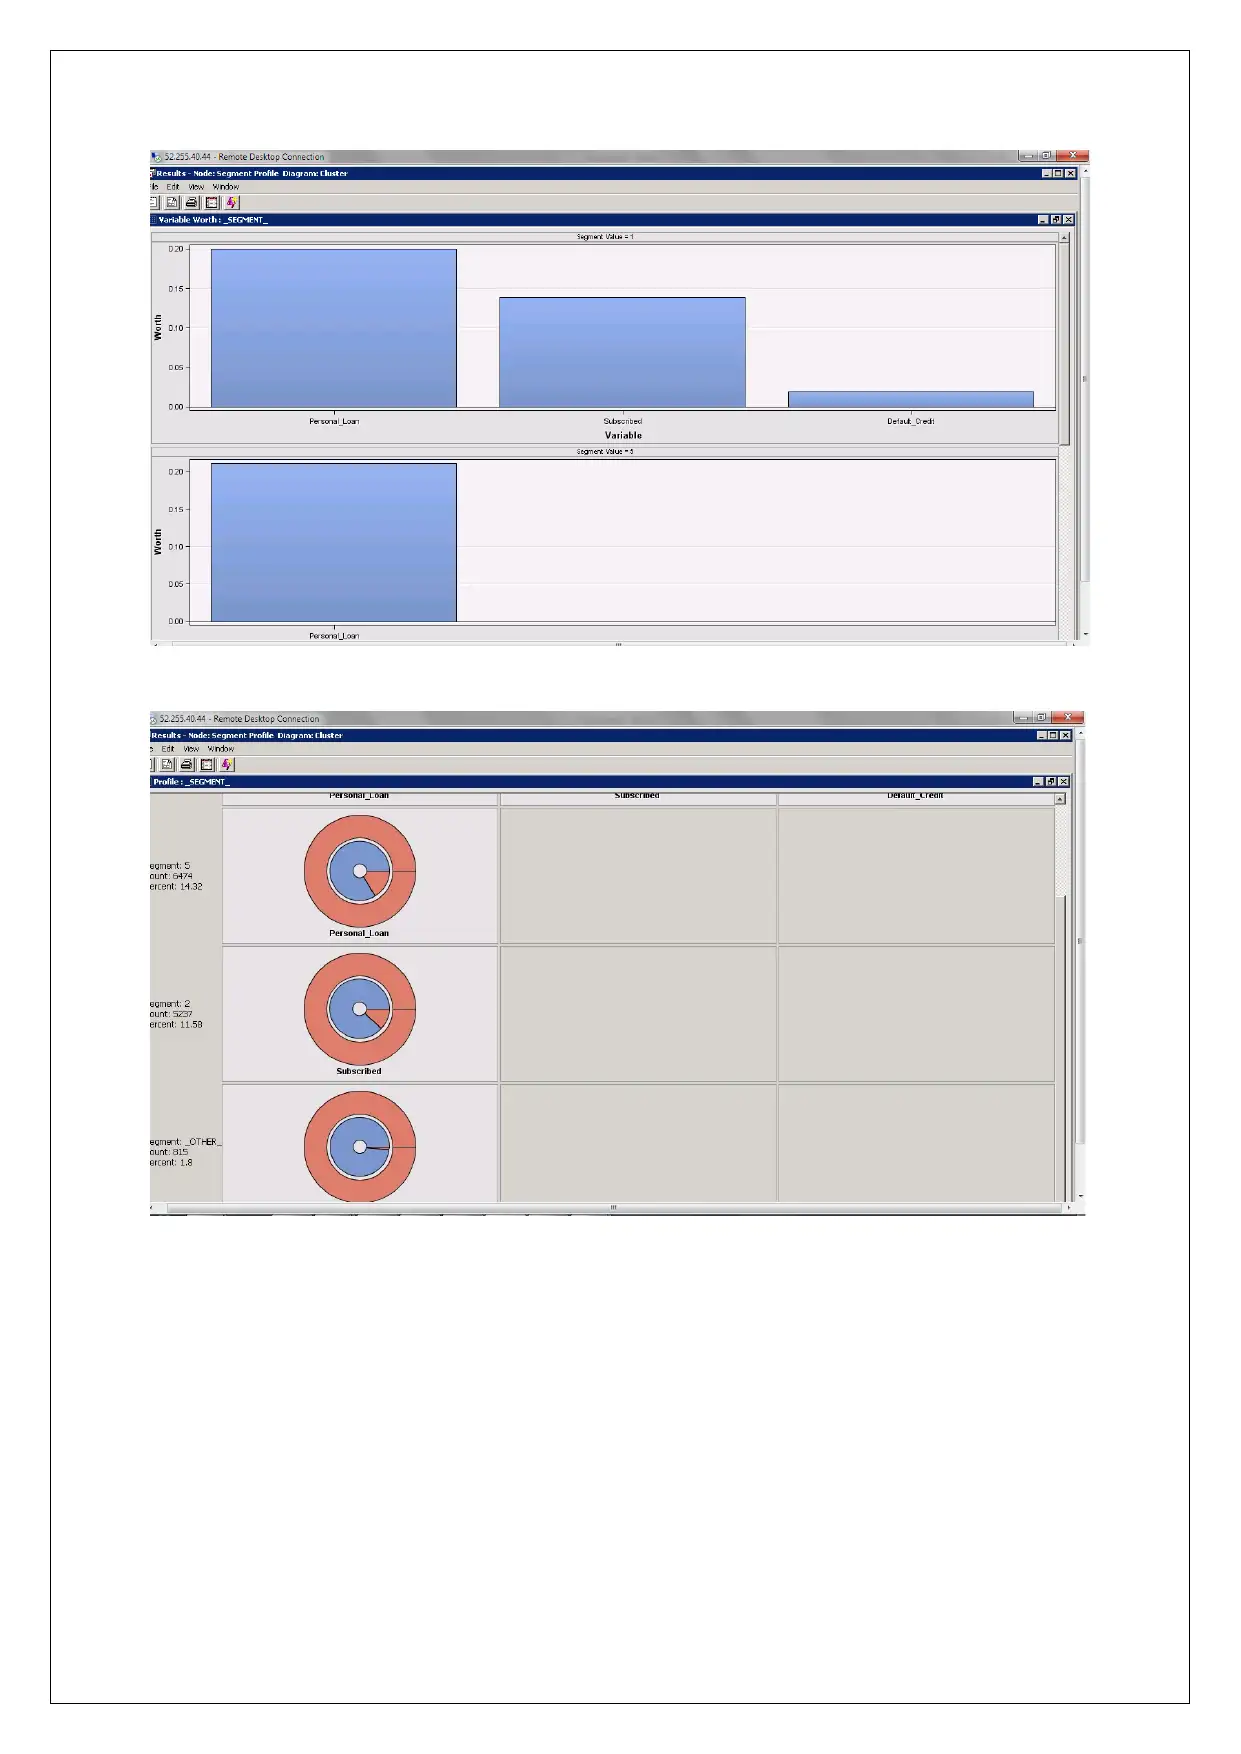
While the clustering is analysed for the response variable, one of the segment shows that this
cluster consists of the customers who have not subscribed. Also these people have not taken
any personal loan and also they have not defaulted. So it can be concluded that there is no
significant difference in the segment of customers subscribed to long term deposit from those
customers who did not subscribed to the long term deposit.
Case Study task 3: Cross cluster analysis – demographics to behavioural segments
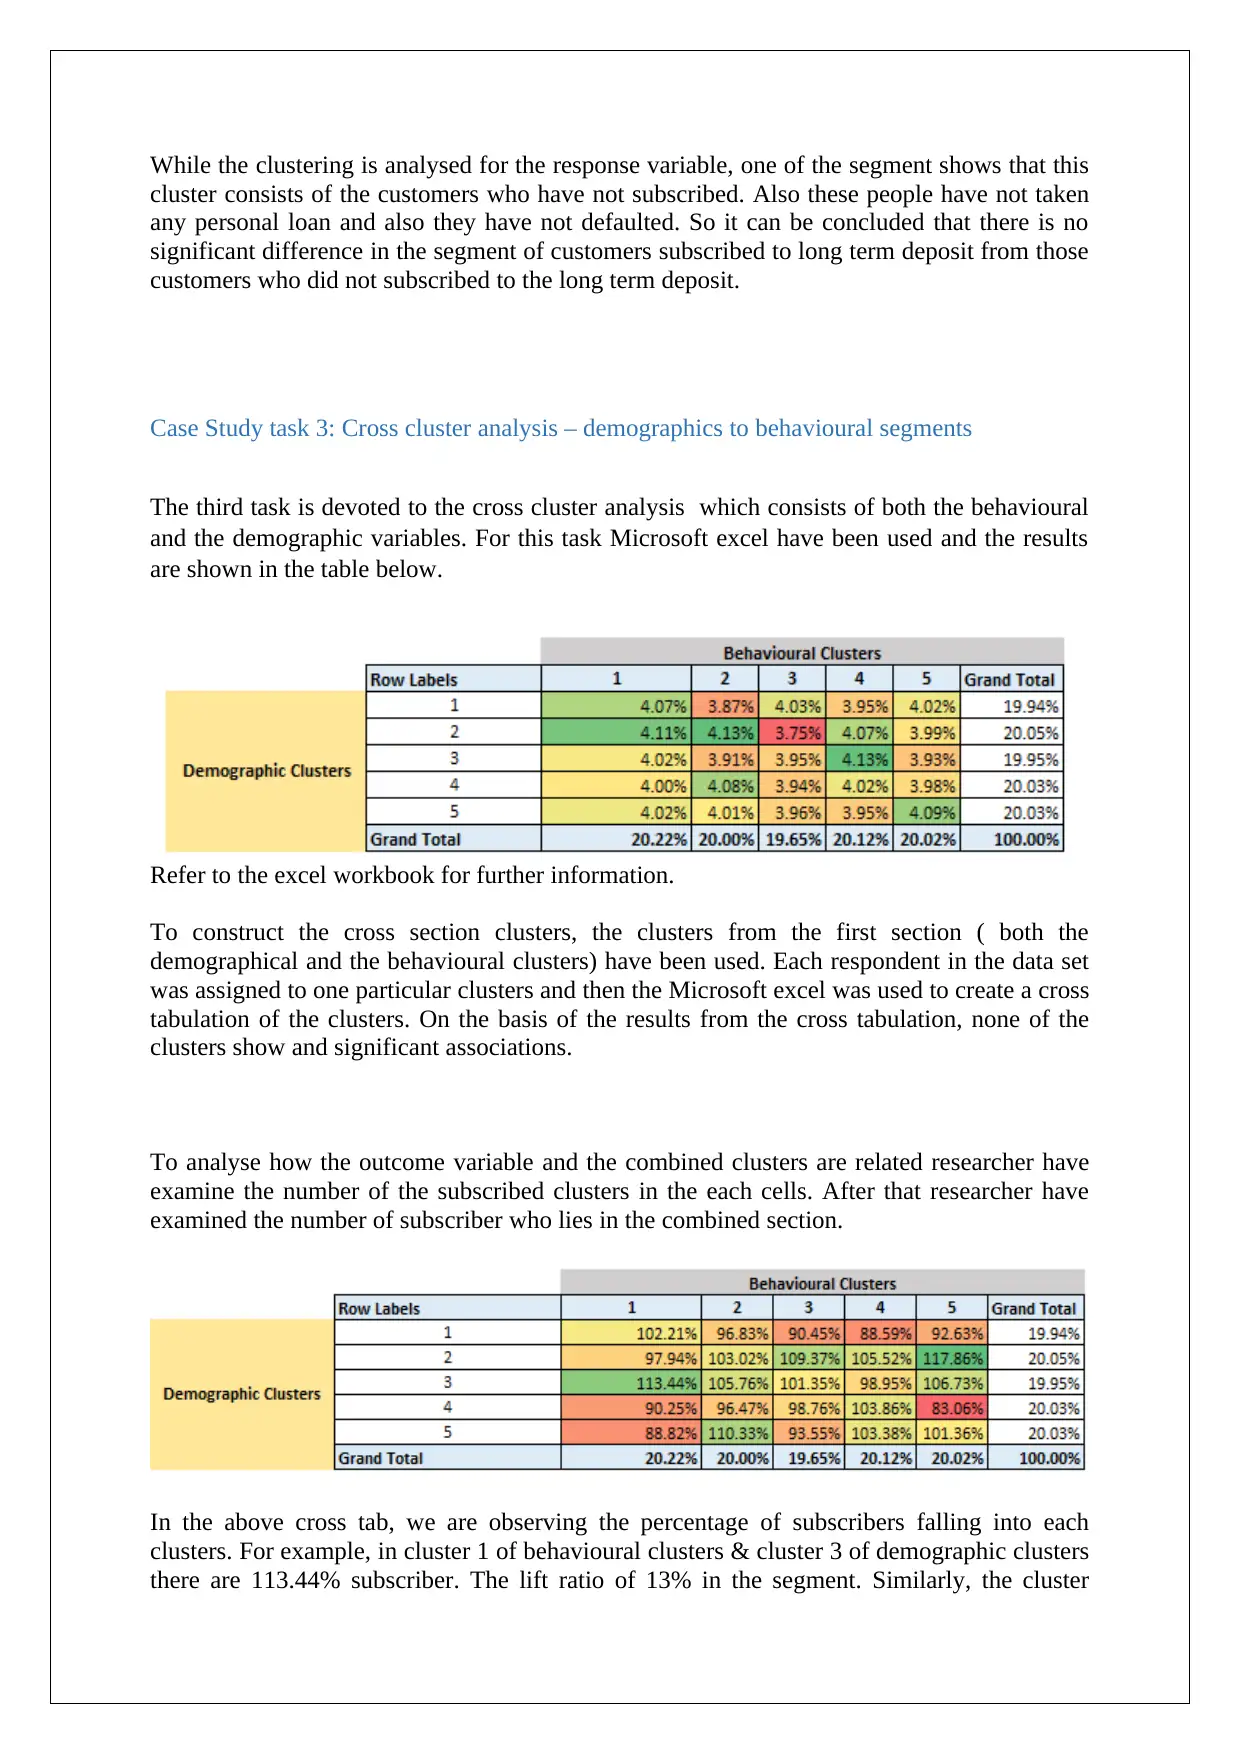
The third task is devoted to the cross cluster analysis which consists of both the behavioural
and the demographic variables. For this task Microsoft excel have been used and the results
are shown in the table below.
Refer to the excel workbook for further information.
To construct the cross section clusters, the clusters from the first section ( both the
demographical and the behavioural clusters) have been used. Each respondent in the data set
was assigned to one particular clusters and then the Microsoft excel was used to create a cross
tabulation of the clusters. On the basis of the results from the cross tabulation, none of the
clusters show and significant associations.
To analyse how the outcome variable and the combined clusters are related researcher have
examine the number of the subscribed clusters in the each cells. After that researcher have
examined the number of subscriber who lies in the combined section.
In the above cross tab, we are observing the percentage of subscribers falling into each
clusters. For example, in cluster 1 of behavioural clusters & cluster 3 of demographic clusters
there are 113.44% subscriber. The lift ratio of 13% in the segment. Similarly, the cluster
cluster consists of the customers who have not subscribed. Also these people have not taken
any personal loan and also they have not defaulted. So it can be concluded that there is no
significant difference in the segment of customers subscribed to long term deposit from those
customers who did not subscribed to the long term deposit.
Case Study task 3: Cross cluster analysis – demographics to behavioural segments
The third task is devoted to the cross cluster analysis which consists of both the behavioural
and the demographic variables. For this task Microsoft excel have been used and the results
are shown in the table below.
Refer to the excel workbook for further information.
To construct the cross section clusters, the clusters from the first section ( both the
demographical and the behavioural clusters) have been used. Each respondent in the data set
was assigned to one particular clusters and then the Microsoft excel was used to create a cross
tabulation of the clusters. On the basis of the results from the cross tabulation, none of the
clusters show and significant associations.
To analyse how the outcome variable and the combined clusters are related researcher have
examine the number of the subscribed clusters in the each cells. After that researcher have
examined the number of subscriber who lies in the combined section.
In the above cross tab, we are observing the percentage of subscribers falling into each
clusters. For example, in cluster 1 of behavioural clusters & cluster 3 of demographic clusters
there are 113.44% subscriber. The lift ratio of 13% in the segment. Similarly, the cluster
⊘ This is a preview!⊘
Do you want full access?
Subscribe today to unlock all pages.
Trusted by 1+ million students worldwide
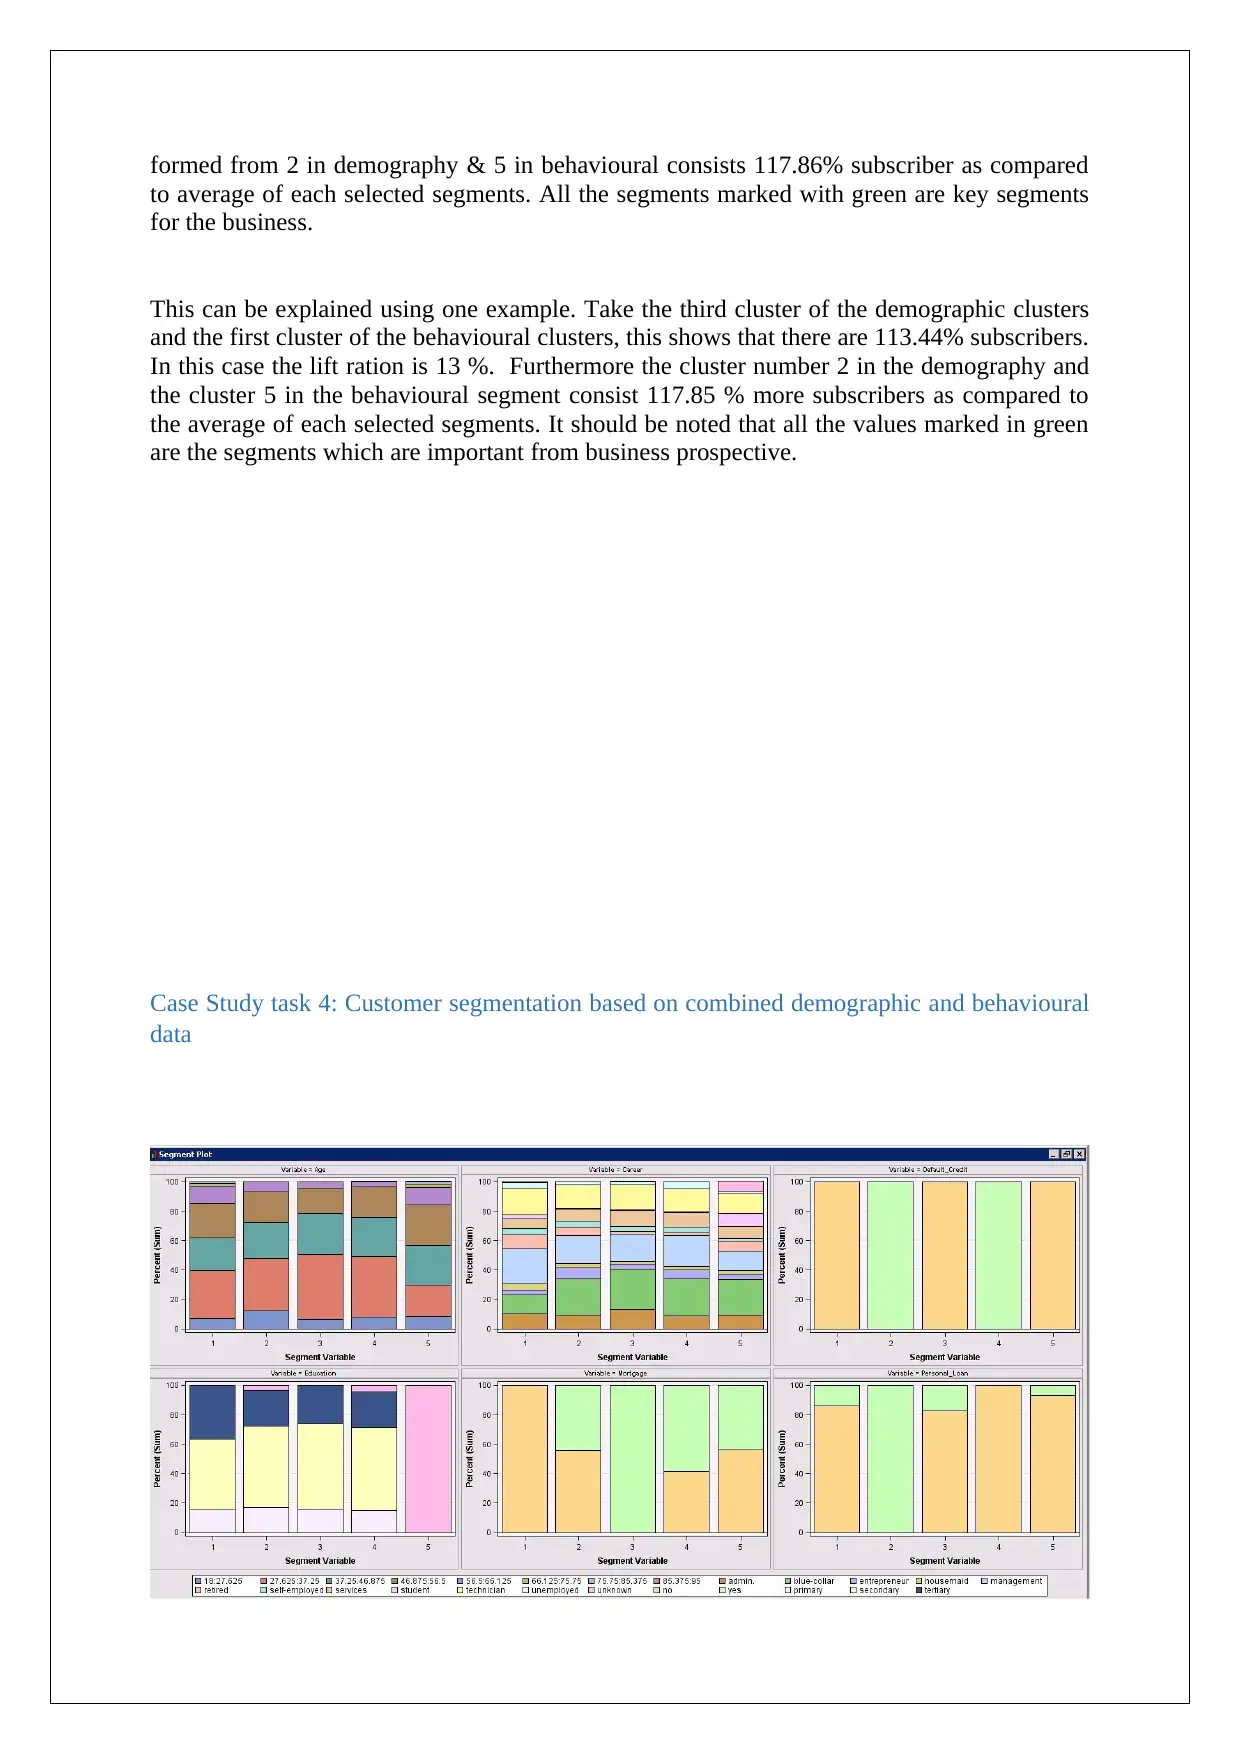
formed from 2 in demography & 5 in behavioural consists 117.86% subscriber as compared
to average of each selected segments. All the segments marked with green are key segments
for the business.
This can be explained using one example. Take the third cluster of the demographic clusters
and the first cluster of the behavioural clusters, this shows that there are 113.44% subscribers.
In this case the lift ration is 13 %. Furthermore the cluster number 2 in the demography and
the cluster 5 in the behavioural segment consist 117.85 % more subscribers as compared to
the average of each selected segments. It should be noted that all the values marked in green
are the segments which are important from business prospective.
Case Study task 4: Customer segmentation based on combined demographic and behavioural
data
Paraphrase This Document
Need a fresh take? Get an instant paraphrase of this document with our AI Paraphraser
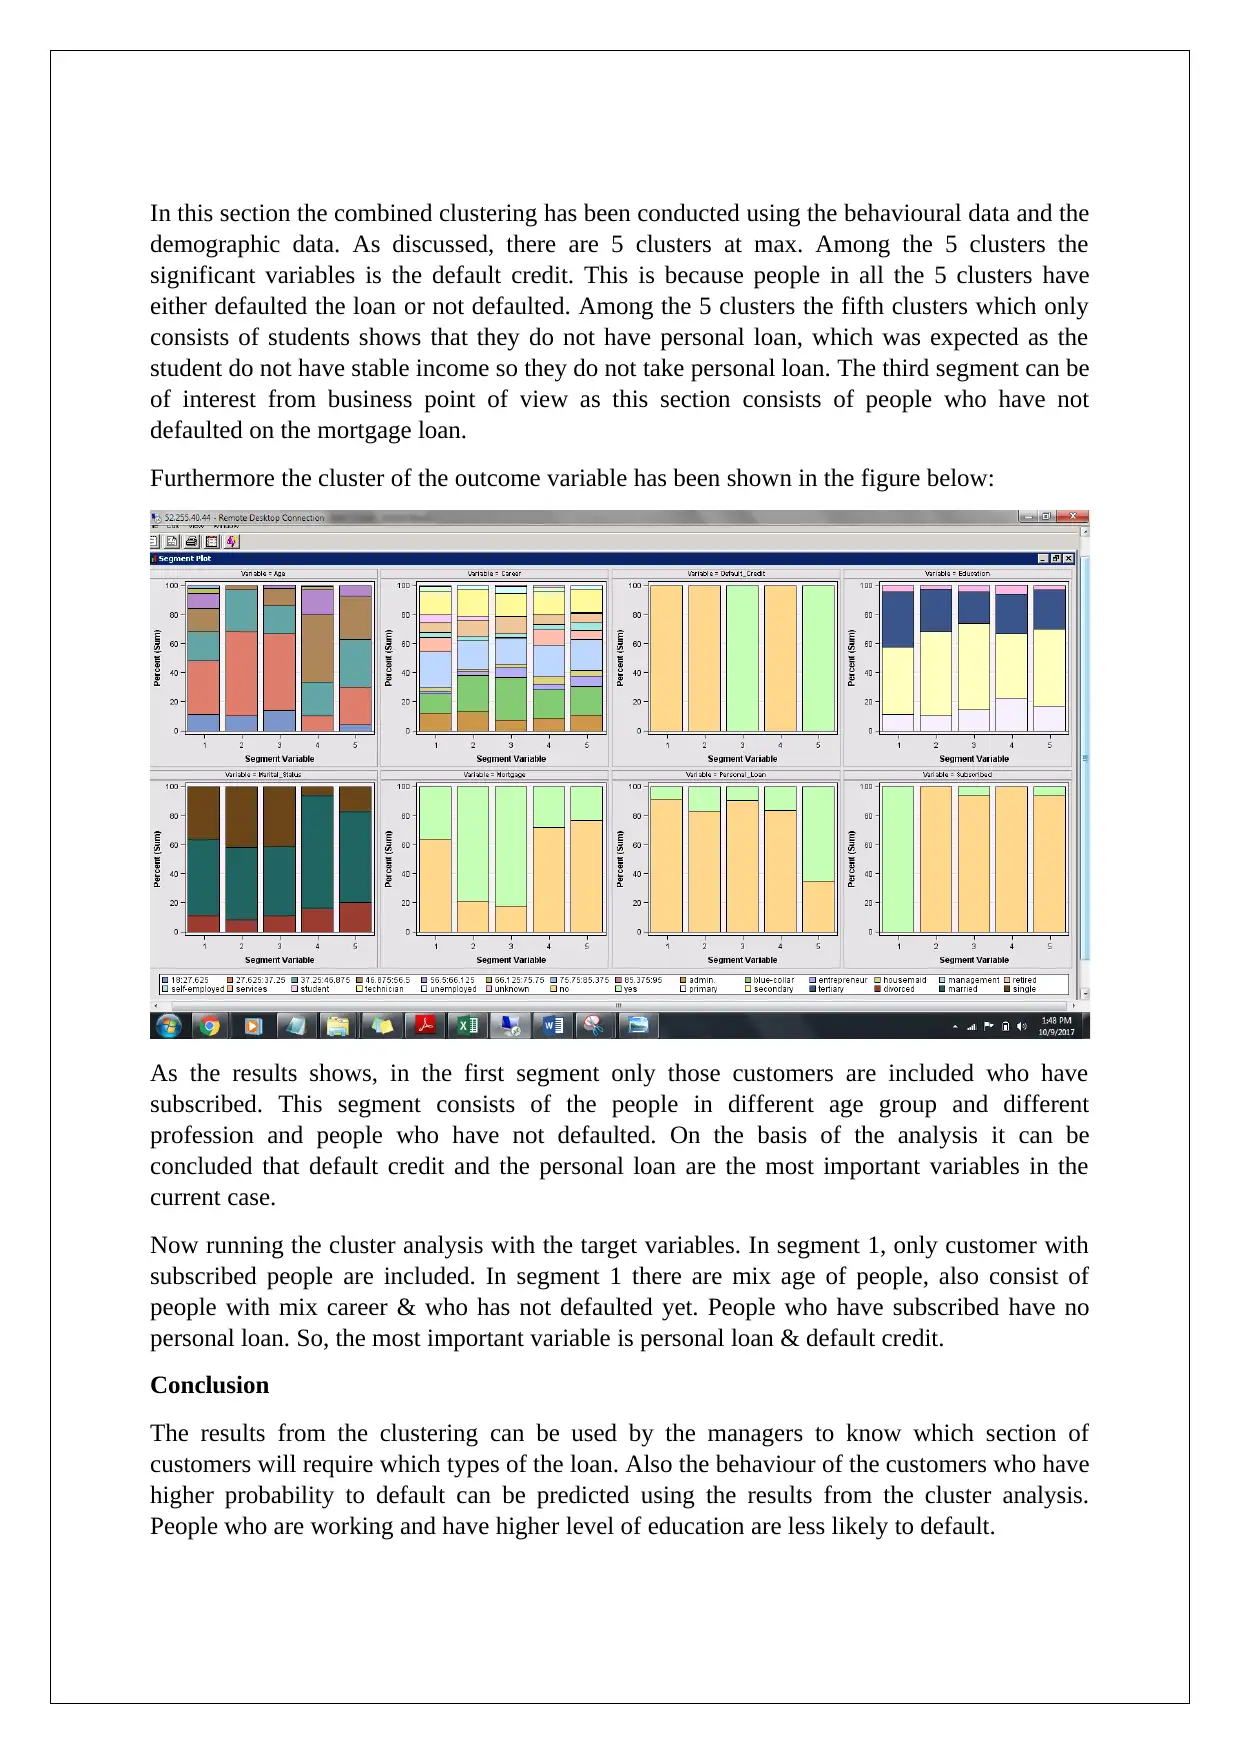
In this section the combined clustering has been conducted using the behavioural data and the
demographic data. As discussed, there are 5 clusters at max. Among the 5 clusters the
significant variables is the default credit. This is because people in all the 5 clusters have
either defaulted the loan or not defaulted. Among the 5 clusters the fifth clusters which only
consists of students shows that they do not have personal loan, which was expected as the
student do not have stable income so they do not take personal loan. The third segment can be
of interest from business point of view as this section consists of people who have not
defaulted on the mortgage loan.
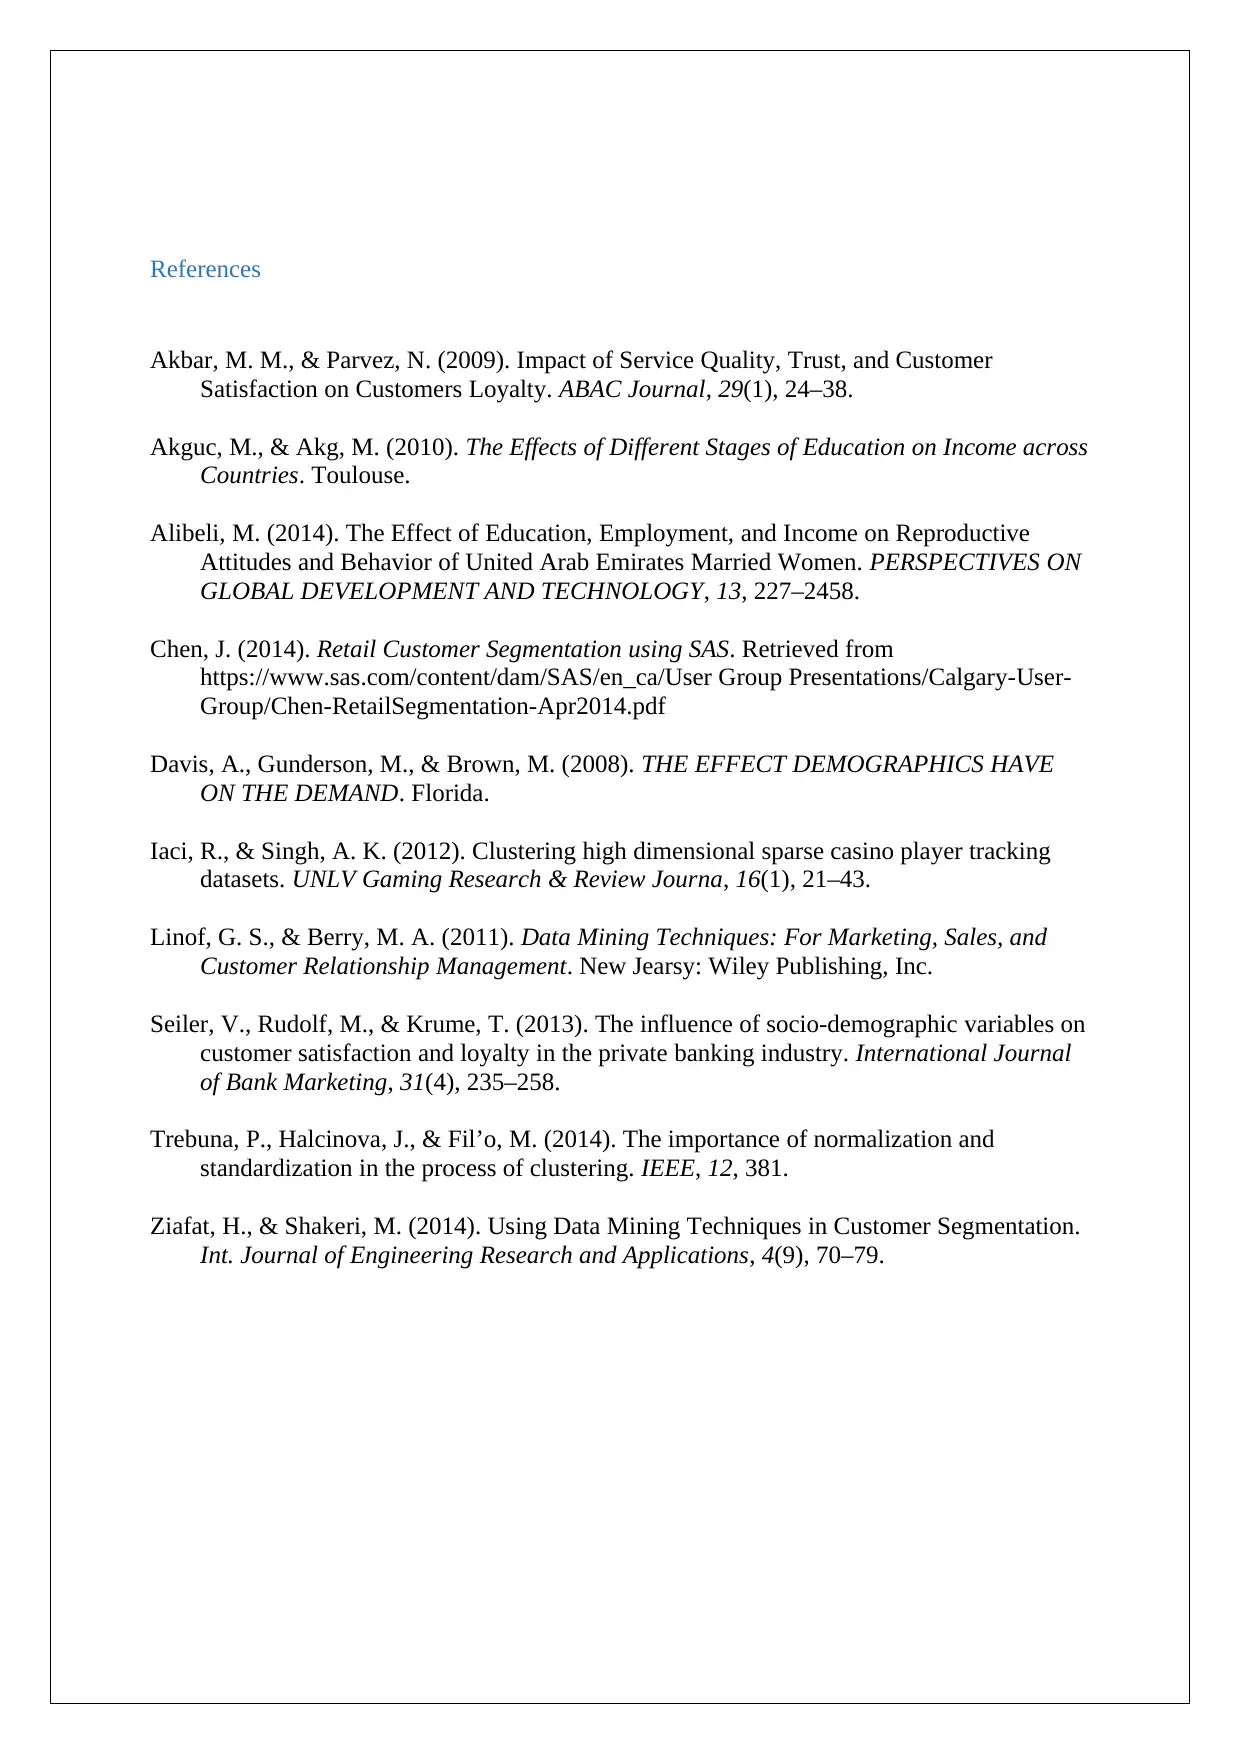
Furthermore the cluster of the outcome variable has been shown in the figure below:
As the results shows, in the first segment only those customers are included who have
subscribed. This segment consists of the people in different age group and different
profession and people who have not defaulted. On the basis of the analysis it can be
concluded that default credit and the personal loan are the most important variables in the
current case.
Now running the cluster analysis with the target variables. In segment 1, only customer with
subscribed people are included. In segment 1 there are mix age of people, also consist of
people with mix career & who has not defaulted yet. People who have subscribed have no
personal loan. So, the most important variable is personal loan & default credit.
Conclusion
The results from the clustering can be used by the managers to know which section of
customers will require which types of the loan. Also the behaviour of the customers who have
higher probability to default can be predicted using the results from the cluster analysis.
People who are working and have higher level of education are less likely to default.
demographic data. As discussed, there are 5 clusters at max. Among the 5 clusters the
significant variables is the default credit. This is because people in all the 5 clusters have
either defaulted the loan or not defaulted. Among the 5 clusters the fifth clusters which only
consists of students shows that they do not have personal loan, which was expected as the
student do not have stable income so they do not take personal loan. The third segment can be
of interest from business point of view as this section consists of people who have not
defaulted on the mortgage loan.
Furthermore the cluster of the outcome variable has been shown in the figure below:
As the results shows, in the first segment only those customers are included who have
subscribed. This segment consists of the people in different age group and different
profession and people who have not defaulted. On the basis of the analysis it can be
concluded that default credit and the personal loan are the most important variables in the
current case.
Now running the cluster analysis with the target variables. In segment 1, only customer with
subscribed people are included. In segment 1 there are mix age of people, also consist of
people with mix career & who has not defaulted yet. People who have subscribed have no
personal loan. So, the most important variable is personal loan & default credit.
Conclusion
The results from the clustering can be used by the managers to know which section of
customers will require which types of the loan. Also the behaviour of the customers who have
higher probability to default can be predicted using the results from the cluster analysis.
People who are working and have higher level of education are less likely to default.
References
Akbar, M. M., & Parvez, N. (2009). Impact of Service Quality, Trust, and Customer
Satisfaction on Customers Loyalty. ABAC Journal, 29(1), 24–38.
Akguc, M., & Akg, M. (2010). The Effects of Different Stages of Education on Income across
Countries. Toulouse.
Alibeli, M. (2014). The Effect of Education, Employment, and Income on Reproductive
Attitudes and Behavior of United Arab Emirates Married Women. PERSPECTIVES ON
GLOBAL DEVELOPMENT AND TECHNOLOGY, 13, 227–2458.
Chen, J. (2014). Retail Customer Segmentation using SAS. Retrieved from
https://www.sas.com/content/dam/SAS/en_ca/User Group Presentations/Calgary-User-
Group/Chen-RetailSegmentation-Apr2014.pdf
Davis, A., Gunderson, M., & Brown, M. (2008). THE EFFECT DEMOGRAPHICS HAVE
ON THE DEMAND. Florida.
Iaci, R., & Singh, A. K. (2012). Clustering high dimensional sparse casino player tracking
datasets. UNLV Gaming Research & Review Journa, 16(1), 21–43.
Linof, G. S., & Berry, M. A. (2011). Data Mining Techniques: For Marketing, Sales, and
Customer Relationship Management. New Jearsy: Wiley Publishing, Inc.
Seiler, V., Rudolf, M., & Krume, T. (2013). The influence of socio‐demographic variables on
customer satisfaction and loyalty in the private banking industry. International Journal
of Bank Marketing, 31(4), 235–258.
Trebuna, P., Halcinova, J., & Fil’o, M. (2014). The importance of normalization and
standardization in the process of clustering. IEEE, 12, 381.
Ziafat, H., & Shakeri, M. (2014). Using Data Mining Techniques in Customer Segmentation.
Int. Journal of Engineering Research and Applications, 4(9), 70–79.
⊘ This is a preview!⊘
Do you want full access?
Subscribe today to unlock all pages.
Trusted by 1+ million students worldwide
Appendix
Task 2:
Task 2:
Paraphrase This Document
Need a fresh take? Get an instant paraphrase of this document with our AI Paraphraser
1 out of 11
Related Documents


Your All-in-One AI-Powered Toolkit for Academic Success.
+13062052269
info@desklib.com
Available 24*7 on WhatsApp / Email
![[object Object]](/_next/static/media/star-bottom.7253800d.svg)
Unlock your academic potential
Copyright © 2020–2026 A2Z Services. All Rights Reserved. Developed and managed by ZUCOL.