BUS 700 Economics - Australia's Economic Growth: A 25-Year Analysis
VerifiedAdded on 2024/06/03
|15
|3451
|219
Report
AI Summary
This report provides an executive summary and detailed analysis of the Australian economy over the past 25 years, with a comparative study to the United States. It examines key macroeconomic factors such as real GDP growth rate, inflation rate, unemployment rate, net exports, real exchange rate, and cash rate, comparing them with the Federal Reserve Fund Rate of the U.S. The report discusses the relationships between these factors and presents predictions for the future of Australia's economy, concluding with recommendations based on the analysis. It uses historical data to explain Australia's economic success and provides insights into the dynamics of its mixed economy.

BUS 700 ECONOMICS
1
1
Paraphrase This Document
Need a fresh take? Get an instant paraphrase of this document with our AI Paraphraser
Executive Summary
Studying the data of Australian Economy and analysing it with a comparison to the United States
should be the core of this project. While analysing the data one should understand the system of
economy prevailing in Australia and the extent to which it varies from that of United States
should be clear. The data on the key economic factors for Australia would provide a clear
analysis of the last 25 years and how Australia has grown out to be among the top five developed
countries would emerge up. The report has presented the detailed analysis of the future
prediction related to GDP so that economic performance could be identified more easily
2
Table of Contents
1.0: Introduction..............................................................................................................................4
2.0: Finding and Analysis................................................................................................................5
2.1: Obtaining Data on Key Macroeconomic Factors Concerning Australia..................................5
2.2: Discussion on the Relationship of Australia’s Real GDP growth Rate and Inflation Rate
along with the relationship of unemployment rate and real GDP growth rate................................6
2.3: Discussing the relationship between the Net Exports and Real Exchange Rate of Australia
and U.S.A.........................................................................................................................................8
2.4: Discussing and presenting the relationship between the cash Rate of Australia and Federal
Reserve Fund Rate of U.S.A..........................................................................................................10
2.5: Presentation of the detailed discussing on the prediction for Future of Australia’s Economy
.......................................................................................................................................................11
3.0: Recommendation....................................................................................................................12
4.0 Conclusion...............................................................................................................................13
References:....................................................................................................................................14
3
⊘ This is a preview!⊘
Do you want full access?
Subscribe today to unlock all pages.
Trusted by 1+ million students worldwide
1.0: Introduction
Australia is a mixed economy with higher GDP growth rate and lower poverty line, has
prospered in the recent years. Being rich and wealthy in natural resources, Australia has used its
strength to its fullest and has reached in the list of the top five developed countries in the world.
Obtaining its historical data and analysing the same would help in knowing the exact reason for
its success. This would help in getting a clear view and concept of the economics as a whole.
4
Paraphrase This Document
Need a fresh take? Get an instant paraphrase of this document with our AI Paraphraser
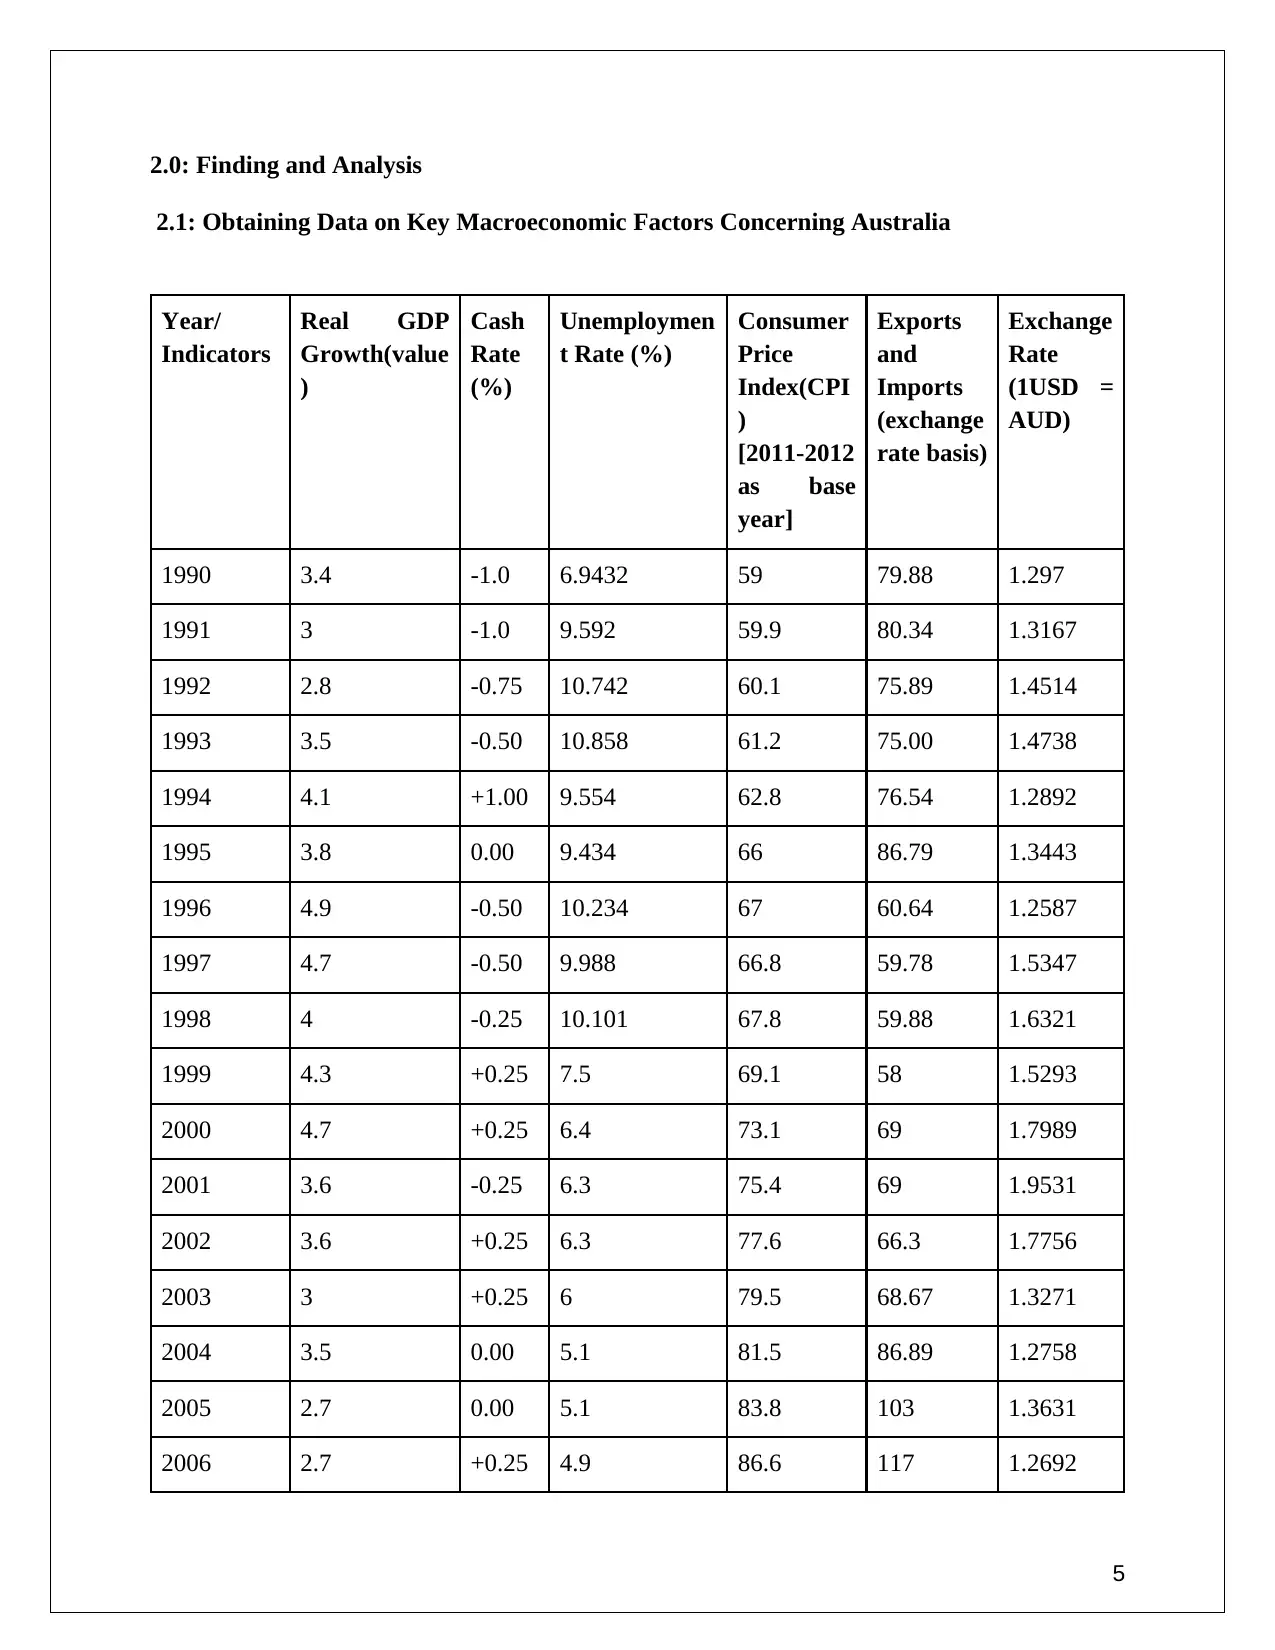
2.0: Finding and Analysis
2.1: Obtaining Data on Key Macroeconomic Factors Concerning Australia
Year/
Indicators
Real GDP
Growth(value
)
Cash
Rate
(%)
Unemploymen
t Rate (%)
Consumer
Price
Index(CPI
)
[2011-2012
as base
year]
Exports
and
Imports
(exchange
rate basis)
Exchange
Rate
(1USD =
AUD)
1990 3.4 -1.0 6.9432 59 79.88 1.297
1991 3 -1.0 9.592 59.9 80.34 1.3167
1992 2.8 -0.75 10.742 60.1 75.89 1.4514
1993 3.5 -0.50 10.858 61.2 75.00 1.4738
1994 4.1 +1.00 9.554 62.8 76.54 1.2892
1995 3.8 0.00 9.434 66 86.79 1.3443
1996 4.9 -0.50 10.234 67 60.64 1.2587
1997 4.7 -0.50 9.988 66.8 59.78 1.5347
1998 4 -0.25 10.101 67.8 59.88 1.6321
1999 4.3 +0.25 7.5 69.1 58 1.5293
2000 4.7 +0.25 6.4 73.1 69 1.7989
2001 3.6 -0.25 6.3 75.4 69 1.9531
2002 3.6 +0.25 6.3 77.6 66.3 1.7756
2003 3 +0.25 6 79.5 68.67 1.3271
2004 3.5 0.00 5.1 81.5 86.89 1.2758
2005 2.7 0.00 5.1 83.8 103 1.3631
2006 2.7 +0.25 4.9 86.6 117 1.2692
5
2007 54.18 +0.25 -8.87 89.1 142.1 1.139
2008 -37.53 -1.00 -2.68 92.4 190.2 1.4333
2009 -31.41 -0.25 31.18 94.3 154.8 1.1121
2010 28.70 +0.25 -6.58 96.9 210.7 0.9755
2011 15.61 -0.25 -2.40 99.8 272.1 0.9828
2012 41.74 -0.25 2.79 102.0 258.8 0.9643
2013 -44.49 -0.25 8.29 104.8 251.7 1.1183
2014 21 0.00 7.23 106.6 184.3 1.2185
2015 -5.50 0.00 -0.15 108.4 224.5 1.3674
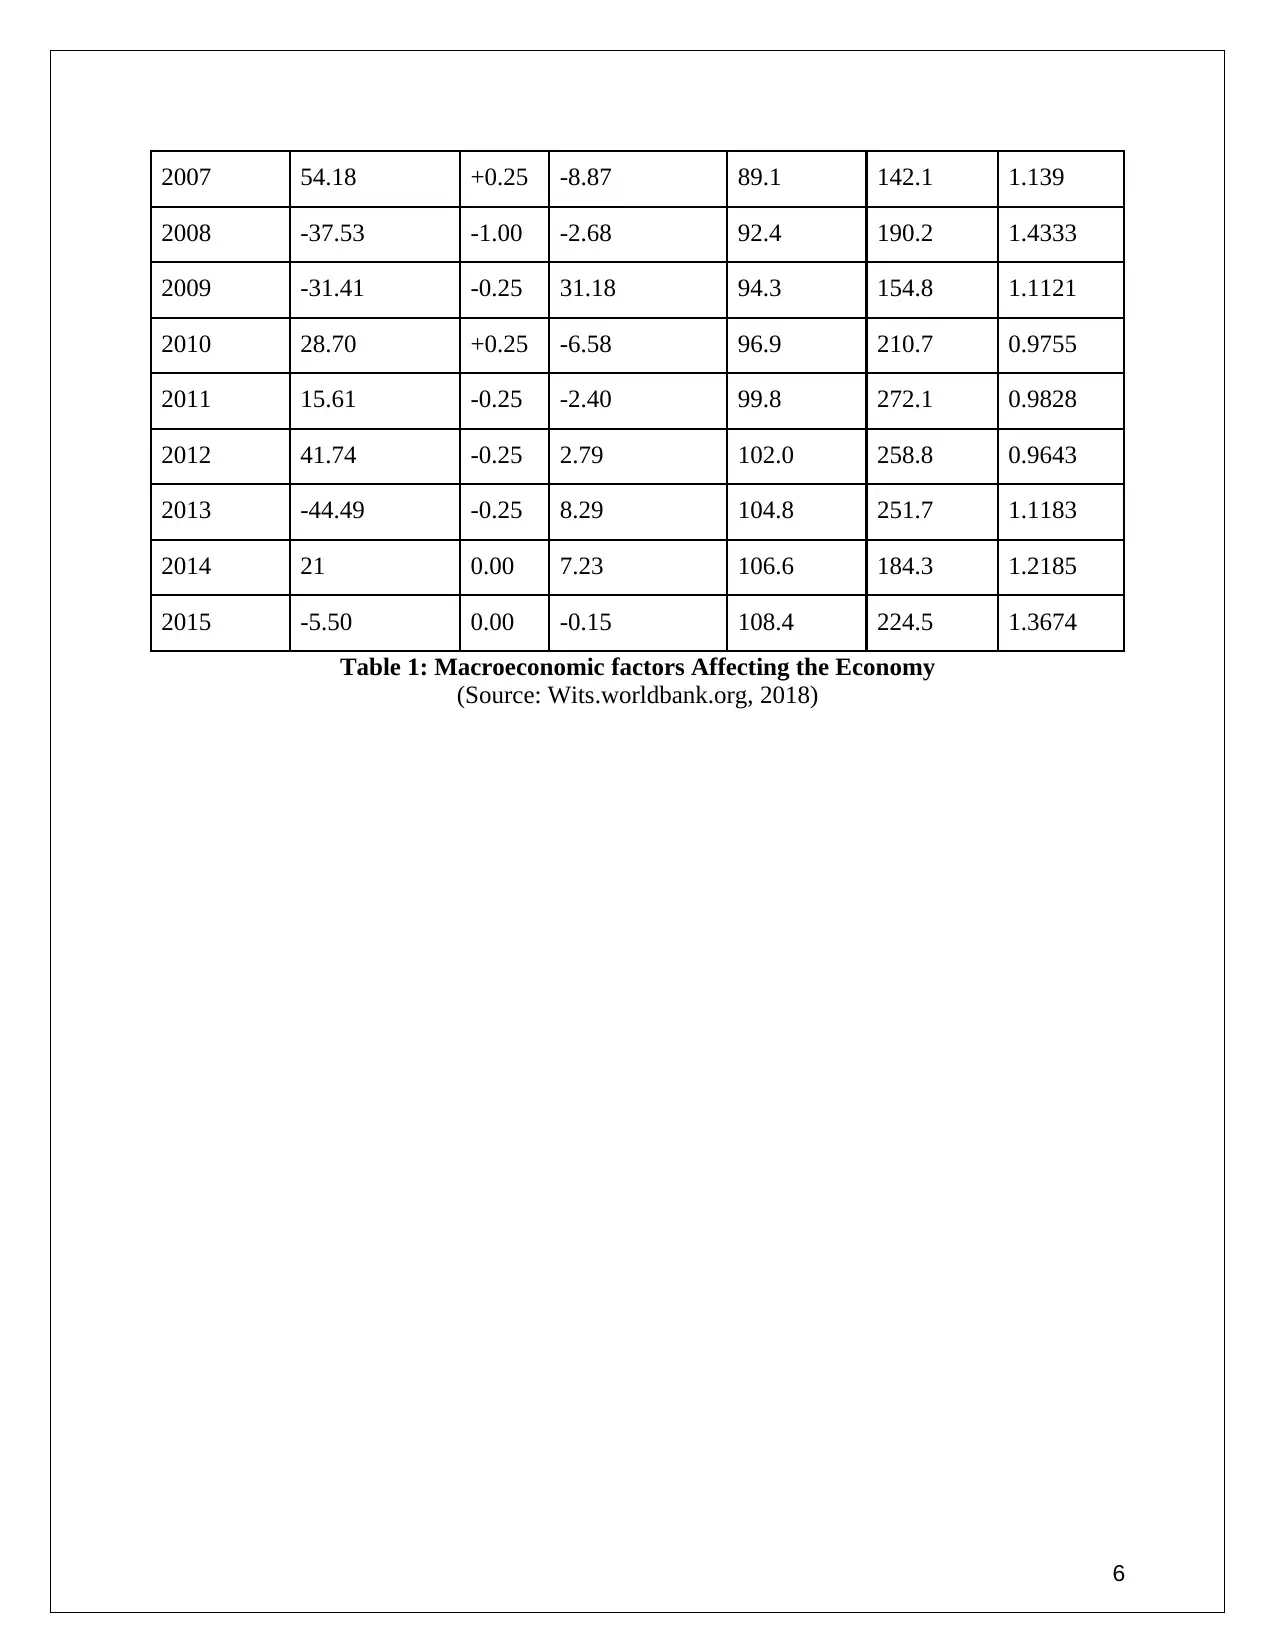
Table 1: Macroeconomic factors Affecting the Economy
(Source: Wits.worldbank.org, 2018)
6
2008 -37.53 -1.00 -2.68 92.4 190.2 1.4333
2009 -31.41 -0.25 31.18 94.3 154.8 1.1121
2010 28.70 +0.25 -6.58 96.9 210.7 0.9755
2011 15.61 -0.25 -2.40 99.8 272.1 0.9828
2012 41.74 -0.25 2.79 102.0 258.8 0.9643
2013 -44.49 -0.25 8.29 104.8 251.7 1.1183
2014 21 0.00 7.23 106.6 184.3 1.2185
2015 -5.50 0.00 -0.15 108.4 224.5 1.3674
Table 1: Macroeconomic factors Affecting the Economy
(Source: Wits.worldbank.org, 2018)
6
⊘ This is a preview!⊘
Do you want full access?
Subscribe today to unlock all pages.
Trusted by 1+ million students worldwide
2.2: Discussion on the Relationship of Australia’s Real GDP growth Rate and Inflation
Rate along with the relationship of unemployment rate and real GDP growth rate
All the economic factors are inter-dependable on each other and a change in any one of them
changes the economy as a whole. Though some of the factors are more important than the other
such as the GDP, Inflation Rate, Unemployment Rate, Cash Rate, etc, the minor factors would be
automatically be affected by any change in the major ones. These are the major elements of
economics which the government needs to take care of and these elements in return control the
other minor factors of the economy. GDP that is the Gross Domestic Product as the name
indicates refers to the total amount of goods and services produced within the geographical area
of the country and in a specified time (Anz.com, 2018). To calculate the Real GDP growth rate,
the GDP value is measured on the basis of the base year price and this gives us the Real GDP
growth rate of the country.
Australia’s Real GDP growth rate in 2017 changed up to 2.7%. When a country plans to gear
up its GDP, for this the demand for labor increases which results in the increase of wages. Thus
the unemployment rate reduces and the economy boosts up the purchasing power of its citizens.
The purchasing power of the people increases due to the decreasing unemployment rate and
increased wages. The increased purchasing power results in the increased demand for the goods
and thus the price level increases, which is nothing but inflation. Inflation is nothing but the rate
at which the prices of the goods and services are increasing. Australia’s last inflation rate has
risen by 1.9 %, in the March quarter of 2018.
Real GDP and inflation rate are the two major instruments of the economy. The unemployment
rate is also a major element of the economy. The need to control the Economy, if emerges then
these three factors should be the tools to do so (Manalo, et al., 2015, p.68). Real GDP growth
rate and the unemployment rate are negatively related while the inflation rate and Real GDP
growth rate are positively related. As far as the unemployment rate and inflation rate are
concerned, both are positively related.
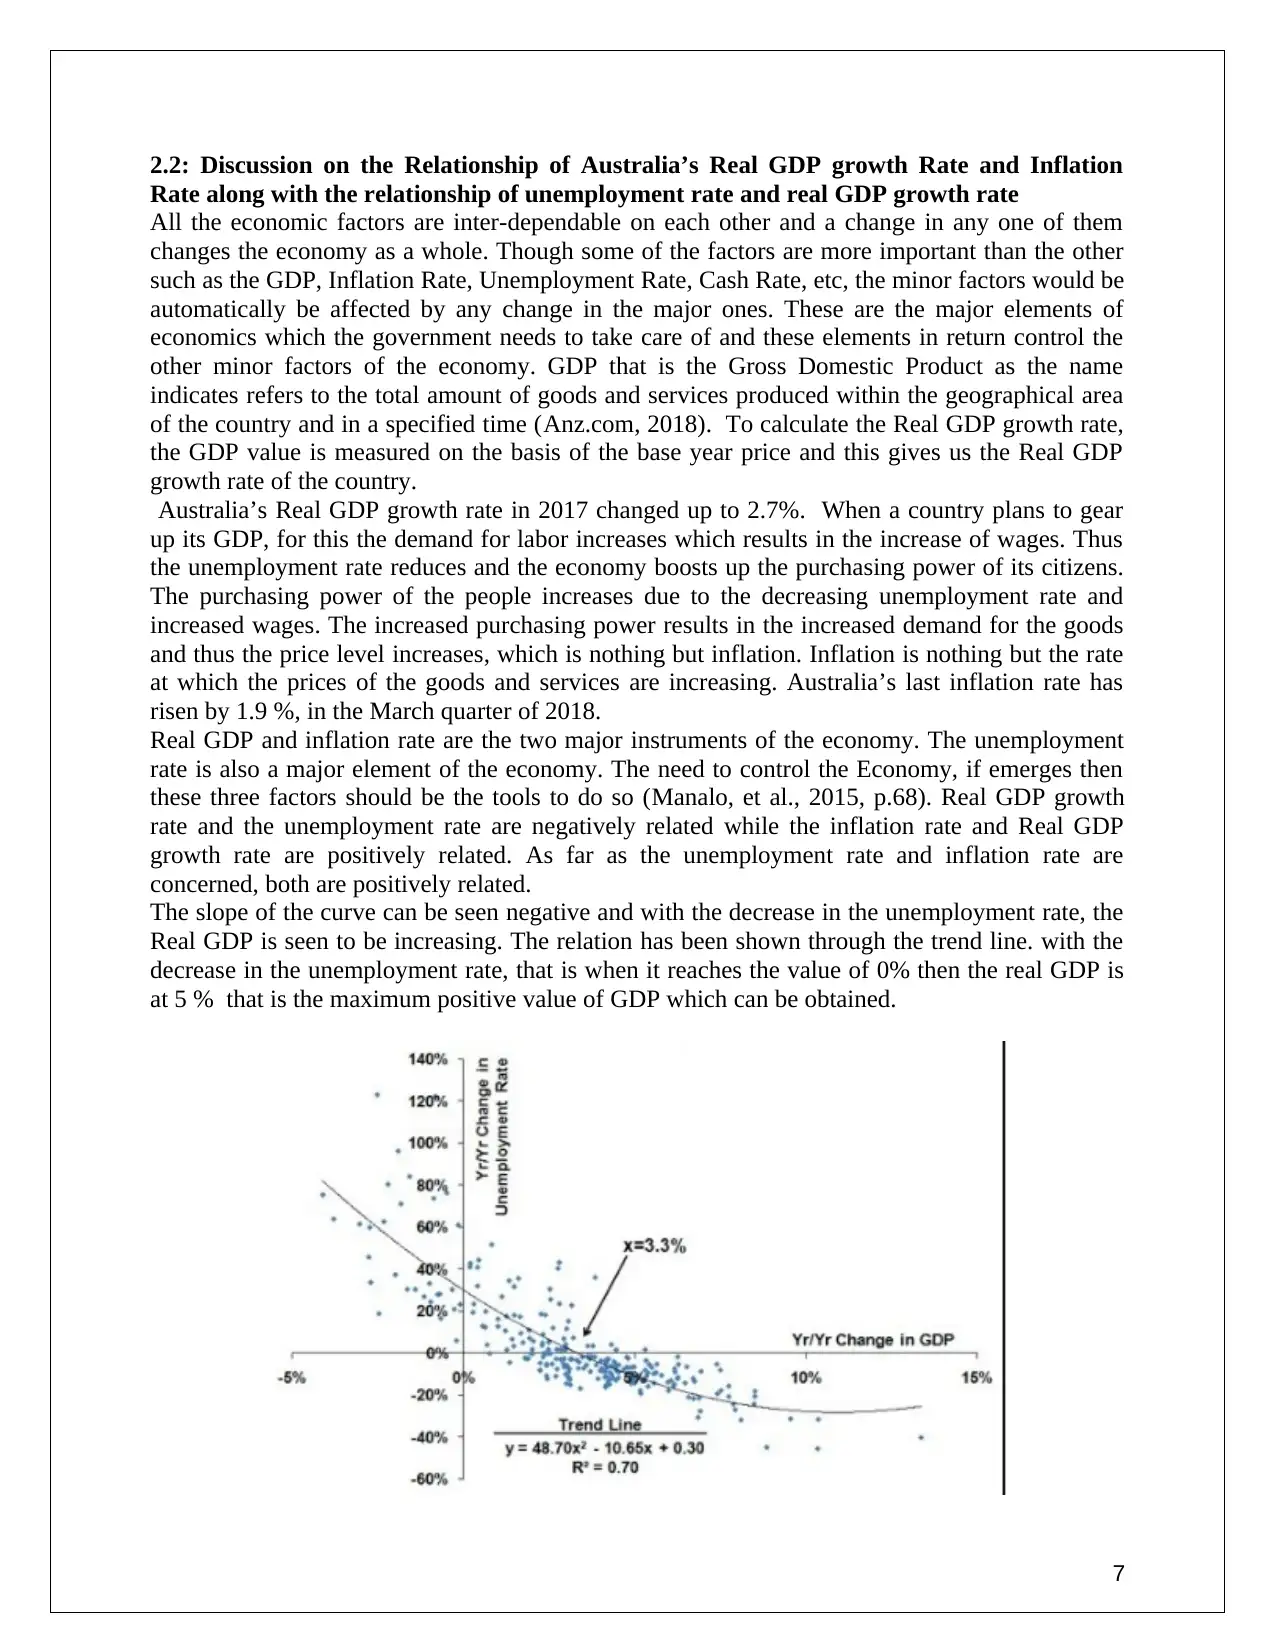
The slope of the curve can be seen negative and with the decrease in the unemployment rate, the
Real GDP is seen to be increasing. The relation has been shown through the trend line. with the
decrease in the unemployment rate, that is when it reaches the value of 0% then the real GDP is
at 5 % that is the maximum positive value of GDP which can be obtained.
7
Rate along with the relationship of unemployment rate and real GDP growth rate
All the economic factors are inter-dependable on each other and a change in any one of them
changes the economy as a whole. Though some of the factors are more important than the other
such as the GDP, Inflation Rate, Unemployment Rate, Cash Rate, etc, the minor factors would be
automatically be affected by any change in the major ones. These are the major elements of
economics which the government needs to take care of and these elements in return control the
other minor factors of the economy. GDP that is the Gross Domestic Product as the name
indicates refers to the total amount of goods and services produced within the geographical area
of the country and in a specified time (Anz.com, 2018). To calculate the Real GDP growth rate,
the GDP value is measured on the basis of the base year price and this gives us the Real GDP
growth rate of the country.
Australia’s Real GDP growth rate in 2017 changed up to 2.7%. When a country plans to gear
up its GDP, for this the demand for labor increases which results in the increase of wages. Thus
the unemployment rate reduces and the economy boosts up the purchasing power of its citizens.
The purchasing power of the people increases due to the decreasing unemployment rate and
increased wages. The increased purchasing power results in the increased demand for the goods
and thus the price level increases, which is nothing but inflation. Inflation is nothing but the rate
at which the prices of the goods and services are increasing. Australia’s last inflation rate has
risen by 1.9 %, in the March quarter of 2018.
Real GDP and inflation rate are the two major instruments of the economy. The unemployment
rate is also a major element of the economy. The need to control the Economy, if emerges then
these three factors should be the tools to do so (Manalo, et al., 2015, p.68). Real GDP growth
rate and the unemployment rate are negatively related while the inflation rate and Real GDP
growth rate are positively related. As far as the unemployment rate and inflation rate are
concerned, both are positively related.
The slope of the curve can be seen negative and with the decrease in the unemployment rate, the
Real GDP is seen to be increasing. The relation has been shown through the trend line. with the
decrease in the unemployment rate, that is when it reaches the value of 0% then the real GDP is
at 5 % that is the maximum positive value of GDP which can be obtained.
7
Paraphrase This Document
Need a fresh take? Get an instant paraphrase of this document with our AI Paraphraser
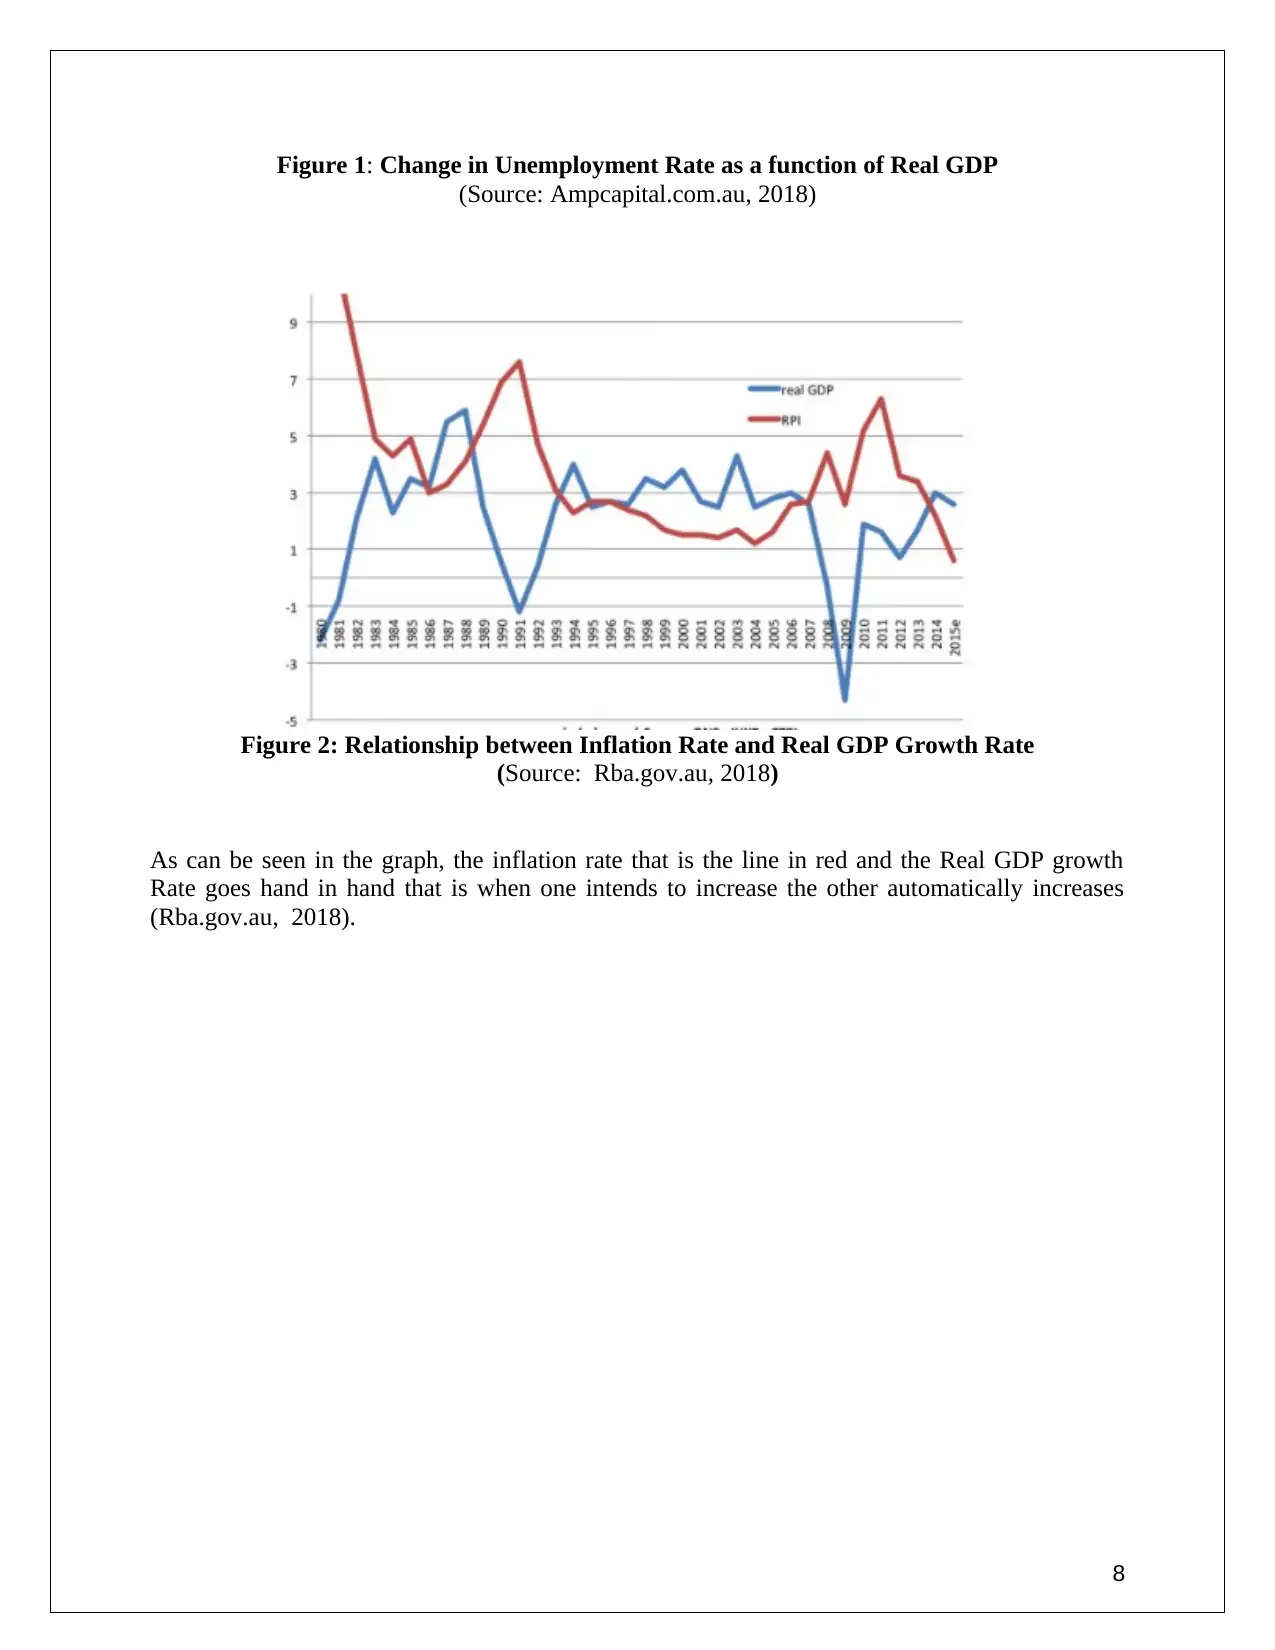
Figure 1: Change in Unemployment Rate as a function of Real GDP
(Source: Ampcapital.com.au, 2018)
Figure 2: Relationship between Inflation Rate and Real GDP Growth Rate
(Source: Rba.gov.au, 2018)
As can be seen in the graph, the inflation rate that is the line in red and the Real GDP growth
Rate goes hand in hand that is when one intends to increase the other automatically increases
(Rba.gov.au, 2018).
8
2.3: Discussing the relationship between the Net Exports and Real Exchange Rate of
Australia and U.S.A
Net Export refers to that amount of goods which gets calculated by Export fewer Imports of the
country. If the Net Export is higher or positive that means the country is in a better position and
if the net exports are negative that is the country needs to import more goods than it exports, it is
a matter of economic concern. The Net exports depend on the exchange rate of a country. It is
the rate at which one country sells goods to the other country. It can also be defined as the value
of one currency in terms of the other currency (Bajada, et al., 2017, p.67). As Australia's
economy works on a free market system which includes trade and financial flows, the exchange
rate is very crucial part of Australia's economy.
The exchange rate of Australia in terms of U.S. that is the value of $1 in terms of AUD, last
recorded was 1.3239 ($1= 1.3239AUD). The Net export of Australia in 2017 was -117 which
means that the import exceeded the export of the country. Whereas that of U.S. the net export of
U.S. amounted to -602, which is again import higher than the export. If the comparison is made
between the net exports of Australia and U.S, then the U.S. needs to check its imports as that
would help in increasing its GDP rate (Wilde, et al., 2017, p.35). The home production of the
goods would generate more benefits to the country.
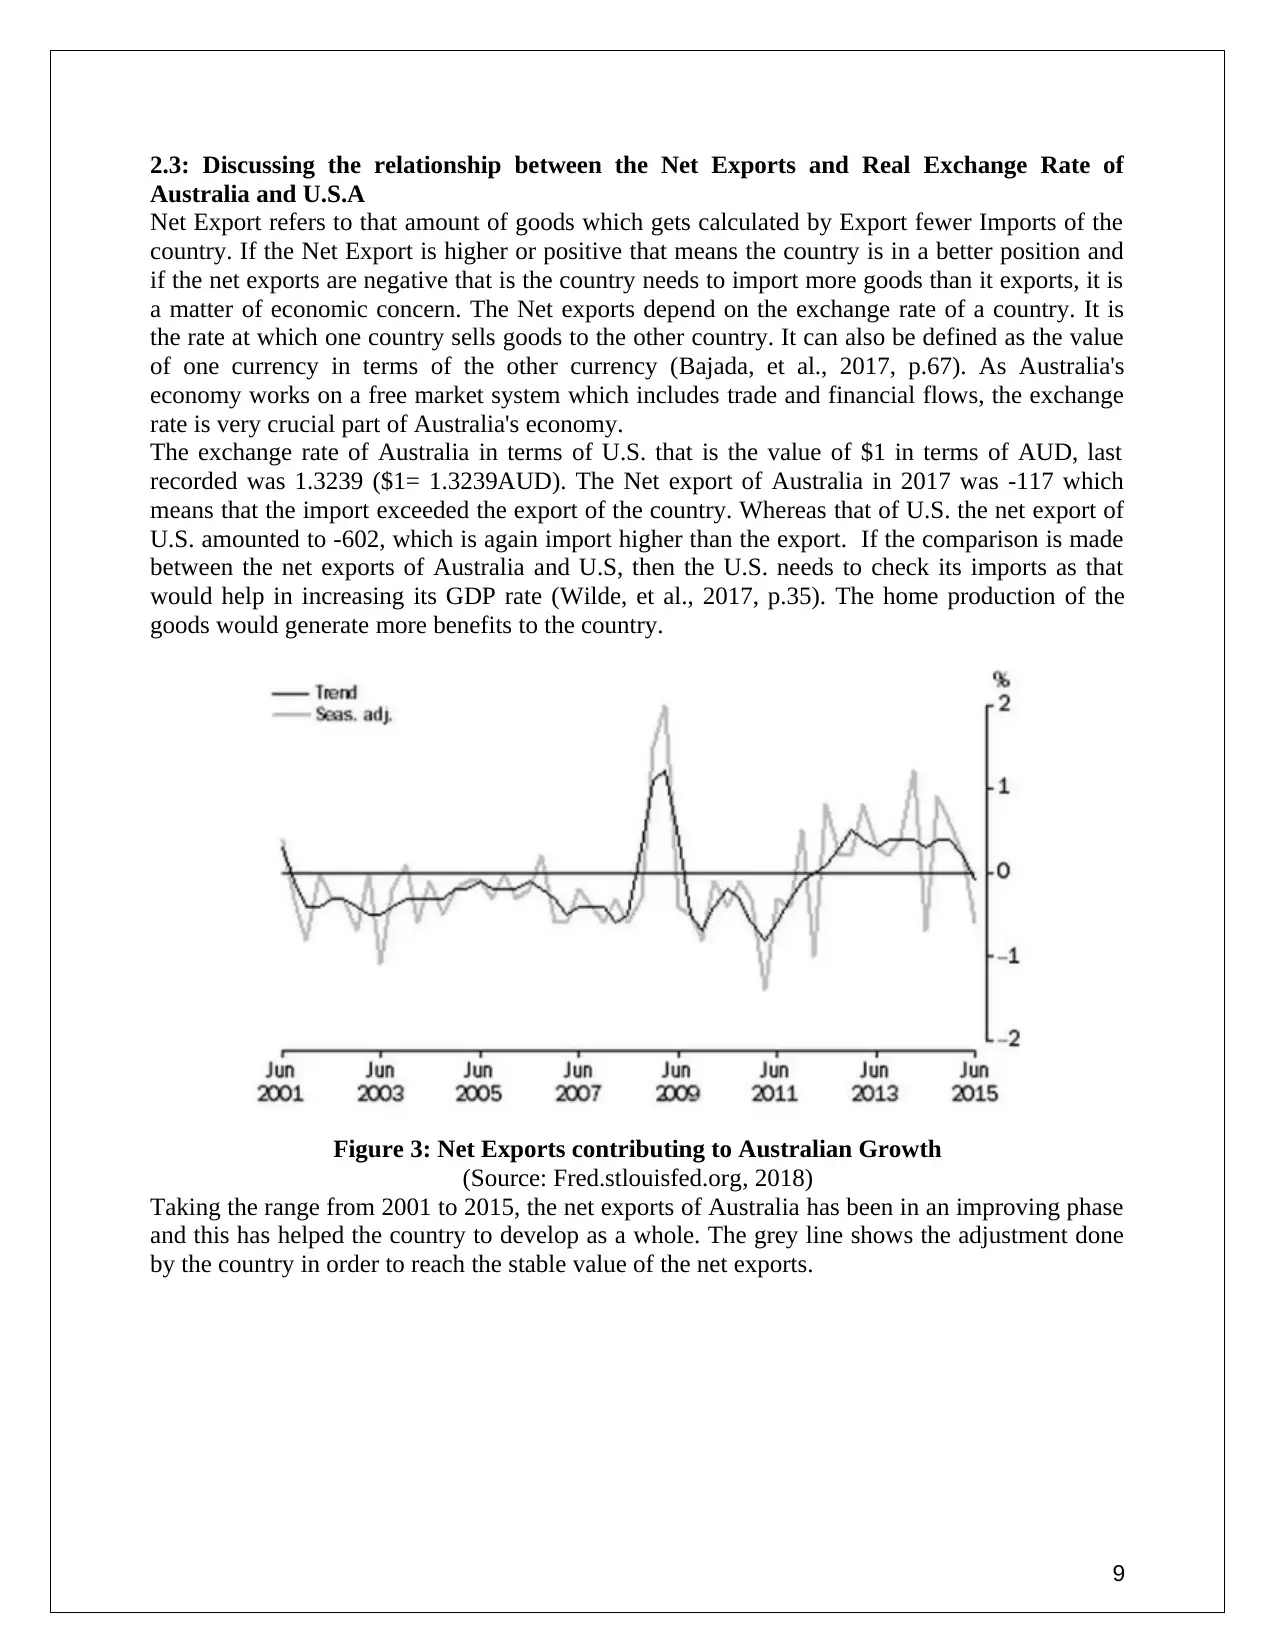
Figure 3: Net Exports contributing to Australian Growth
(Source: Fred.stlouisfed.org, 2018)
Taking the range from 2001 to 2015, the net exports of Australia has been in an improving phase
and this has helped the country to develop as a whole. The grey line shows the adjustment done
by the country in order to reach the stable value of the net exports.
9
Australia and U.S.A
Net Export refers to that amount of goods which gets calculated by Export fewer Imports of the
country. If the Net Export is higher or positive that means the country is in a better position and
if the net exports are negative that is the country needs to import more goods than it exports, it is
a matter of economic concern. The Net exports depend on the exchange rate of a country. It is
the rate at which one country sells goods to the other country. It can also be defined as the value
of one currency in terms of the other currency (Bajada, et al., 2017, p.67). As Australia's
economy works on a free market system which includes trade and financial flows, the exchange
rate is very crucial part of Australia's economy.
The exchange rate of Australia in terms of U.S. that is the value of $1 in terms of AUD, last
recorded was 1.3239 ($1= 1.3239AUD). The Net export of Australia in 2017 was -117 which
means that the import exceeded the export of the country. Whereas that of U.S. the net export of
U.S. amounted to -602, which is again import higher than the export. If the comparison is made
between the net exports of Australia and U.S, then the U.S. needs to check its imports as that
would help in increasing its GDP rate (Wilde, et al., 2017, p.35). The home production of the
goods would generate more benefits to the country.
Figure 3: Net Exports contributing to Australian Growth
(Source: Fred.stlouisfed.org, 2018)
Taking the range from 2001 to 2015, the net exports of Australia has been in an improving phase
and this has helped the country to develop as a whole. The grey line shows the adjustment done
by the country in order to reach the stable value of the net exports.
9
⊘ This is a preview!⊘
Do you want full access?
Subscribe today to unlock all pages.
Trusted by 1+ million students worldwide
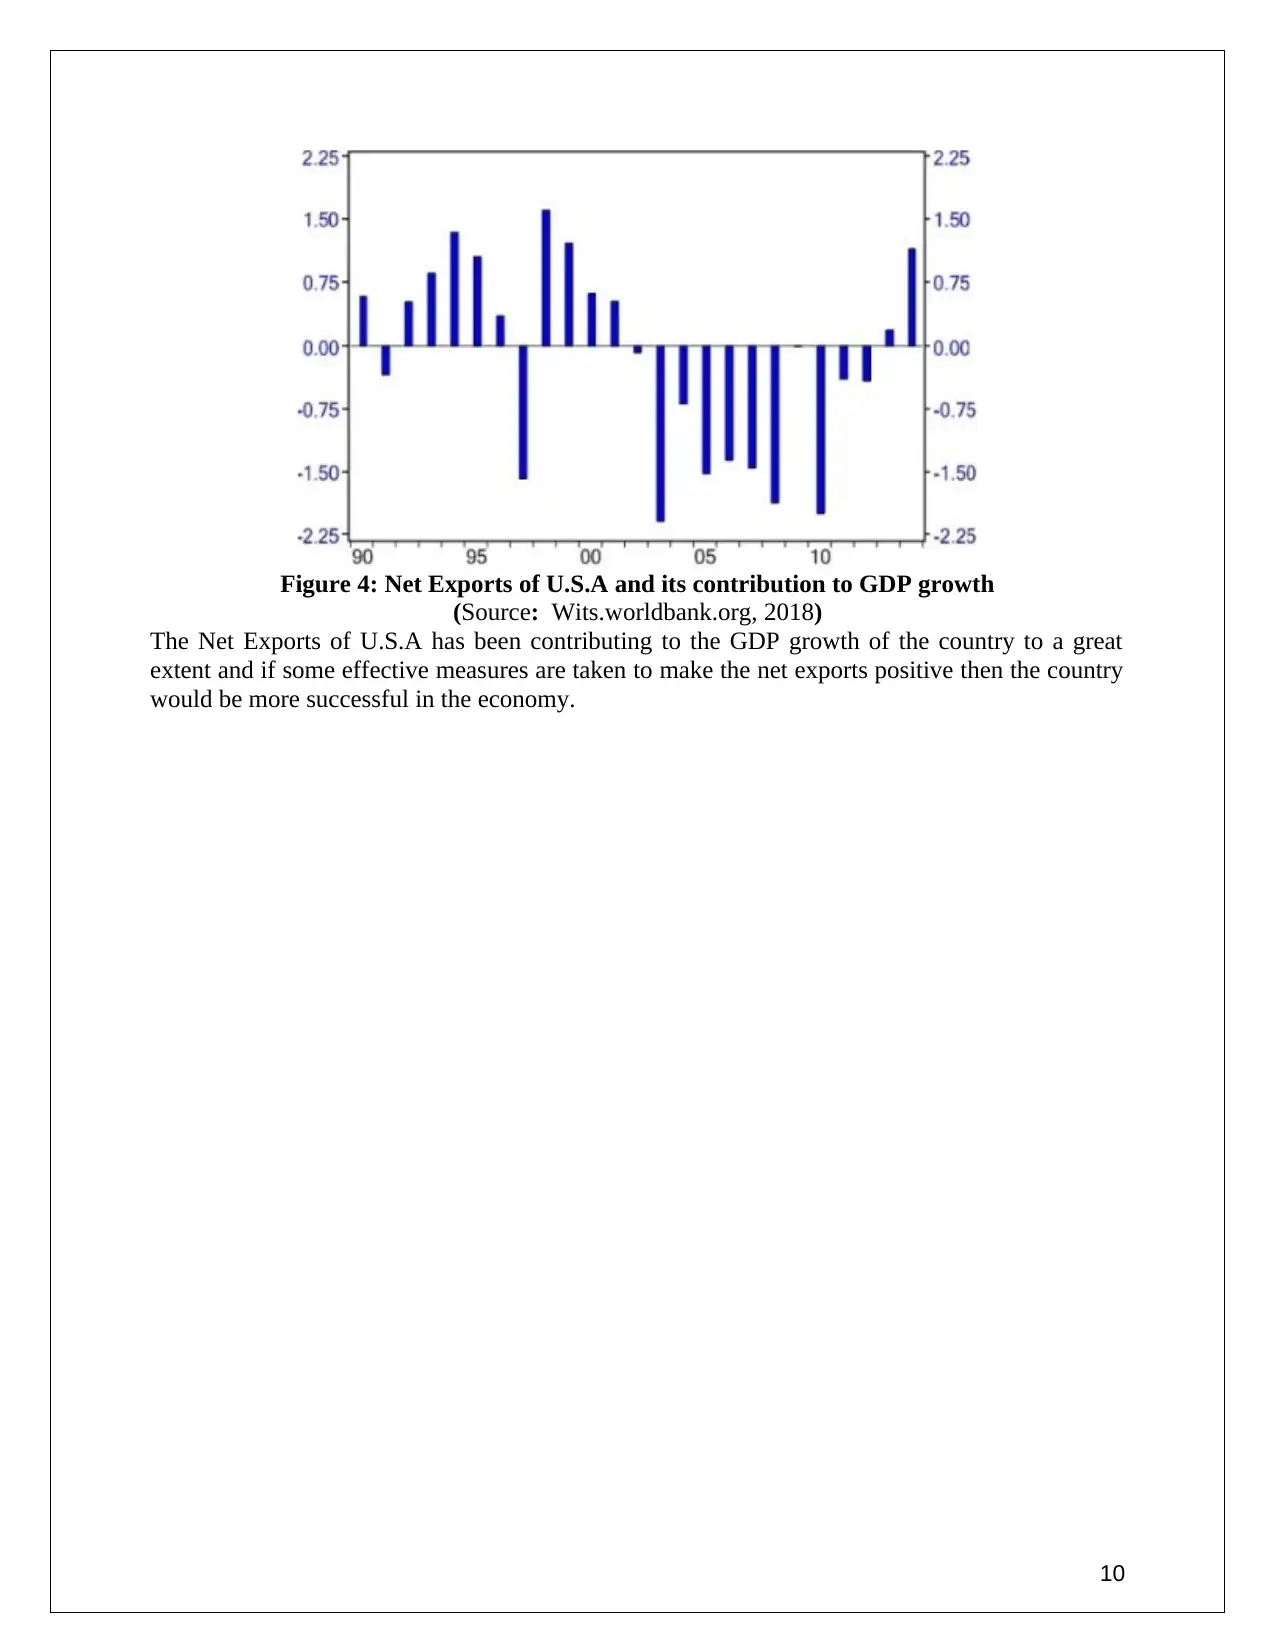
Figure 4: Net Exports of U.S.A and its contribution to GDP growth
(Source: Wits.worldbank.org, 2018)
The Net Exports of U.S.A has been contributing to the GDP growth of the country to a great
extent and if some effective measures are taken to make the net exports positive then the country
would be more successful in the economy.
10
(Source: Wits.worldbank.org, 2018)
The Net Exports of U.S.A has been contributing to the GDP growth of the country to a great
extent and if some effective measures are taken to make the net exports positive then the country
would be more successful in the economy.
10
Paraphrase This Document
Need a fresh take? Get an instant paraphrase of this document with our AI Paraphraser
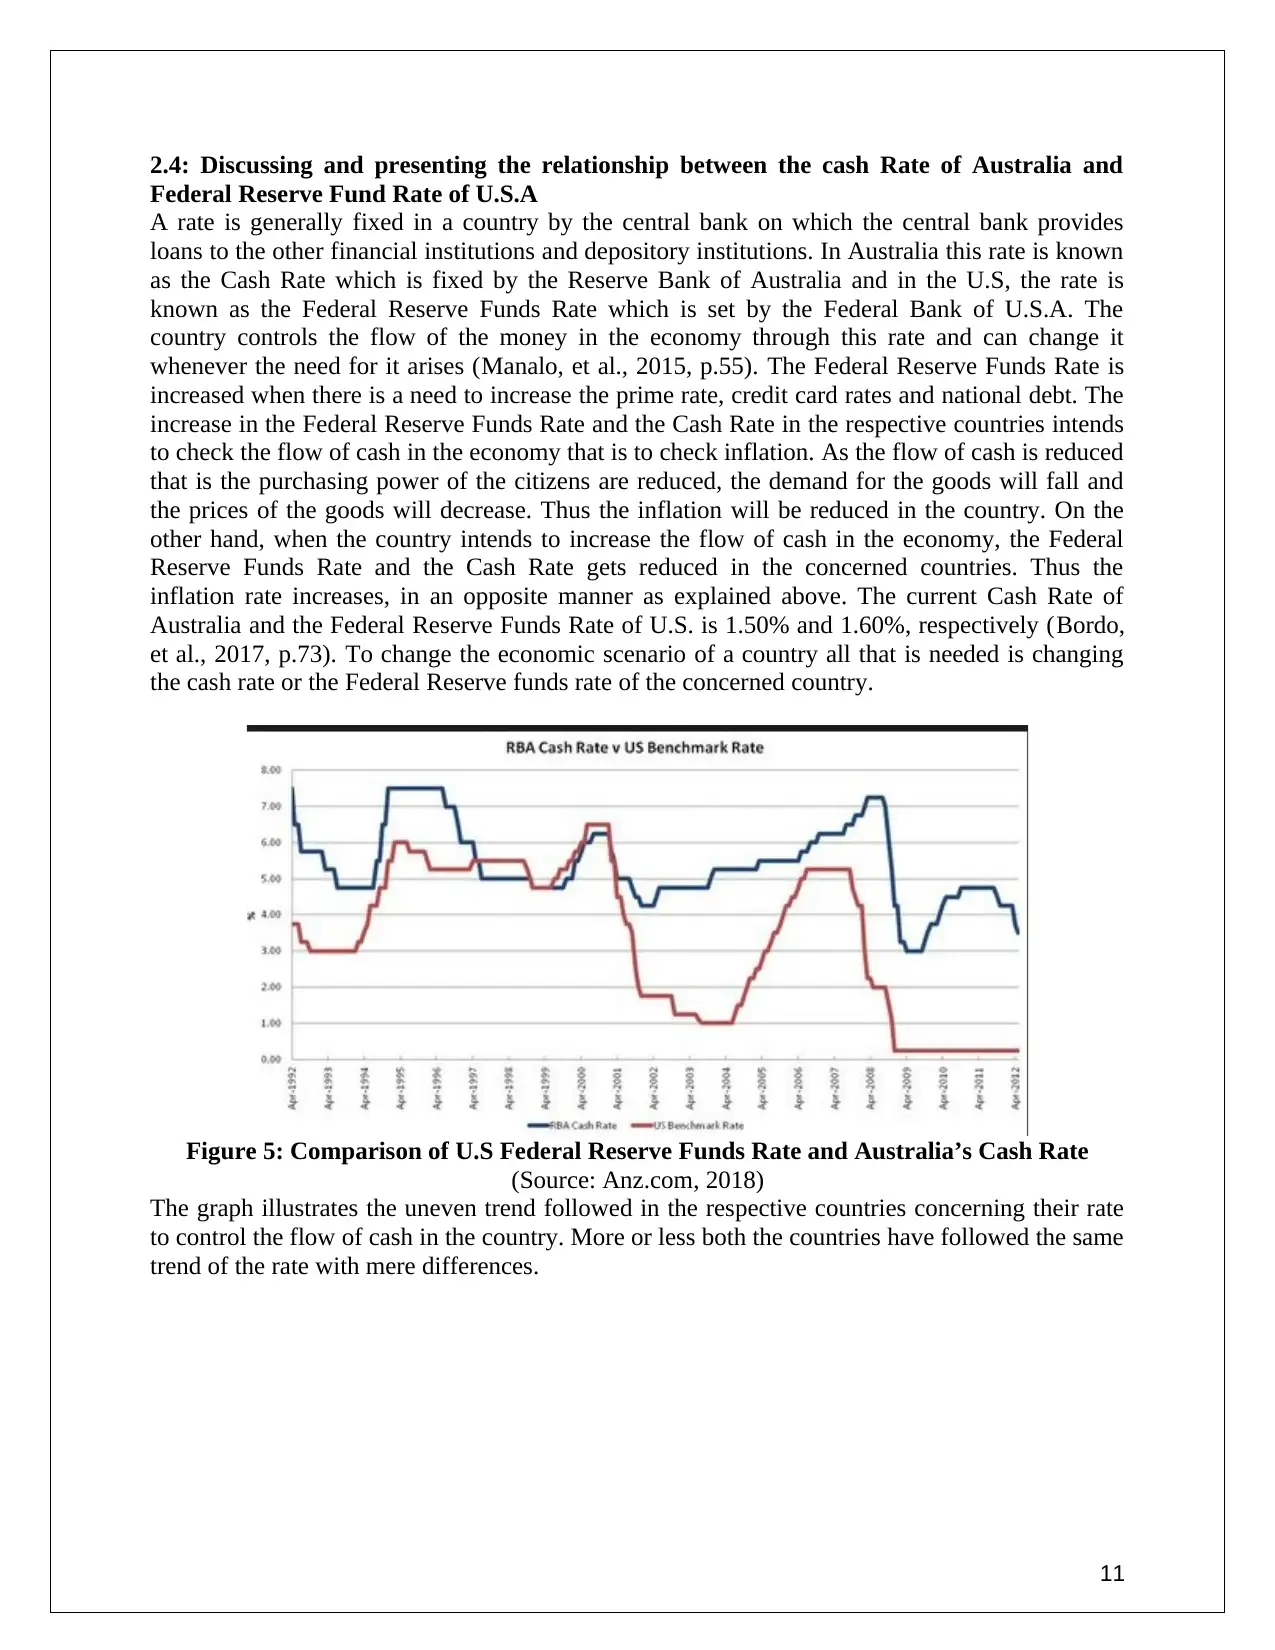
2.4: Discussing and presenting the relationship between the cash Rate of Australia and
Federal Reserve Fund Rate of U.S.A
A rate is generally fixed in a country by the central bank on which the central bank provides
loans to the other financial institutions and depository institutions. In Australia this rate is known
as the Cash Rate which is fixed by the Reserve Bank of Australia and in the U.S, the rate is
known as the Federal Reserve Funds Rate which is set by the Federal Bank of U.S.A. The
country controls the flow of the money in the economy through this rate and can change it
whenever the need for it arises (Manalo, et al., 2015, p.55). The Federal Reserve Funds Rate is
increased when there is a need to increase the prime rate, credit card rates and national debt. The
increase in the Federal Reserve Funds Rate and the Cash Rate in the respective countries intends
to check the flow of cash in the economy that is to check inflation. As the flow of cash is reduced
that is the purchasing power of the citizens are reduced, the demand for the goods will fall and
the prices of the goods will decrease. Thus the inflation will be reduced in the country. On the
other hand, when the country intends to increase the flow of cash in the economy, the Federal
Reserve Funds Rate and the Cash Rate gets reduced in the concerned countries. Thus the
inflation rate increases, in an opposite manner as explained above. The current Cash Rate of
Australia and the Federal Reserve Funds Rate of U.S. is 1.50% and 1.60%, respectively (Bordo,
et al., 2017, p.73). To change the economic scenario of a country all that is needed is changing
the cash rate or the Federal Reserve funds rate of the concerned country.
Figure 5: Comparison of U.S Federal Reserve Funds Rate and Australia’s Cash Rate
(Source: Anz.com, 2018)
The graph illustrates the uneven trend followed in the respective countries concerning their rate
to control the flow of cash in the country. More or less both the countries have followed the same
trend of the rate with mere differences.
11
2.5: Presentation of the detailed discussing on the prediction for Future of Australia’s
Economy
Taking into consideration the data of 2018 of the essential indicator of macroeconomic of
Australia, it could be analysed that Australia economy has minimum chances of depression of
any kind for the following next ten years. According to Lu and Qu, (2015, p.151), the rate of
unemployment in Australia is analysed to be 5.25%. The rate of growth of GDP of Australia has
increased by 2.27%. This accounted for a great rise and shows an improvement in the economy
of the country. The rate of cash of Australia is determined to be 1.5%. This rate of cash makes it
clear that the country wants the citizens of Australia to live a life which is luxurious and lavish.
The rate of cash and the funds of Federal Reserve of the country have been analysed to show no
distinction. This could be used by the country to gear the economy. The rate of cash of the
country which has been determined shows that the issues related to money are maintained in a
proper and balanced way. The rate of unemployment helps in describing the economy's
efficiency for generating or producing work for the country's people. The total export of the
country has been analysed to be 34,352 AUD. The increase in the export of the country has
helped in making the country more active economically. This in turn also helped the country
growing financially. The rate of exchange of the country has also been determined in this project,
which shows an increase in the rate of exchange. The Index of Consumer Price has been
accounted to 1.8 and this shows the maintained balance of the country. The Index of Consumer
Price also shows how the country has managed to deflect the impact of the rate of growth of
GDP and also of the reducing unemployment on prices. Thus, the Index of Consumer Price helps
in recording this. The rate of exchange and total export of Australia helps to achieve the goal of
the country. The rising imports and decreasing exports due to the rate of exchange being high
help in maintaining the balance of economy for the country. By data analysing, it can be
analysed that the government of Australia has focused to maintain the country's economy in a
format that is stable in nature. It has been observed that in the recent past years, Australia has
followed a growth trend of about 2-3 %. By December 2017 it was seen that the growth rate
revolved around a change of about just 0.4% and in that annual year it enjoyed a growth rate of
2.4%. If the country continues to control its inflation and maintains a balance in the other
economic factors, then by next year it may achieve a GDP growth of 4%. The unemployment
rate which is already quite low as compared to other countries would reach its minimum level
and that would help the country to be among on the top of the developed countries list. The
control on the Cash Rate would enhance the country's economy in the mere future and that would
control the exchange rate too. Hence the net exports will be checked in turn.
12
⊘ This is a preview!⊘
Do you want full access?
Subscribe today to unlock all pages.
Trusted by 1+ million students worldwide
1 out of 15


Your All-in-One AI-Powered Toolkit for Academic Success.
+13062052269
info@desklib.com
Available 24*7 on WhatsApp / Email
![[object Object]](/_next/static/media/star-bottom.7253800d.svg)
Unlock your academic potential
Copyright © 2020–2026 A2Z Services. All Rights Reserved. Developed and managed by ZUCOL.