BUS708 Statistical Modelling Report: Improving Airline Services in AU
VerifiedAdded on 2023/04/21
|13
|2296
|383
Report
AI Summary
This report analyzes airline services in Australia using statistical modeling, addressing a business problem related to improving airport services. It uses both secondary data from the Australian Government Open Data site and primary data collected through surveys. The analysis includes descriptive statistics, hypothesis testing, and correlation analysis to evaluate airport performance and customer satisfaction. Key findings indicate the distribution of flight numbers, comparison of flight volumes in and out of Australia, and a performance comparison between Brisbane, Melbourne, and Sydney airports. Sydney Airport shows leading performance and higher customer satisfaction. The report concludes with recommendations for future studies, emphasizing factors influencing the air freight market and the importance of adapting to changing consumer preferences and technological advancements. Desklib provides access to this report and many other solved assignments for students.
Running head: BUS708 ASSIGNMENT 1
Bus708 Assignment
Name
Date
Bus708 Assignment
Name
Date
Paraphrase This Document
Need a fresh take? Get an instant paraphrase of this document with our AI Paraphraser
BUS708 ASSIGNMENT 2
Bus708 Assignment
1 (a)
Air freight is a reasonably small but exceedingly valuable part of the global freight
function in Australia. The total weight of international and domestic air freight, about 1.6 million
tonnes in 2016 to 2017, signifies not more than 0.98 percent of the freight shipped in Australia
(Alexander & Merkert, 2017). Nearly 72 percent of air freight is international freight, implying it
is a significant contributor to the country’s economy (Farabi, 2012). All the same, the Australian
aviation and airlines industry has witnessed significant upheavals (Olsen, 2005). These changes
include the absorption of Impulse Airlines into Qantas, downfall of the Ansett group, the
entrance and fast growth of Virgin Blue and the formation of Australian Airlines, Jetconnect and
Freedom Air (Williams, 2003).
Additionally, the 1990s drift towards the liberalization of Australasian air services has
continued with the formation of an Open Skies pact between New Zealand and Australia in late
2000 (Kain & Webb, 2003). These upheavals raise the question of whether Australia's domestic
market is actually big enough to withstand competitive supply and whether a flippantly
controlled oligopoly is still suitable. This paper analyses the current state of the airline industry
in Australia and also includes a review of the emerging competition and economic, regulatory
issues affecting the industry. Recommendations for improving airport services to the airline in
Australia are also captured in this paper.
1 (b)
The given type of data is secondary data as it was retrieved from the online Australian
Government Open Data site. Secondary data as explained by Kumar (2010), is data that has been
BUS708 ASSIGNMENT 3
collected by someone else other than the user. The primary sources of secondary data include
censuses, government economic reports, newspapers, peer-reviewed journals, periodicals,
magazines, etc. According to Ross (2012), using secondary data in any research is advantageous
as they are cost-effective in terms of resources and time; offers a foundation for correlation of
data that has been collected by other scholars and are readily available (Stopher, 2012).
Secondary data has also been criticized for several other reasons including being inaccurate or
out of date. At the same time, the given dataset comprises both numeric variables and
categorical.
Numerical variables are variables that have their values as numbers. In this case, the
numeric variables include the number of stops airlines have, number flight in or out in the month,
number of maximum seats and year and month of travel. Categorical variables are explained by
Stopher (2012) as variables that somebody can assign different categories, but the groups have
no natural order. In this context, the categorical variables in dataset one the number of stops
airlines have, port region, Australian City, international city that airline lands or flies out, the
name of the airline, airline routes, country and region that an airline belongs to any country that
do the servicing of a particular airline.
1 (c)
The dataset 2 is mainly composed of primary data as the researcher obtained first-hand
information about the study topic (Ross, 2012). The researcher collected first-hand information
using direct interviews, survey questionnaires and through direct observations. The key
advantages of using this type of data include obtaining accurate and reliable data and does not
carry opinions or bias of third parties. Besides, primary data have been questioned due to having
⊘ This is a preview!⊘
Do you want full access?
Subscribe today to unlock all pages.
Trusted by 1+ million students worldwide
BUS708 ASSIGNMENT 4
a huger expense than secondary research, being time-consuming and the outcome from research
audience not being always feasible.
As for the sampling technique that was used to collect dataset 2, the researcher used a
simple random sampling technique. Random sampling is a sampling technique where each item
in a sample has an equal chance of being selected (Ross, 2012). Although random sampling
techniques were applied to collect data for dataset2, it was faulted for being a complex and time-
consuming method of research and which required the researcher to have experience and a high
skill level. As such, the quality of the obtained data was reliant on the quality and skills of the
researcher and hence could have been biased and inaccurate to some extent.
For dataset 2, the researcher wanted to establish which airport in Australia specifically
Melbourne, Brisbane, and Sydney, were KOI student having a good experience in Flying in or
out through. The two variables of interest under this dataset were airport location and the
satisfaction with the flying experience. As this was a small scale study, the researcher surveyed
25 respondents to obtain the required data. In this context, airport location can be classified as
categorical variables while the satisfaction with the flying experience can be considered to be a
numeric variable (continuous).
Paraphrase This Document
Need a fresh take? Get an instant paraphrase of this document with our AI Paraphraser

BUS708 ASSIGNMENT 5
2(a)
Table 1: Summary statistics of All Flights
0-19 20-39 40-59 60-79 80-99 100-119 120-139 140-159 160-179
0
5000
10000
15000
20000
25000
30000
35000
40000
45000
50000
All Flights
Figure 1: All flights made in Australia in 2018
Mean 24.8998
Standard Error 0.07029
Median 22
Mode 31
Standard
Deviation
21.4376
2
Sample
Variance
459.571
4
Kurtosis
9.37841
1
Skewness
2.54246
7
Range 170
Minimum 0
Maximum 170
Sum 2316105
Count 93017
BUS708 ASSIGNMENT 6
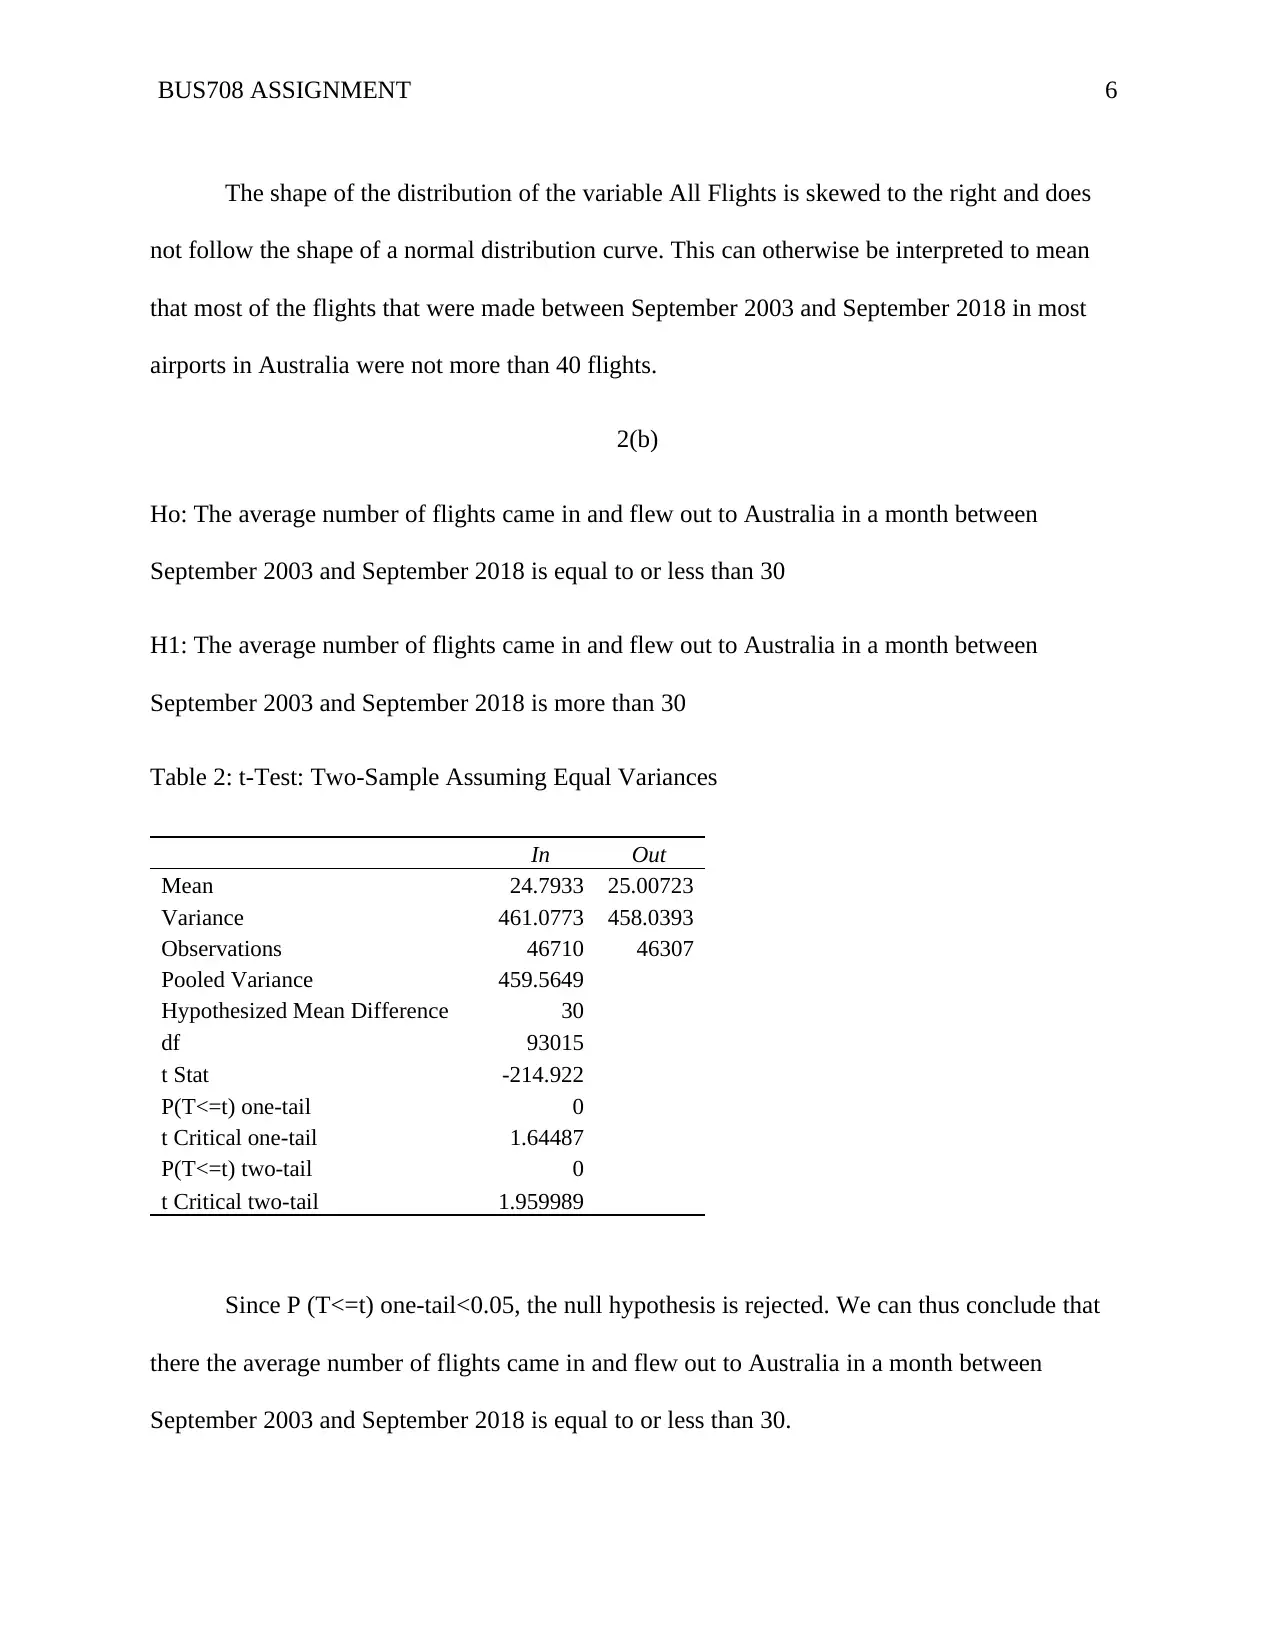
The shape of the distribution of the variable All Flights is skewed to the right and does
not follow the shape of a normal distribution curve. This can otherwise be interpreted to mean
that most of the flights that were made between September 2003 and September 2018 in most
airports in Australia were not more than 40 flights.
2(b)
Ho: The average number of flights came in and flew out to Australia in a month between
September 2003 and September 2018 is equal to or less than 30
H1: The average number of flights came in and flew out to Australia in a month between
September 2003 and September 2018 is more than 30
Table 2: t-Test: Two-Sample Assuming Equal Variances
In Out
Mean 24.7933 25.00723
Variance 461.0773 458.0393
Observations 46710 46307
Pooled Variance 459.5649
Hypothesized Mean Difference 30
df 93015
t Stat -214.922
P(T<=t) one-tail 0
t Critical one-tail 1.64487
P(T<=t) two-tail 0
t Critical two-tail 1.959989
Since P (T<=t) one-tail<0.05, the null hypothesis is rejected. We can thus conclude that
there the average number of flights came in and flew out to Australia in a month between
September 2003 and September 2018 is equal to or less than 30.
⊘ This is a preview!⊘
Do you want full access?
Subscribe today to unlock all pages.
Trusted by 1+ million students worldwide
BUS708 ASSIGNMENT 7
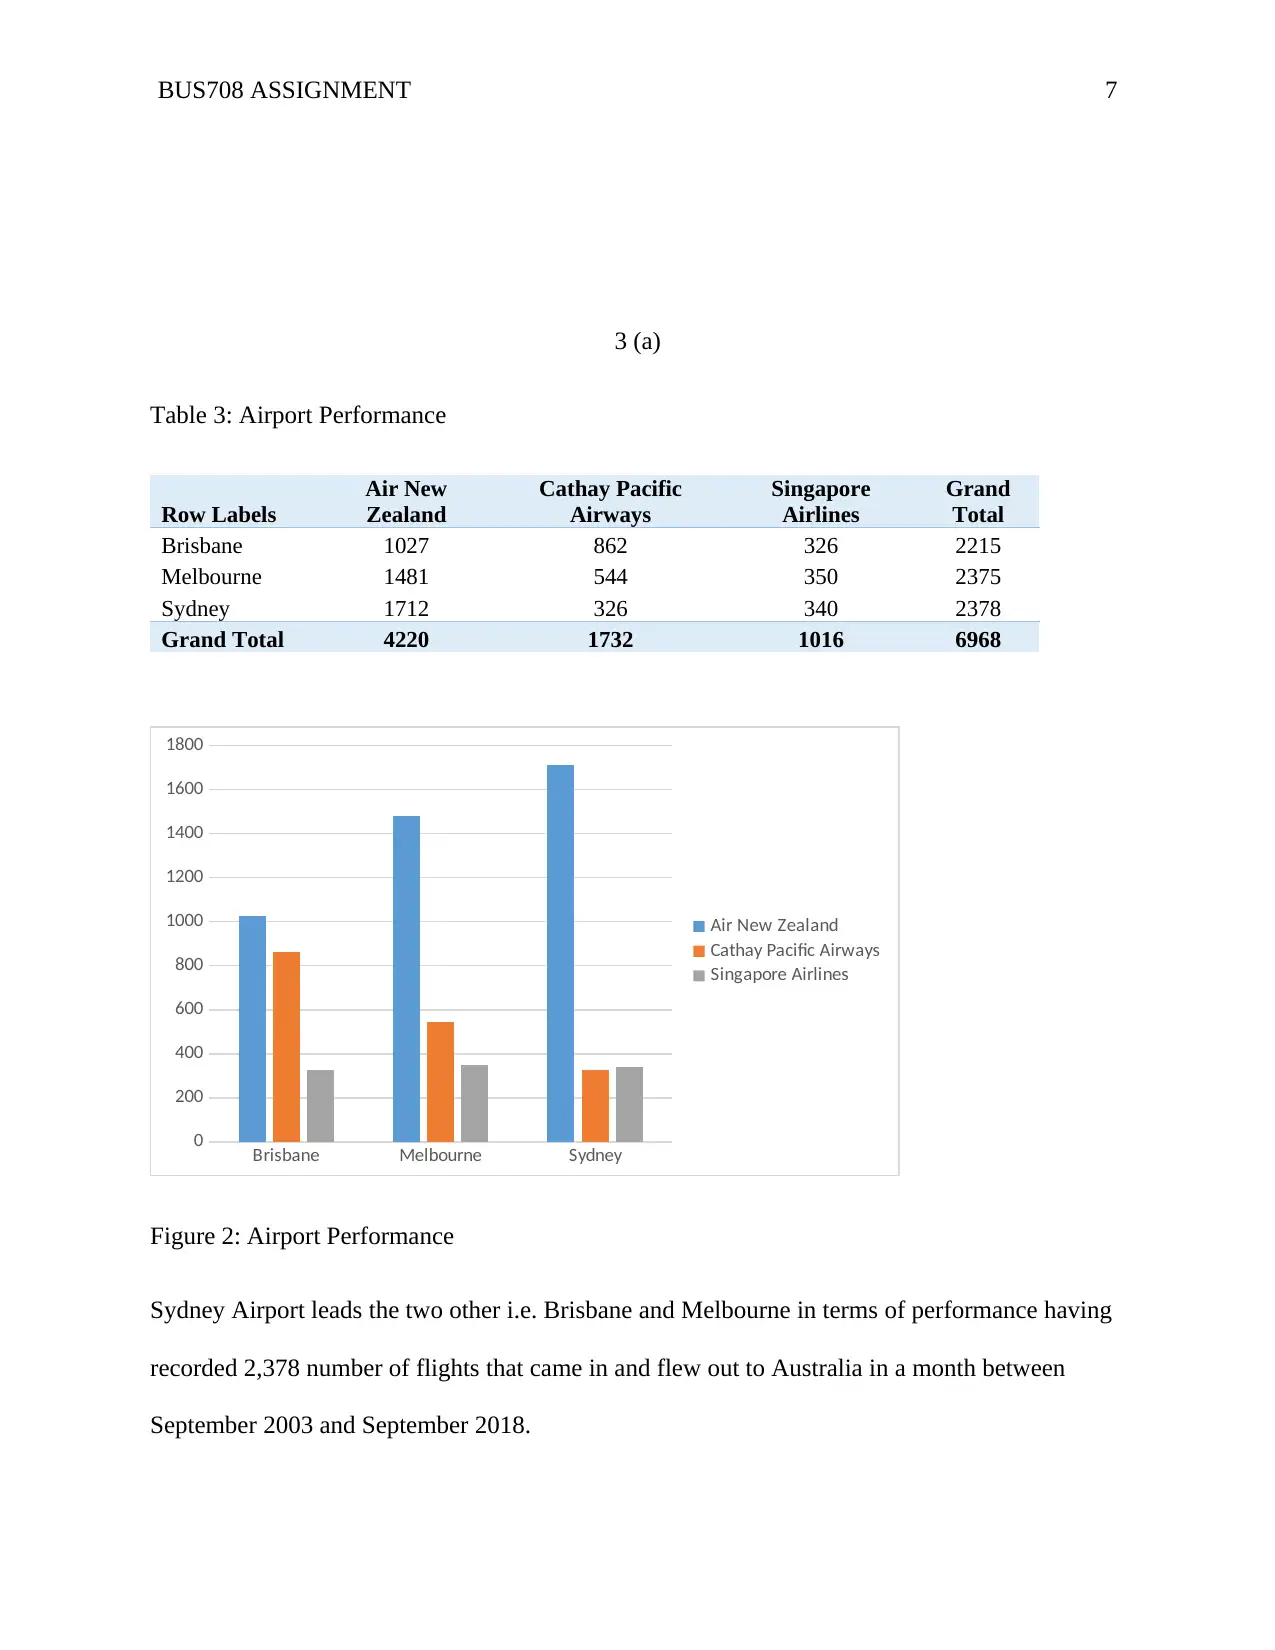
3 (a)
Table 3: Airport Performance
Row Labels
Air New
Zealand
Cathay Pacific
Airways
Singapore
Airlines
Grand
Total
Brisbane 1027 862 326 2215
Melbourne 1481 544 350 2375
Sydney 1712 326 340 2378
Grand Total 4220 1732 1016 6968
Brisbane Melbourne Sydney
0
200
400
600
800
1000
1200
1400
1600
1800
Air New Zealand
Cathay Pacific Airways
Singapore Airlines
Figure 2: Airport Performance
Sydney Airport leads the two other i.e. Brisbane and Melbourne in terms of performance having
recorded 2,378 number of flights that came in and flew out to Australia in a month between
September 2003 and September 2018.
Paraphrase This Document
Need a fresh take? Get an instant paraphrase of this document with our AI Paraphraser
BUS708 ASSIGNMENT 8
3(b)
Ho: There is no significant relationship between Australian City and Airlines
H1: There is no significant relationship between Australian City and Airlines
Table 4: Correlation of Airports and Airlines
Air New Zealand
Cathay Pacific
Airways
Singapore
Airlines
Brisbane 1
Melbourne 0.79056142 1
Sydney 0.675657763 0.985607 1
From the results above, we can conclude that there is not only a correlation between Australian
City and Airlines but a strong positive correlation as the p-values are positive and more than 0.5.
3(c)
Compared with Brisbane and Melbourne airports, Sydney leading in terms of performance
having recorded 2,378 number of flights that came in and flew out to Australia in a month
between September 2003 and September 2018. It is also concluded that there is a strong positive
correlation between Australian City and Airlines.
BUS708 ASSIGNMENT 9
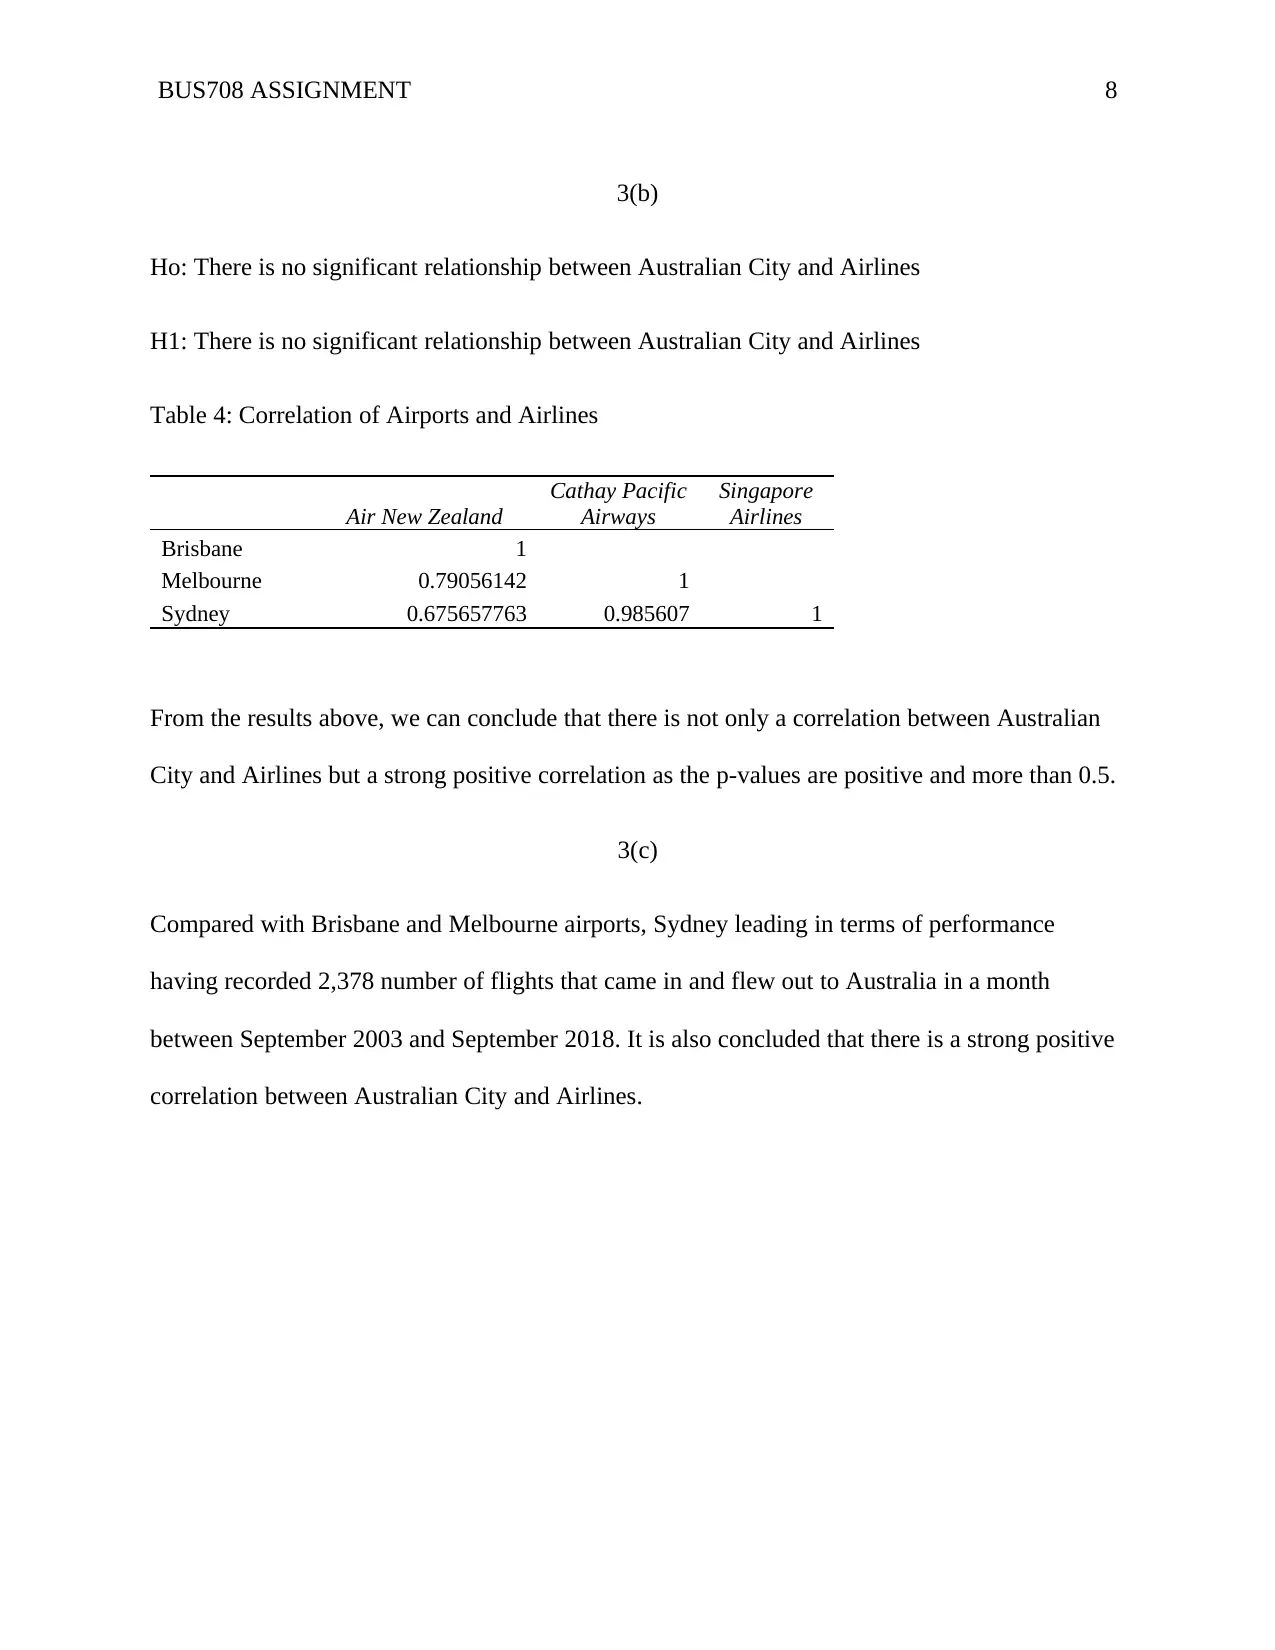
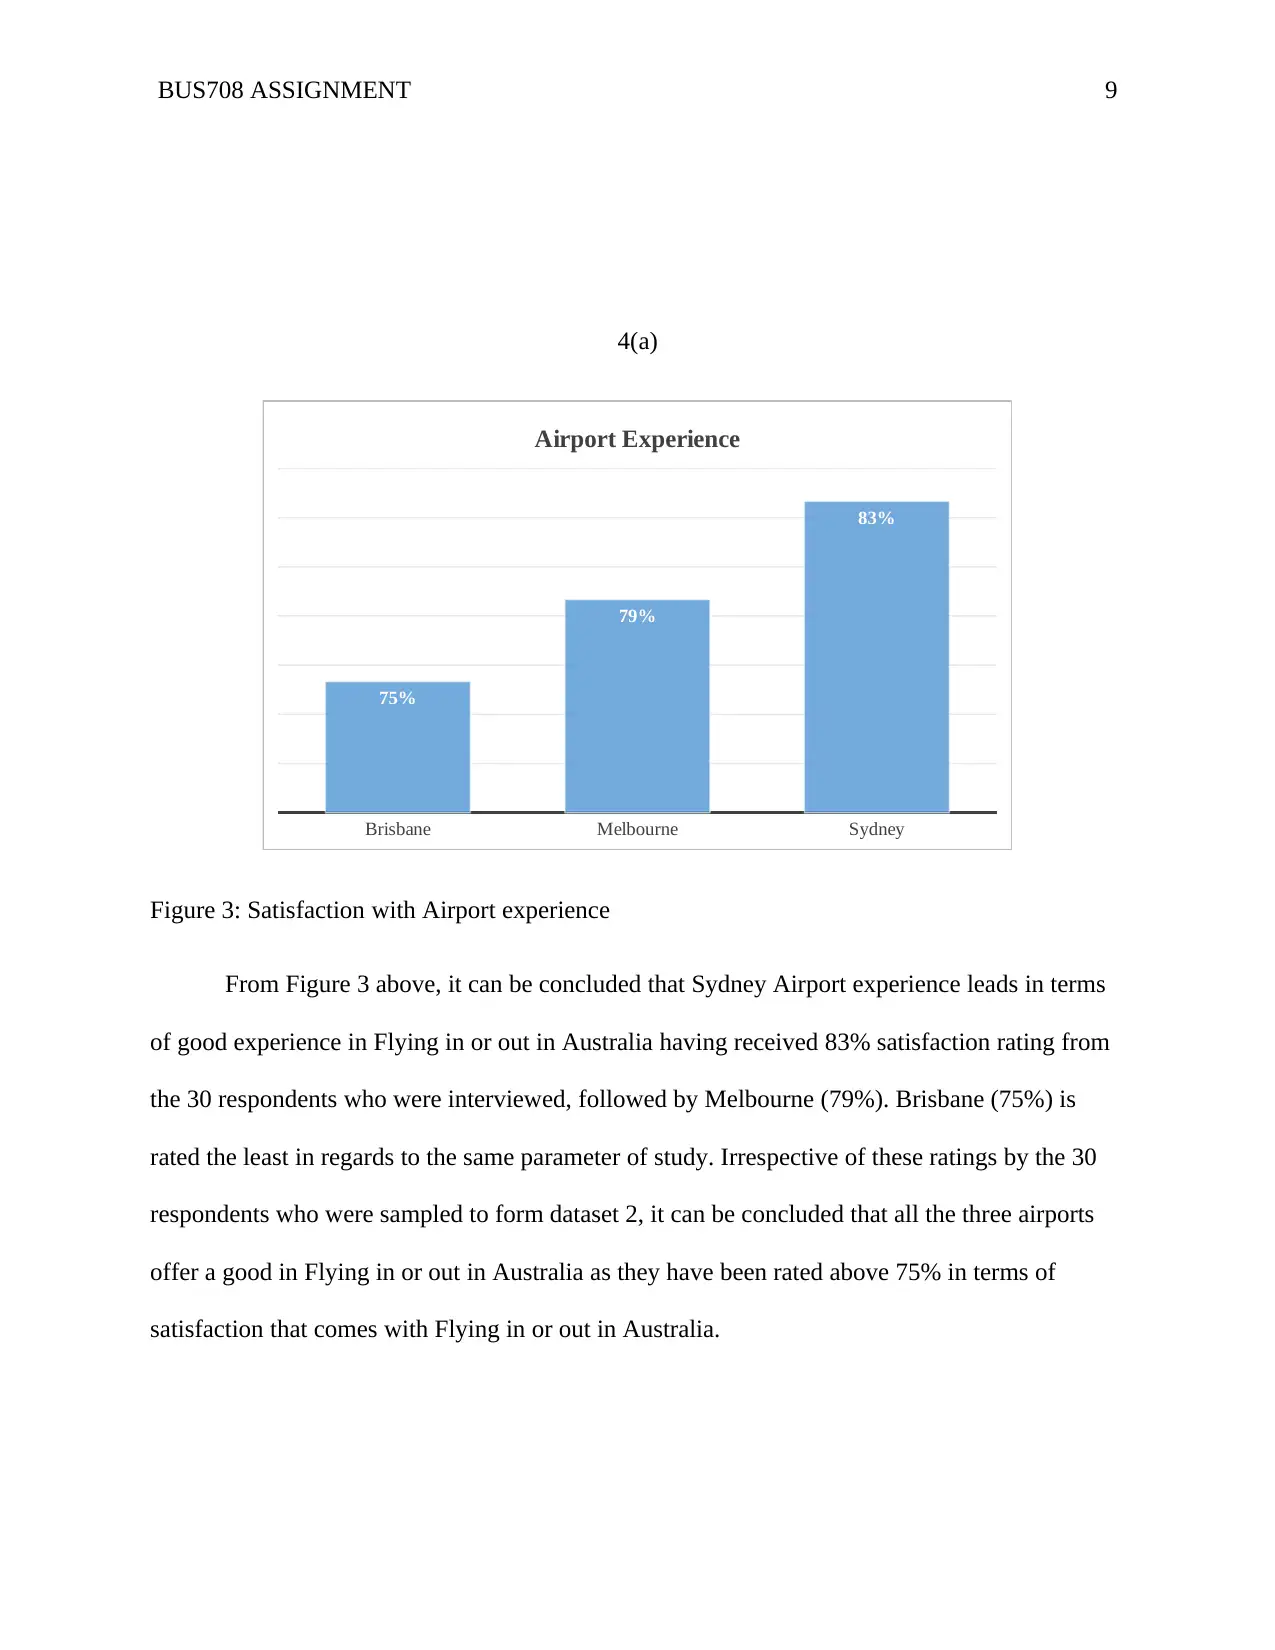
4(a)
Brisbane Melbourne Sydney
75%
79%
83%
Airport Experience
Figure 3: Satisfaction with Airport experience
From Figure 3 above, it can be concluded that Sydney Airport experience leads in terms
of good experience in Flying in or out in Australia having received 83% satisfaction rating from
the 30 respondents who were interviewed, followed by Melbourne (79%). Brisbane (75%) is
rated the least in regards to the same parameter of study. Irrespective of these ratings by the 30
respondents who were sampled to form dataset 2, it can be concluded that all the three airports
offer a good in Flying in or out in Australia as they have been rated above 75% in terms of
satisfaction that comes with Flying in or out in Australia.
⊘ This is a preview!⊘
Do you want full access?
Subscribe today to unlock all pages.
Trusted by 1+ million students worldwide
BUS708 ASSIGNMENT 10
Q5
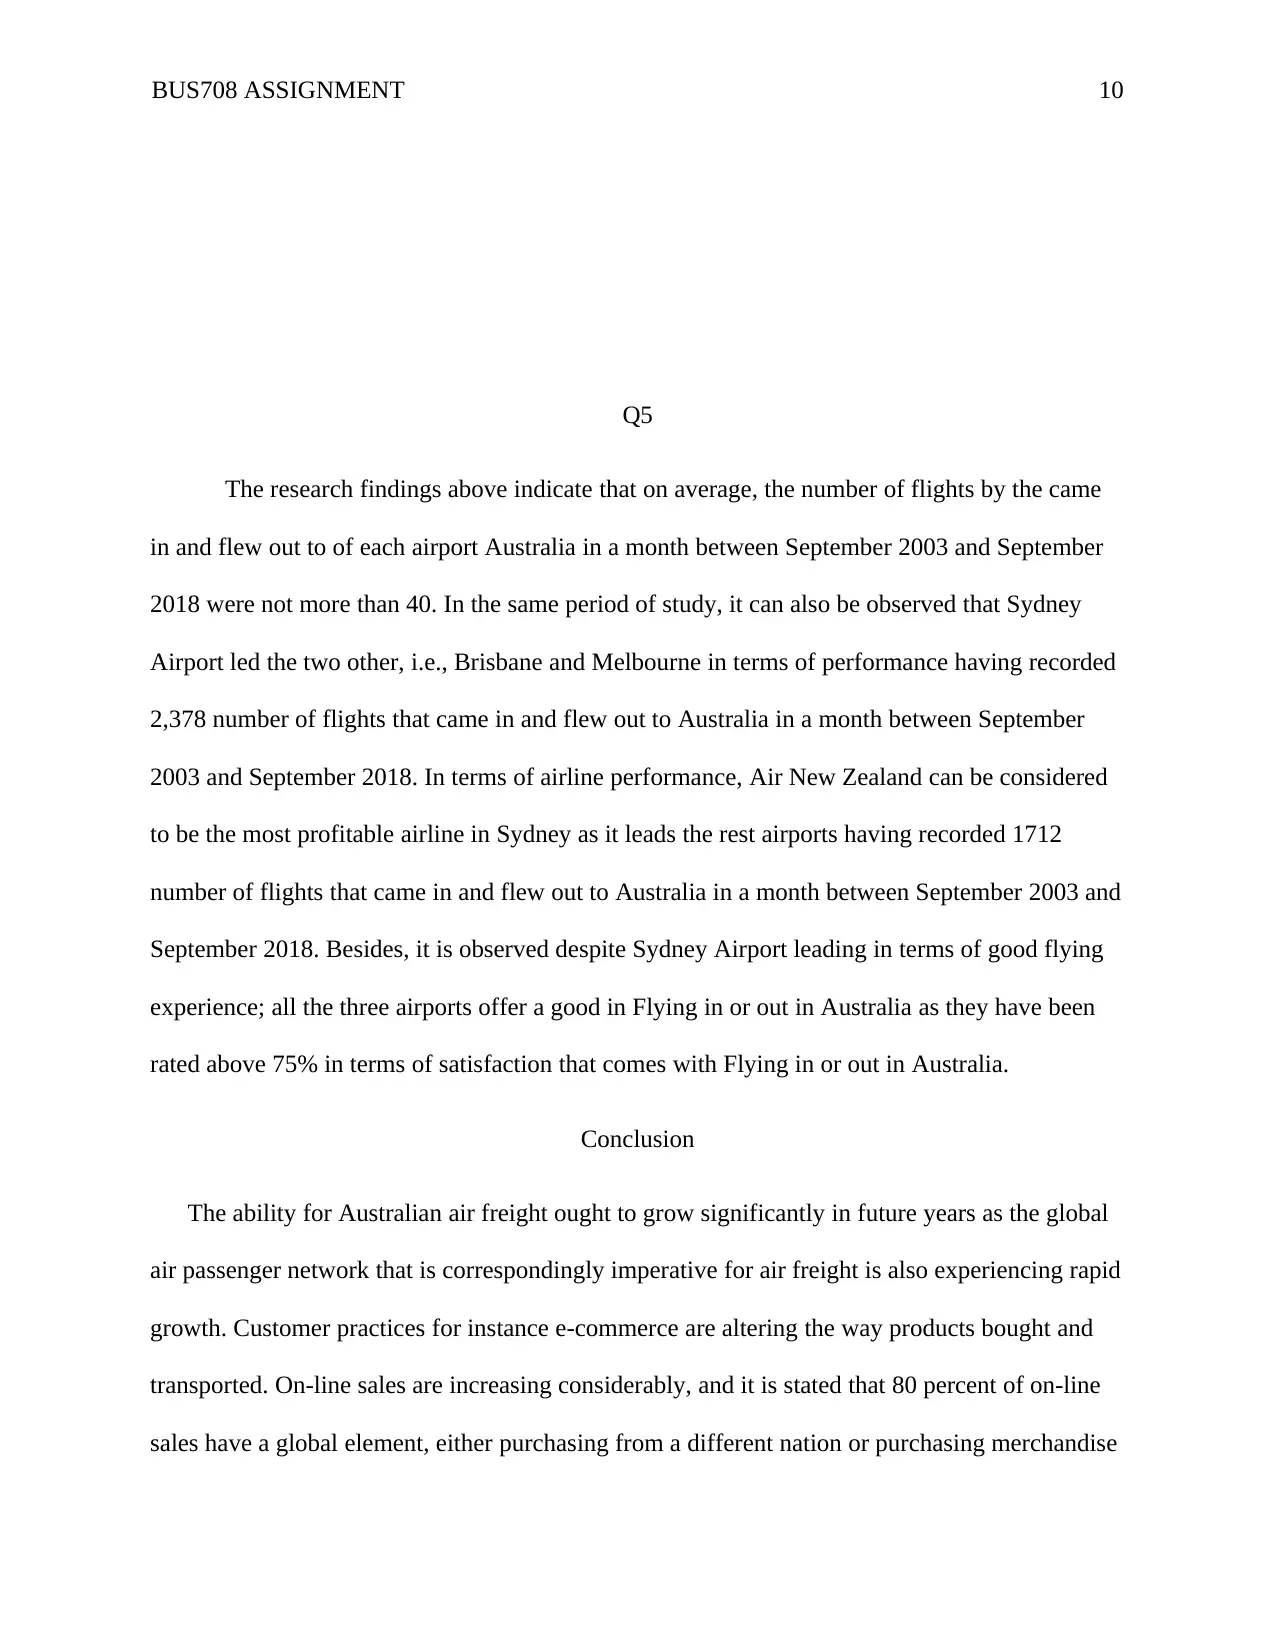
The research findings above indicate that on average, the number of flights by the came
in and flew out to of each airport Australia in a month between September 2003 and September
2018 were not more than 40. In the same period of study, it can also be observed that Sydney
Airport led the two other, i.e., Brisbane and Melbourne in terms of performance having recorded
2,378 number of flights that came in and flew out to Australia in a month between September
2003 and September 2018. In terms of airline performance, Air New Zealand can be considered
to be the most profitable airline in Sydney as it leads the rest airports having recorded 1712
number of flights that came in and flew out to Australia in a month between September 2003 and
September 2018. Besides, it is observed despite Sydney Airport leading in terms of good flying
experience; all the three airports offer a good in Flying in or out in Australia as they have been
rated above 75% in terms of satisfaction that comes with Flying in or out in Australia.
Conclusion
The ability for Australian air freight ought to grow significantly in future years as the global
air passenger network that is correspondingly imperative for air freight is also experiencing rapid
growth. Customer practices for instance e-commerce are altering the way products bought and
transported. On-line sales are increasing considerably, and it is stated that 80 percent of on-line
sales have a global element, either purchasing from a different nation or purchasing merchandise
Q5
The research findings above indicate that on average, the number of flights by the came
in and flew out to of each airport Australia in a month between September 2003 and September
2018 were not more than 40. In the same period of study, it can also be observed that Sydney
Airport led the two other, i.e., Brisbane and Melbourne in terms of performance having recorded
2,378 number of flights that came in and flew out to Australia in a month between September
2003 and September 2018. In terms of airline performance, Air New Zealand can be considered
to be the most profitable airline in Sydney as it leads the rest airports having recorded 1712
number of flights that came in and flew out to Australia in a month between September 2003 and
September 2018. Besides, it is observed despite Sydney Airport leading in terms of good flying
experience; all the three airports offer a good in Flying in or out in Australia as they have been
rated above 75% in terms of satisfaction that comes with Flying in or out in Australia.
Conclusion
The ability for Australian air freight ought to grow significantly in future years as the global
air passenger network that is correspondingly imperative for air freight is also experiencing rapid
growth. Customer practices for instance e-commerce are altering the way products bought and
transported. On-line sales are increasing considerably, and it is stated that 80 percent of on-line
sales have a global element, either purchasing from a different nation or purchasing merchandise
Paraphrase This Document
Need a fresh take? Get an instant paraphrase of this document with our AI Paraphraser
BUS708 ASSIGNMENT 11
that has an international manufacturing process. This trend is likely to adversely affect
productivity in the air freight sector (Australia Aviation Industry not an exemption) unless
carefully managed. As a result, the Australian aviation and airlines industry should pay a key
focus on factors such as the growth in international travel, varying consumer buying preferences,
technological innovation, jet fuel cost and changing security developments to meet emerging
threats which are have been projected to be the main driver in the air freight market. Besides, this
study recommends the following areas, as the possible topics for undertaking future studies:
How does capacity and the types of planes influence air freight market of Australia?
To what extent will the changes in the value, size and weight of consumer goods affect
the air freight market of Australia?
BUS708 ASSIGNMENT 12
Reference
Alexander, D. W., & Merkert, R. (2017). Challenges to domestic air freight in Australia:
Evaluating air traffic markets with gravity modelling. Journal of Air Transport
Management, 61(12), 41-52. doi:10.1016/j.jairtraman.2016.11.008
Farabi, Y. (2012). Analysis of Marketing Environment of Virgin Australia (5th ed.). Munich,
Germany: GRIN Verlag.
Kain J., & Webb R. (2003, June 16). Australian Airline Industry – Parliament of Australia.
Retrieved from
https://www.aph.gov.au/About_Parliament/Parliamentary_Departments/
Parliamentary_Library/pubs/rp/rp0203/03RP10
Kumar, R. (2010). Research Methodology: A Step-by-Step Guide for Beginners (11th ed.).
Thousand Oaks, CA: SAGE.
Olsen, B. C. (2005). The Service Encounter in the Australian Airline Industry: A Critical
Analysis of Passenger Expectations (4th ed.).
Ross, T. (2012). A Survival Guide For Health Research Methods (2nd ed.). Milton Keynes,
United Kingdom: McGraw-Hill Education (UK).
Stopher, P. (2012). Collecting, Managing, and Assessing Data Using Sample Surveys (7th
ed.). Cambridge, England: Cambridge University Press.
⊘ This is a preview!⊘
Do you want full access?
Subscribe today to unlock all pages.
Trusted by 1+ million students worldwide
1 out of 13
Related Documents


Your All-in-One AI-Powered Toolkit for Academic Success.
+13062052269
info@desklib.com
Available 24*7 on WhatsApp / Email
![[object Object]](/_next/static/media/star-bottom.7253800d.svg)
Unlock your academic potential
Copyright © 2020–2026 A2Z Services. All Rights Reserved. Developed and managed by ZUCOL.