BUS708: Airlines Frequencies and Passenger Satisfaction Analysis
VerifiedAdded on 2023/04/23
|10
|2222
|238
Report
AI Summary
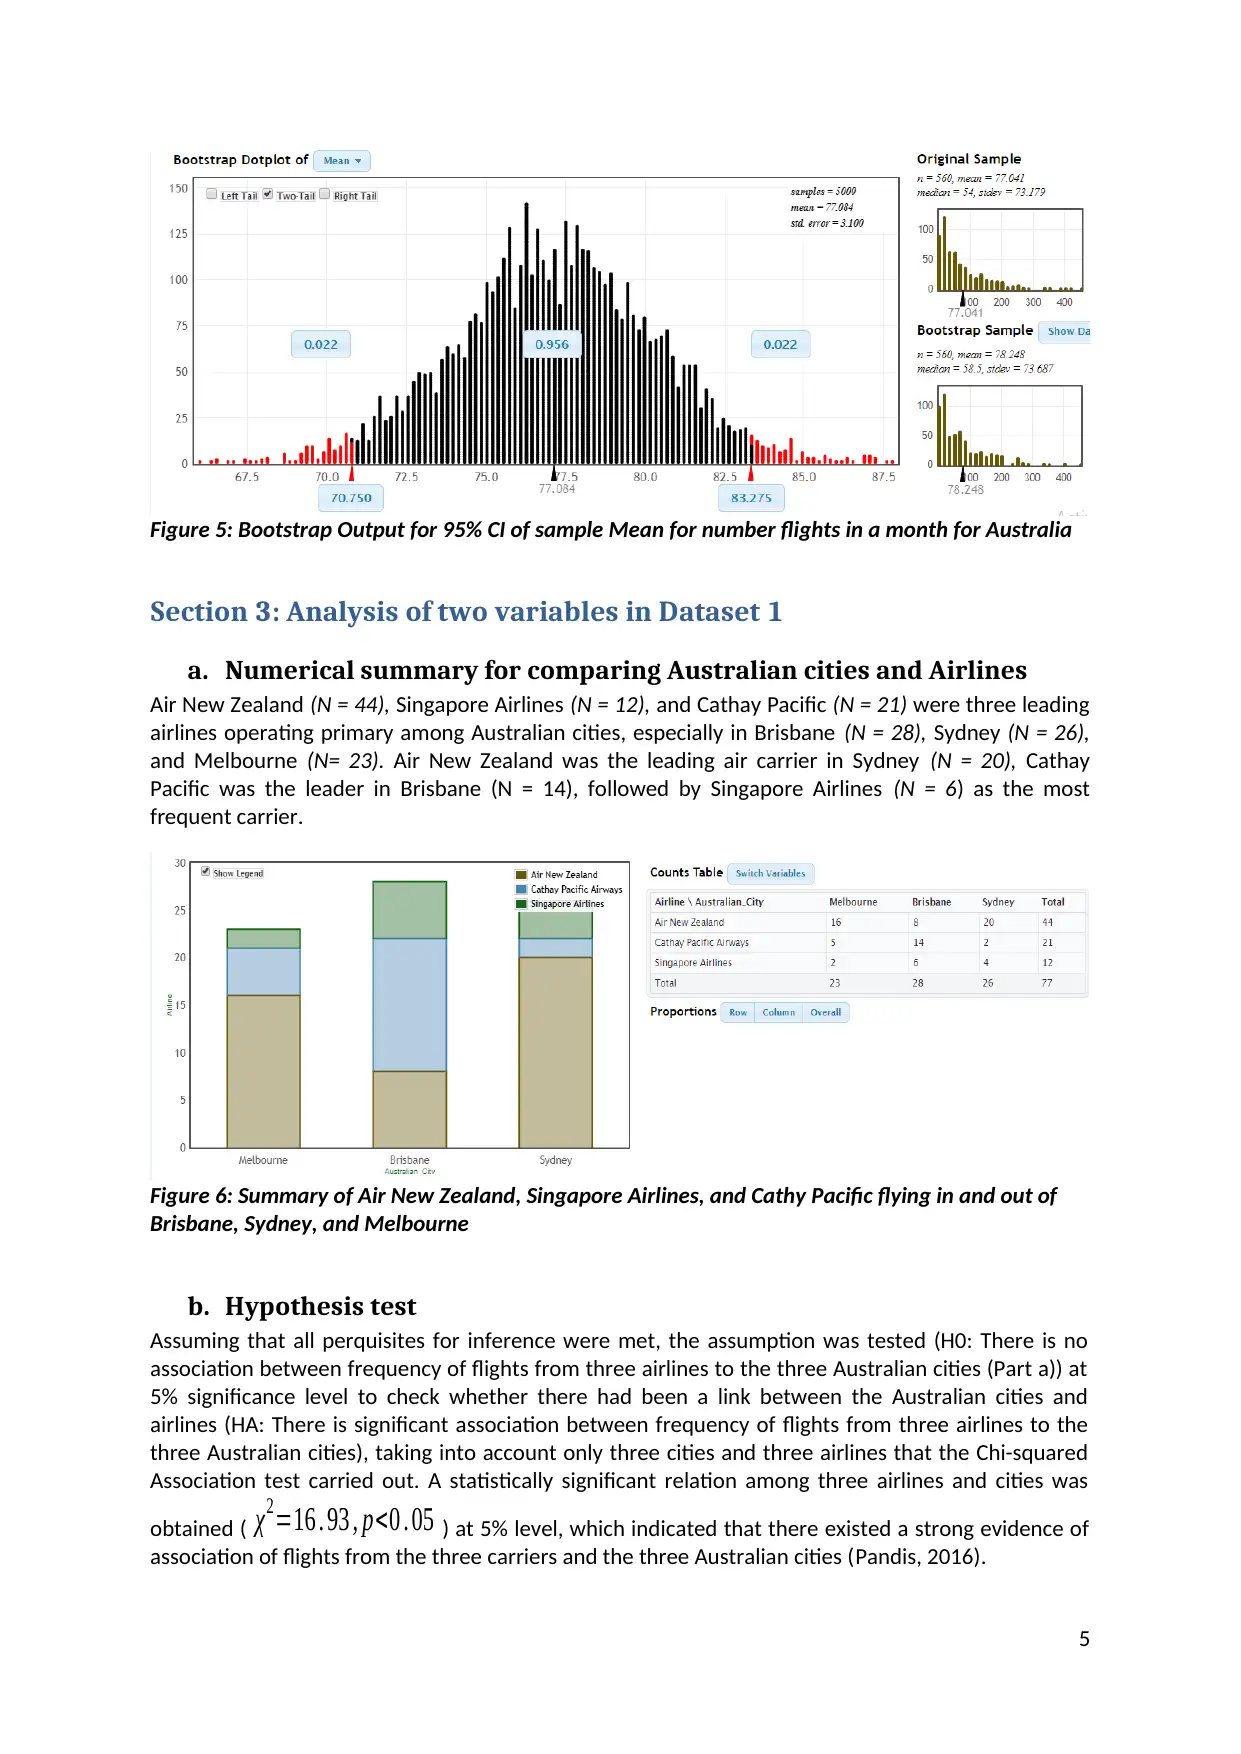
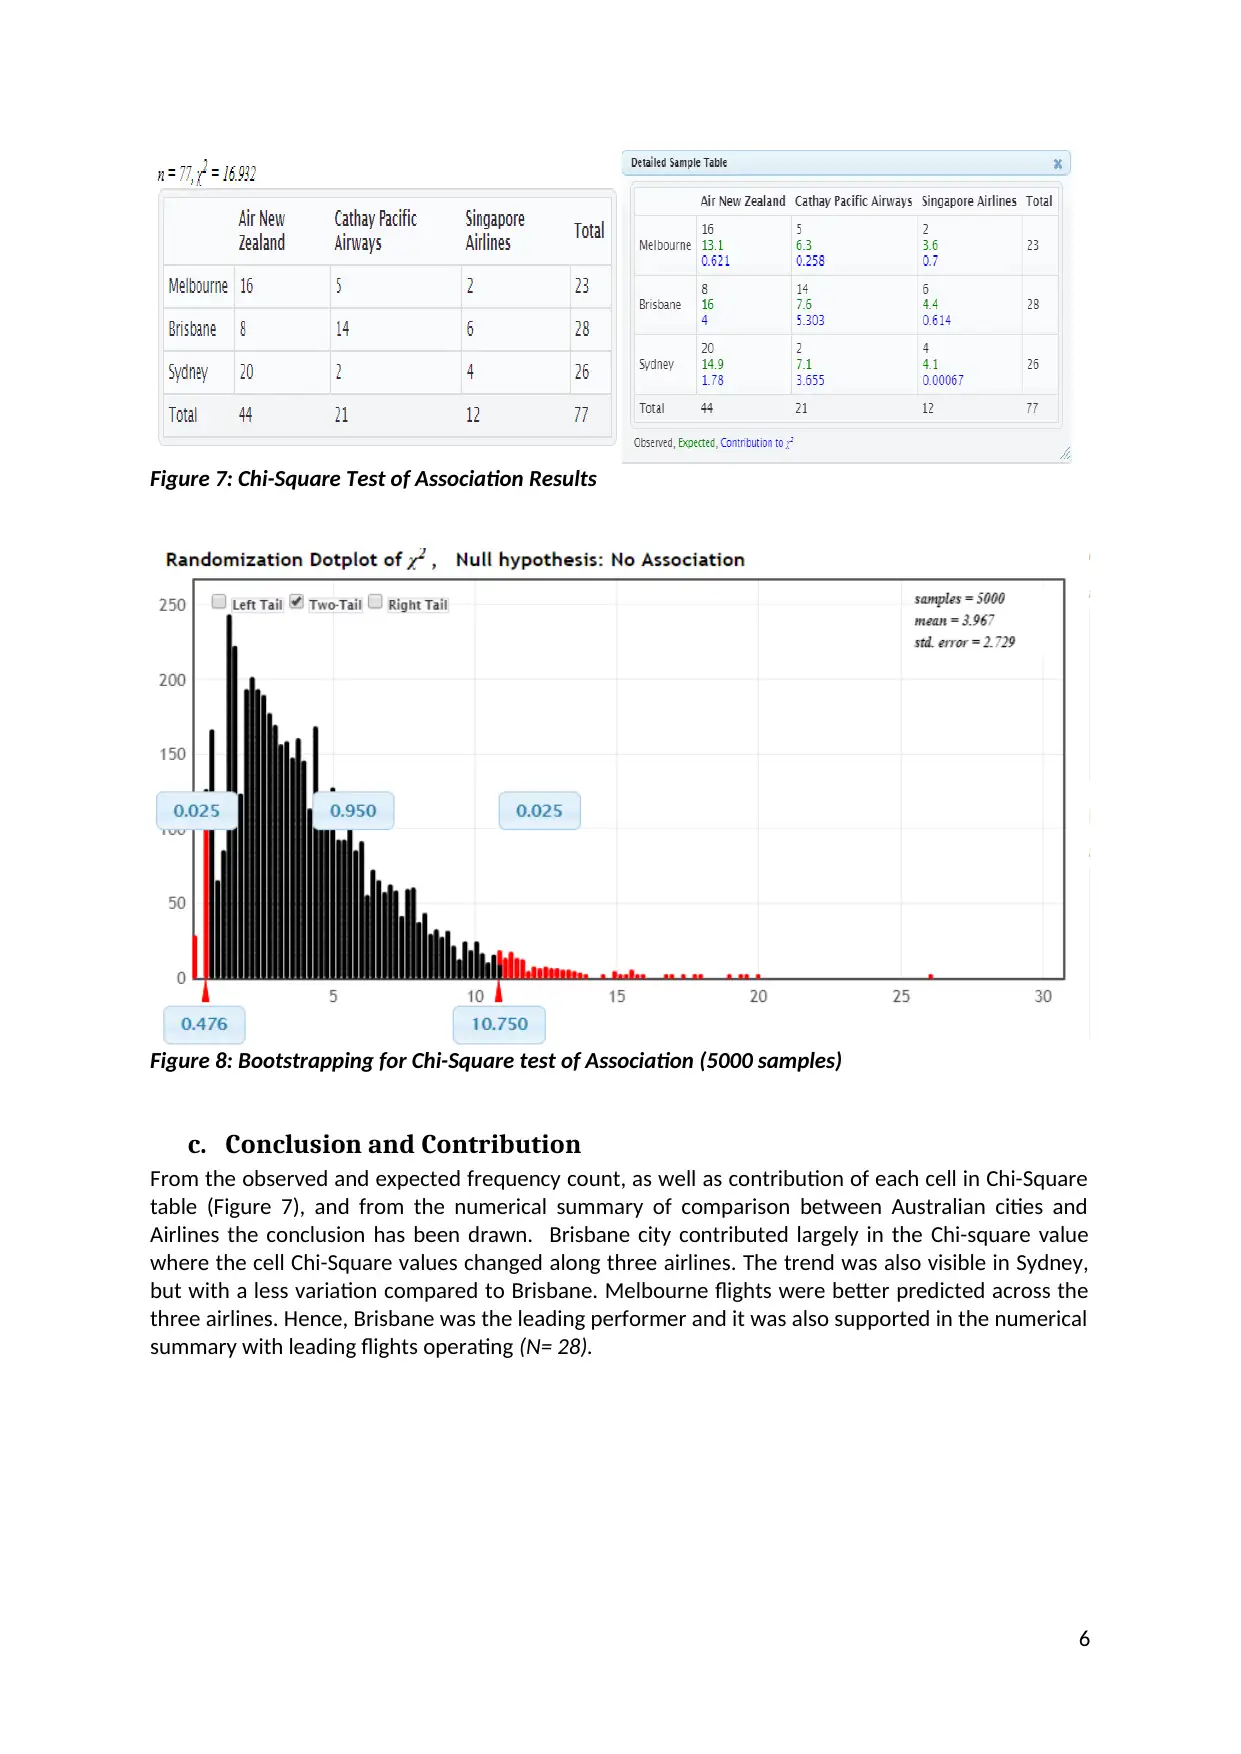
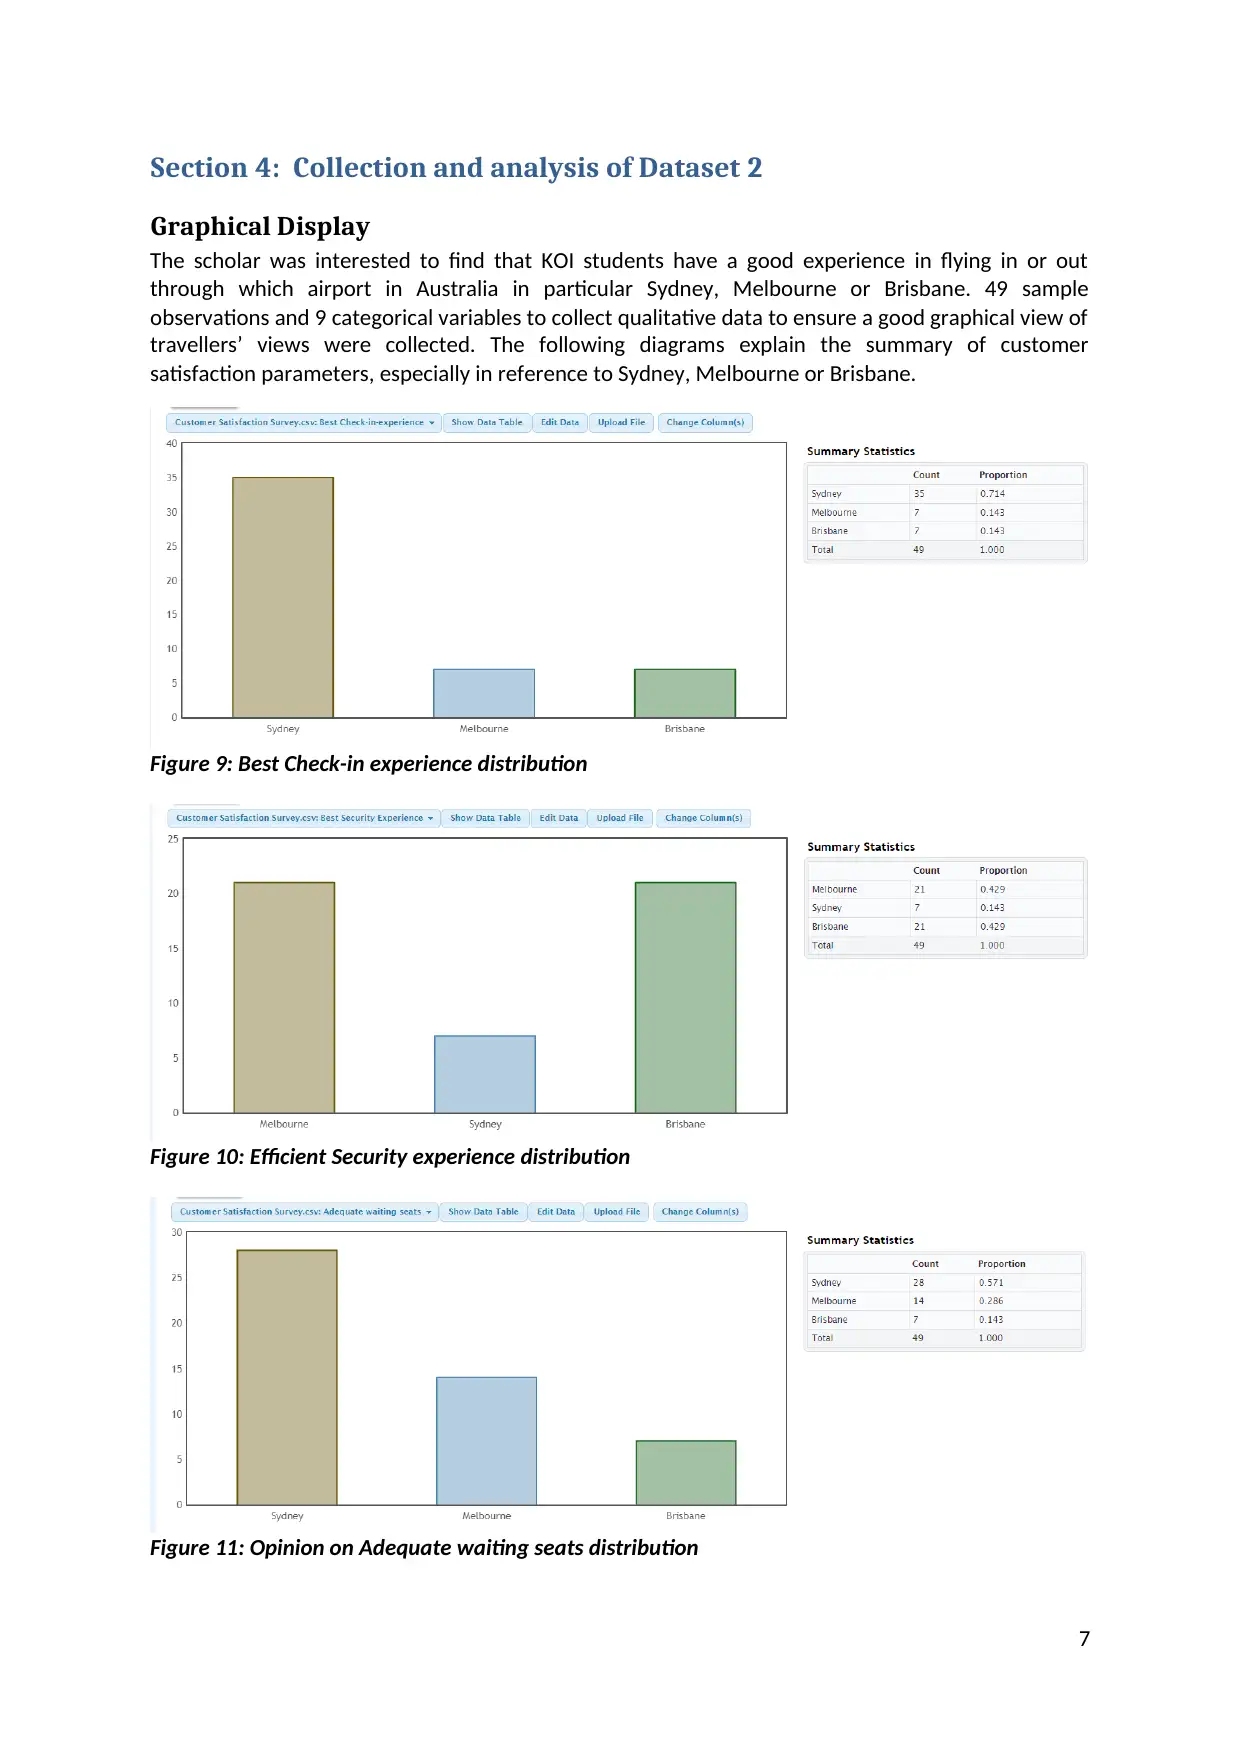
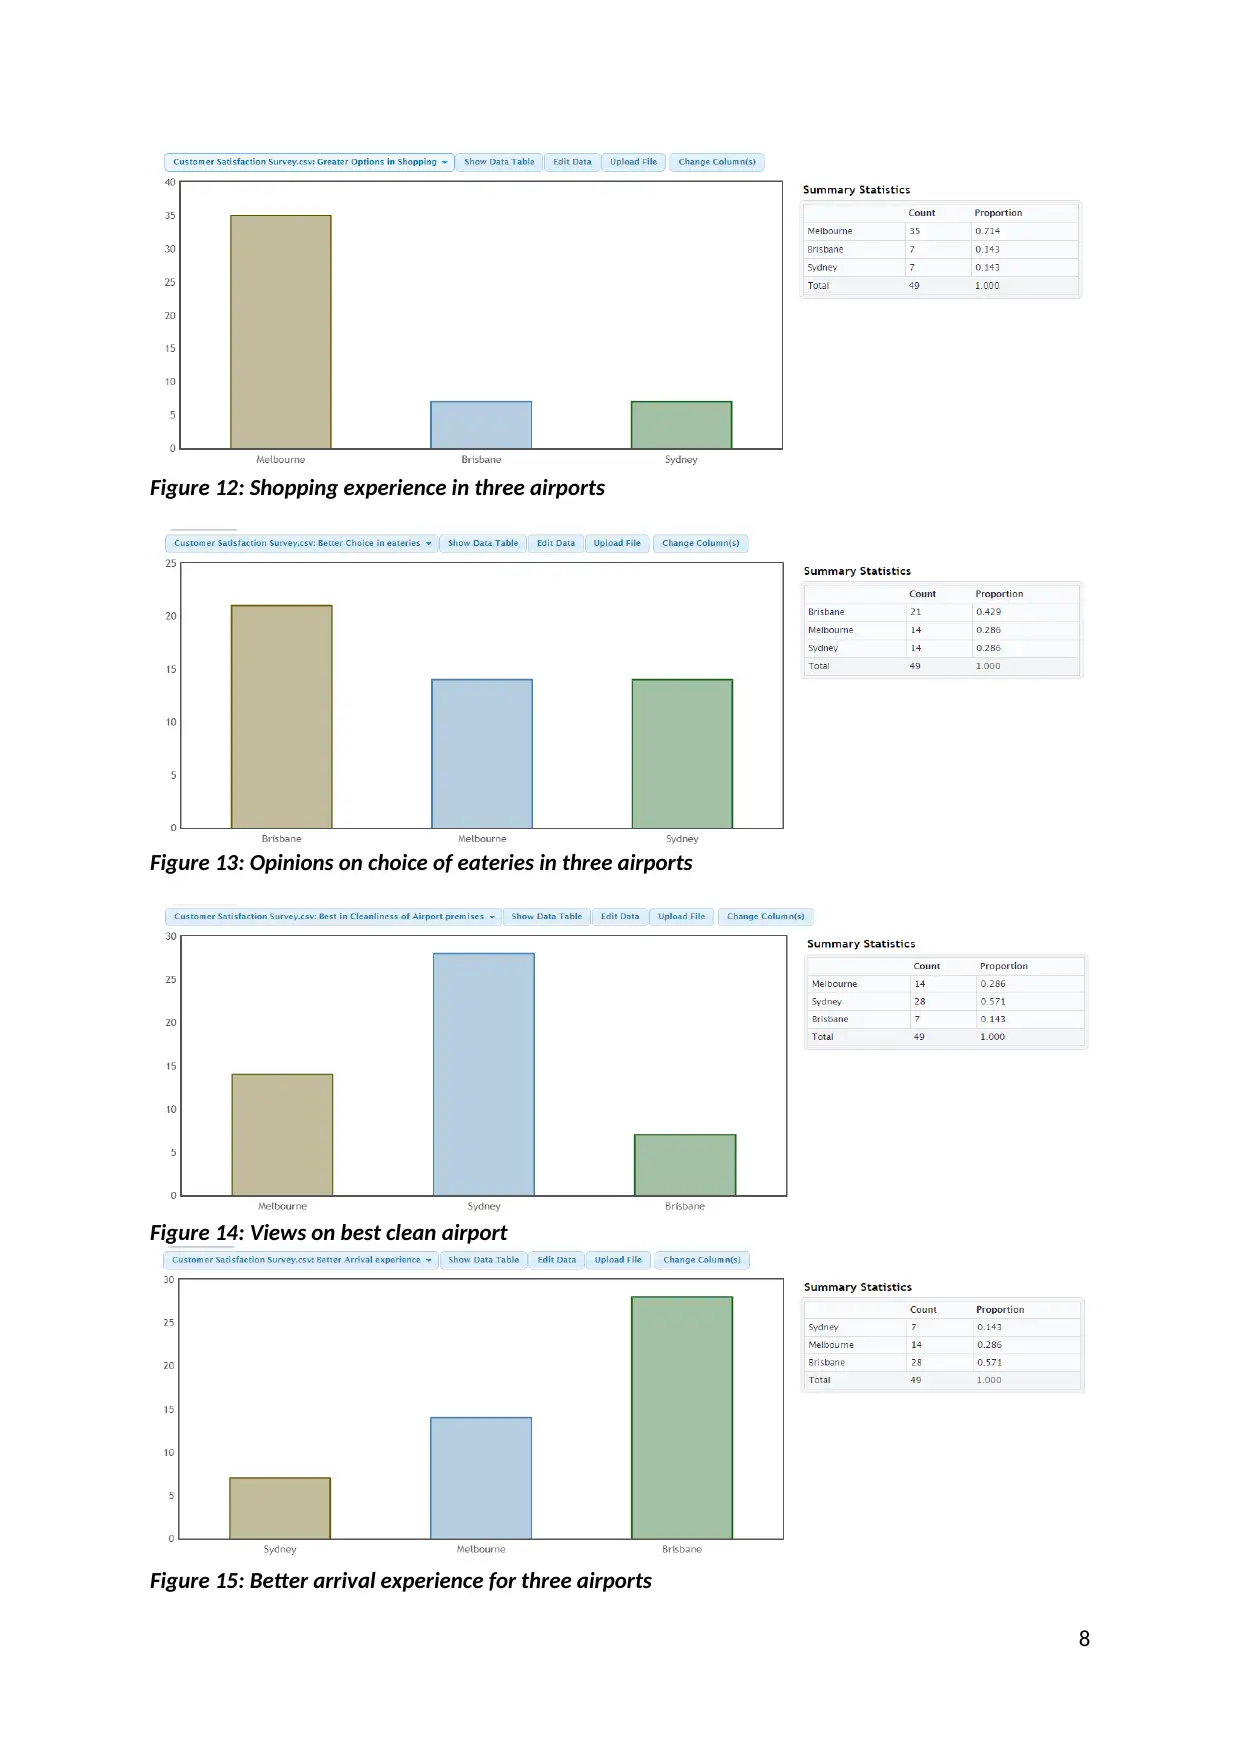
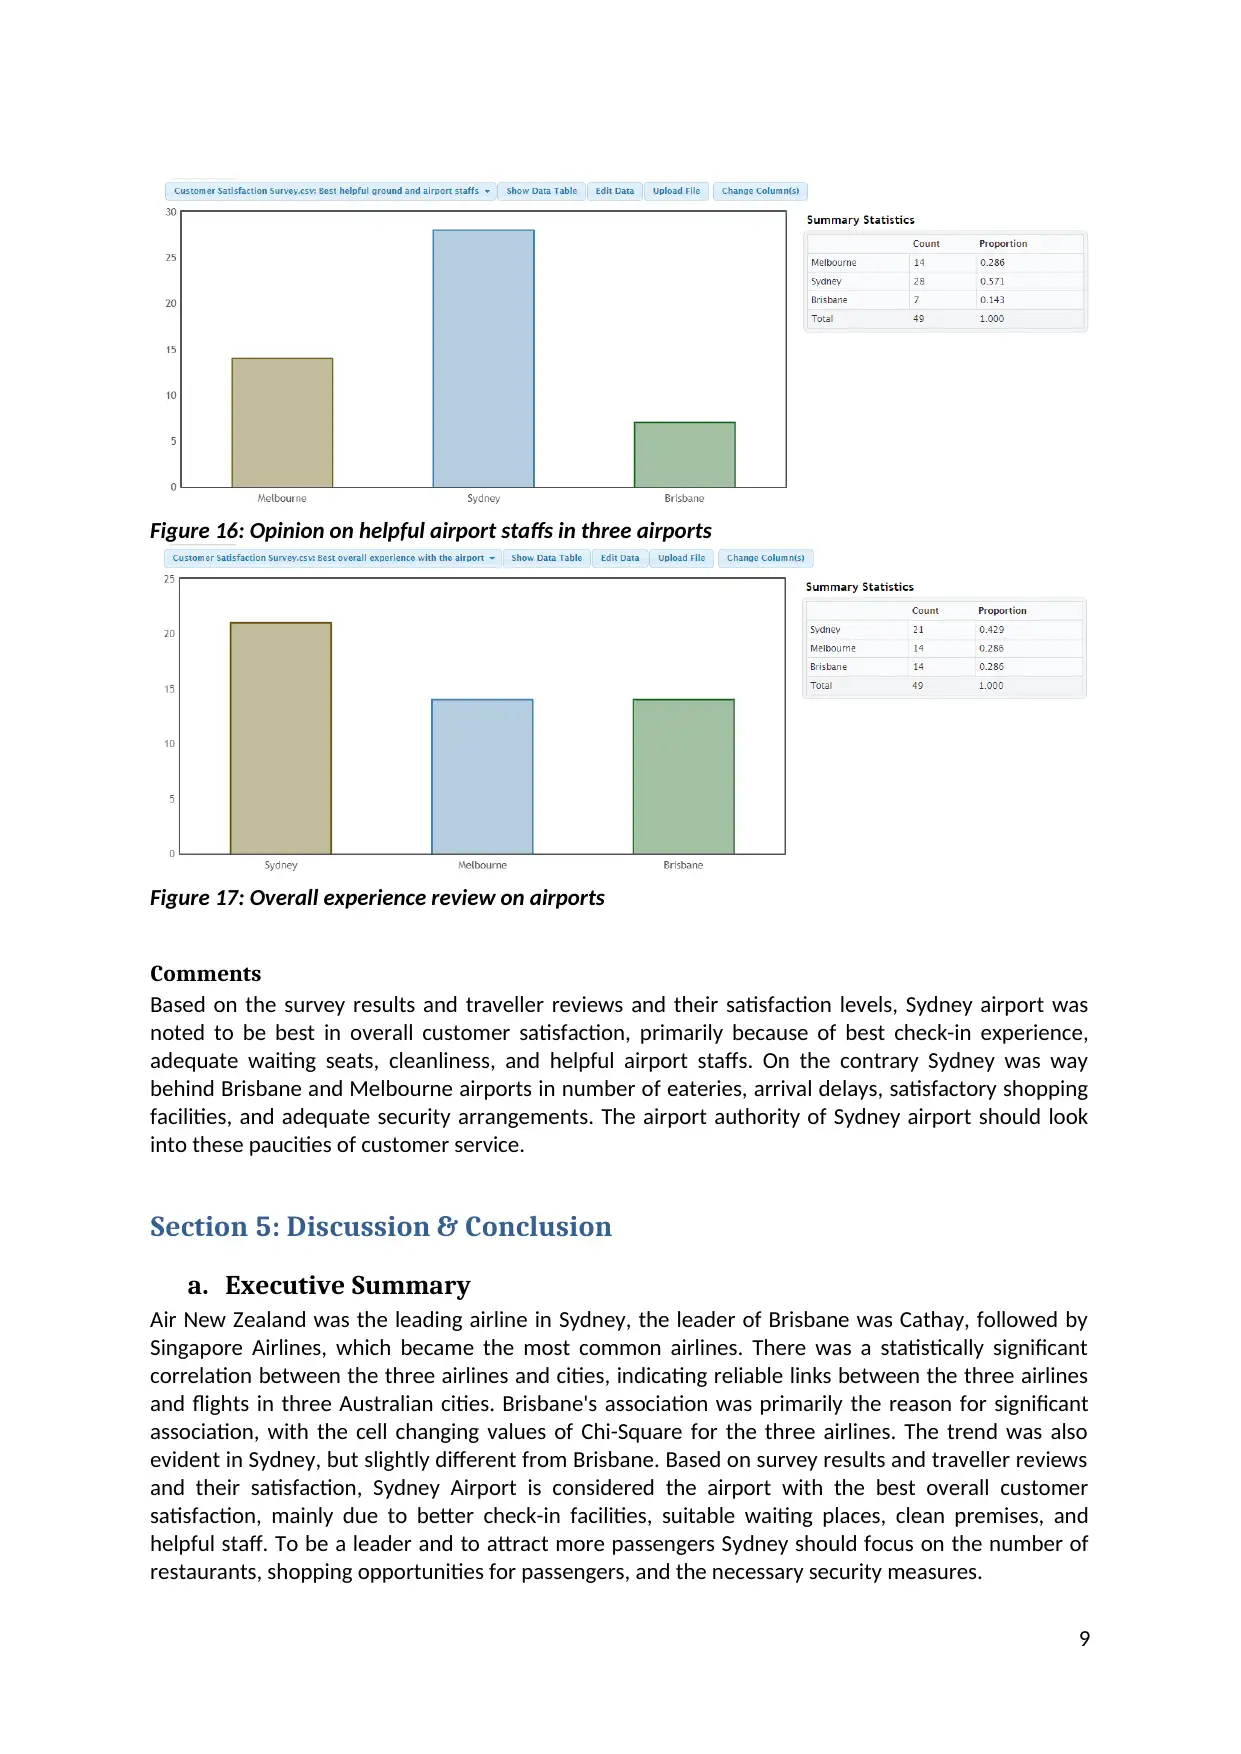
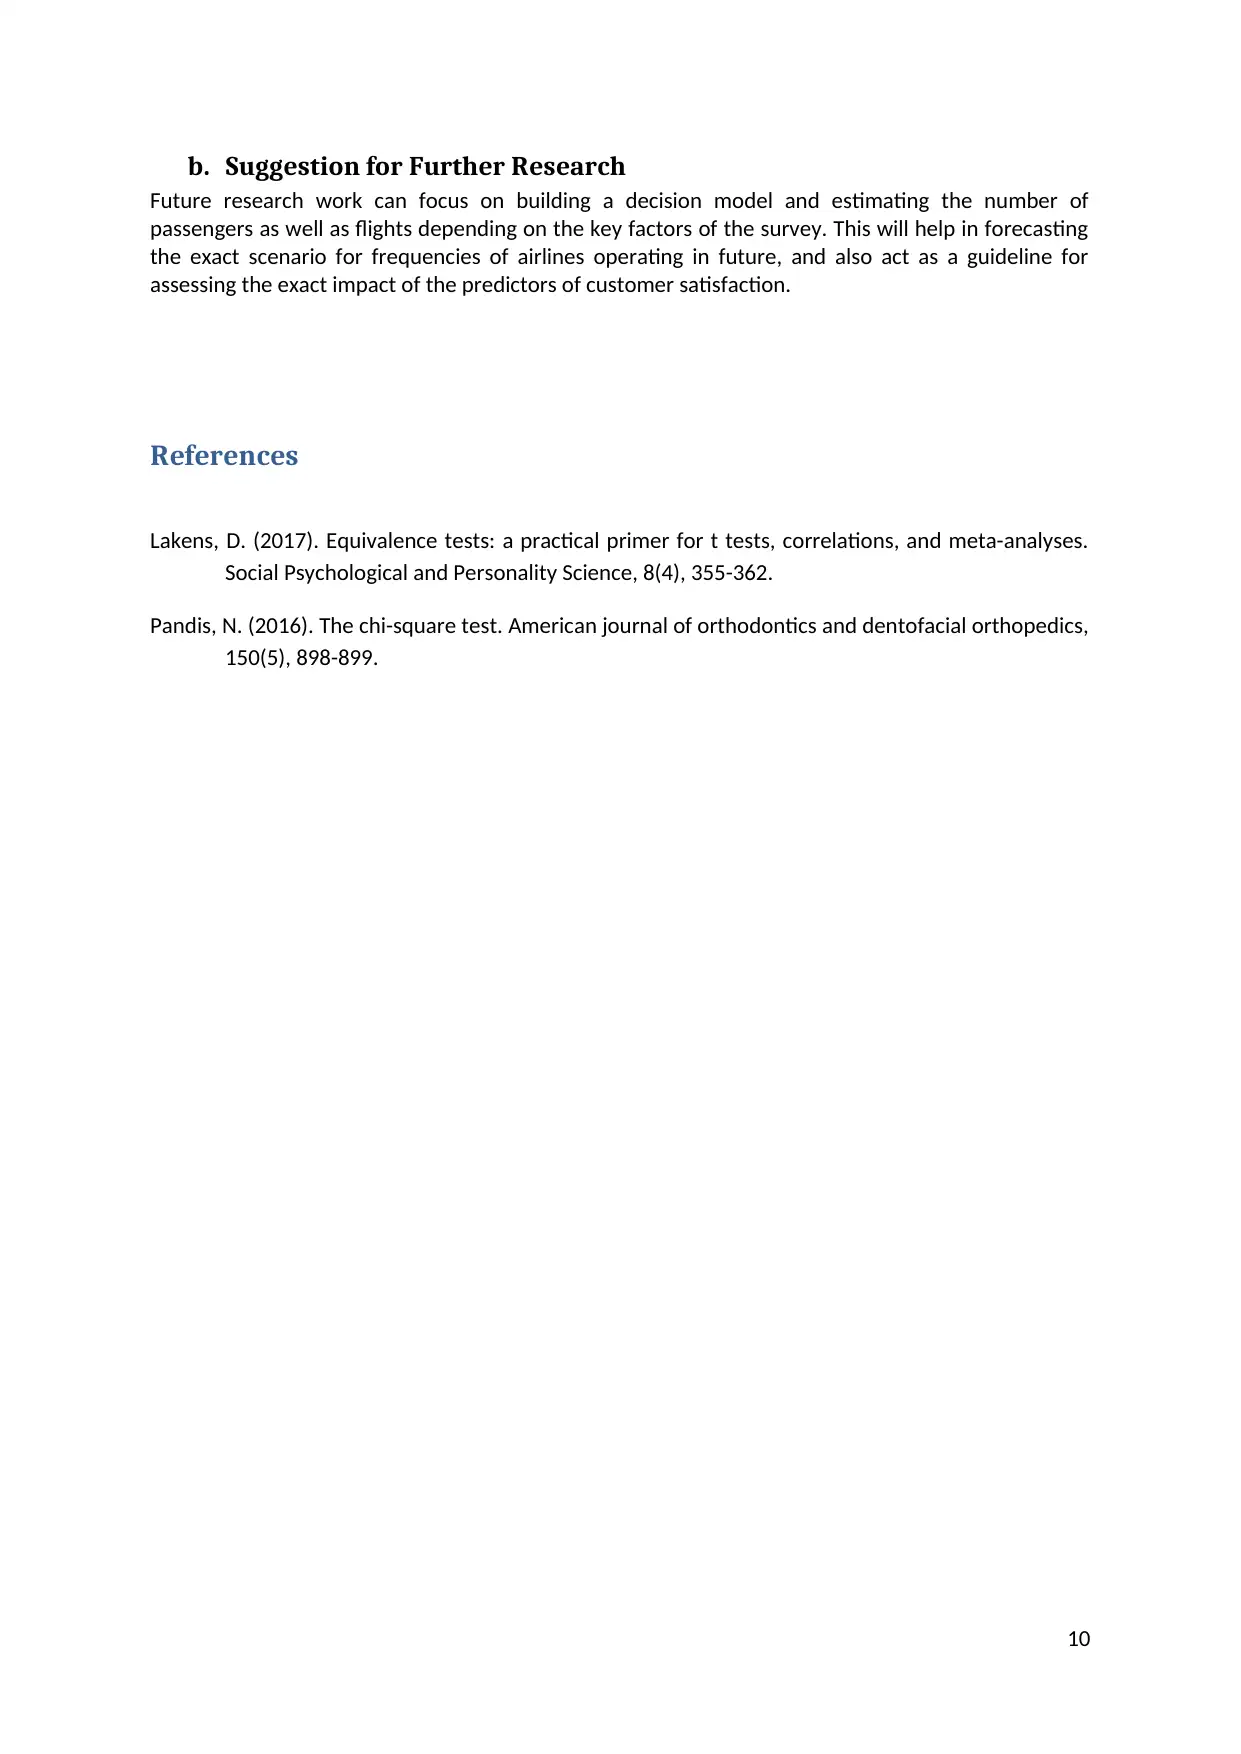
This report evaluates airline frequencies and passenger satisfaction at major Australian international airports in Australia, namely Sydney, Melbourne, and Brisbane. It uses two datasets: one with secondary flight data from 2003-2018 and another from a primary survey of traveler feedback. The analysis of the first dataset reveals that Sydney airport has the highest number of flight routes. Hypothesis testing confirms that the average number of total flights per month in Australia exceeds 30. A Chi-squared test indicates a statistically significant relationship between airlines and cities, with Brisbane showing the most significant variation. The survey data suggests that Sydney airport leads in overall customer satisfaction due to check-in experience, waiting seats, cleanliness, and helpful staff, although it lags in eateries, arrival delays, and shopping facilities. The report concludes with suggestions for further research, including building a decision model to estimate future passenger and flight numbers based on key satisfaction factors. Desklib provides access to similar past papers and solved assignments for students.
Contribute Materials
Your contribution can guide someone’s learning journey. Share your
documents today.

Evaluating Airlines frequencies and Passenger satisfaction of Australian
International Airports (Sydney, Melbourne, and Brisbane)
1
International Airports (Sydney, Melbourne, and Brisbane)
1
Secure Best Marks with AI Grader
Need help grading? Try our AI Grader for instant feedback on your assignments.

Section 1: Introduction
a. Introduction about the Assignment
The development of areas for transit development in the Australian context is hampered by a
number of obstacles. The main challenges to be addressed are the consolidation of the security
around airports and the lack of express check in mechanism to facilitate the overall experience. This
article identifies key factors that contribute to the effective comparison of three major Australian
airports. This article is based on an analysis of case studies in Melbourne, Brisbane, and Sydney.
Based on semi-targeted interviews with the travellers, the framework for commercial planning and
mechanisms to facilitate clean airport premises has been analysed. In addition, the scholar conducts
stakeholder survey to assess the results of the overall implementation process and different
standards. The study found check-in-experience, waiting facilities, options in Shopping, choices in
eateries, cleanliness of airport premises, and helpful airport staffs to be the deciding factors of
overall experience with the airport. Sydney airport was found to be the leading airport from
customer review, with maximum number of traffic.
b. Dataset 1: Short Description
The first data set consisted of the secondary information on flights from 73 airlines flying in and out
within a period of 2003 September to 2018 September for 12 Australian airports. Eight more
nominal variables were used to describe Australian city (airport), International Destination City,
Airline Route, Port Country, Port Region, Service Country, and Service Region. Three numerical
variables were used to define number of Stops, total Flights in every route, and Maximum number of
Seats in a route. The dataset was used to scrutinize the average number of flights flying in and out of
Australia. Also, flight frequency in Melbourne, Brisbane, and Sydney airports were compared for Air
New Zealand, Singapore Airlines, and Cathy Pacific Airways carriers.
c. Dataset 2: Collection of Data its Limitation
An online survey was conducted to collect primary data on travellers’ feedback about overall
satisfaction in Melbourne, Brisbane, and Sydney airports. The survey was conducted in convenience
sampling methodology with a cross-sectional approach. Choice of convenience sampling technique
generated a probable bias due to exclusion of all stakeholders in the response of 50 travellers. 15
categorical variables and one continuous variable (Number of passengers travelling) were used to
describe the dataset. The best airport was chosen based on check-in-experiences, adequate waiting
seats, options in shopping, cleanliness of Airport premises, arrival experience, and ground staffs’
behaviour.
Section 2: Analysis of single variable in Dataset 1
a. Shape of the Distribution
From Figure 1, distribution of the “All flights” variable was identified to be highly right skewed (S =
2.27) due to presence of outlier observations, which indicated heavy traffic at few airports in certain
months. From Figure 2, Sydney airport was found to be the busiest airport with 381 flight routes
(FR), followed by Melbourne (FR = 212) and Brisbane (FR = 187). Presence of outliers in the
distribution was the primary reason for a high standard deviation, where the range of the variable
varied from a single flight to 151 flights operating on a certain route.
2

Figure 1: Histogram for "All Flights" Variable
Figure 2: Histogram for "All flights" based on Australian Cities
“All Flights” was the number of flights operating in a certain month of a year on a particular air
route. The average number of flights operating in a month on a certain route for the time period of
2003 September to 2018 September was 24.53 (SD = 19.97). The scholar also wanted to find the
average number of flights operating in a month from a particular airport, as well as overall average
number of flights operating in a month in Australia. From Figure 4, average number of flights
operating for a particular Australian city was found to be 43.79 (SD = 38.46), and from Figure 5 the
overall average for flights coming in and flying out was noted to be 150.47 (SD = 82.70).
b. Average Number of total flights came in and flew out to Australia in a Month
Total number of total flights per city from 2003 (Sep) to 2018 (Sep) was found to be right skewed
with presence of numerous outlier observations. Due to sample size (n > 30) of 560 (city/month),
using Central Limit Theorem the variable was assumed to follow a normal distribution. Flights
operated between an Australian city and an International city. Hence the observations were random
and independent in nature.
3

Now the answer to the question of whether the average total flights (In and Out) from September
2003 to September 2018 were over 30 flights to Australia, the scholar approached the problem from
two angles.
Figure 3: Box Plot of flights in a month from a particular city
First, it was hypothesized that average number of total flights per city in the time frame of research
was less or equal to 30 (H0: μ≤30 ), and it was scrutinized against the right tail alternate
hypothesis, whether average total flights per city was greater than 30 (HA: μ>30 ) . A 95%
confidence interval from ‘Statkey’ software using 5000 sample simulation was obtained from
population Mean (Figure 4: Sample mean was in the rejection region). The results were confirmed by
a one sample t-test (t = 8.49, p < 0.05), and a strong statistical evidence was found to reject the null
hypothesis at 5% level.
Figure 4: Bootstrap Output for 95% CI of sample Mean for number flights in a month for a city
Secondly, it was hypothesized that average number of total flights per month in Australia in the time
frame of research was less or equal to 30 (H0: μ≤30 ), and it was scrutinized against the right tail
alternate hypothesis, whether average total flights per city was greater than 30 (HA: μ>30 ) . A 95%
confidence interval from ‘Statkey’ software using 5000 sample simulation was obtained from
population Mean (Figure 5: Sample mean was in the rejection region). The results were confirmed by
a one sample t-test (t = 18.60, p < 0.05), and a strong statistical evidence was found to reject the null
hypothesis at 5% level (Lakens, 2017).
4
Secure Best Marks with AI Grader
Need help grading? Try our AI Grader for instant feedback on your assignments.

Figure 5: Bootstrap Output for 95% CI of sample Mean for number flights in a month for Australia
Section 3: Analysis of two variables in Dataset 1
a. Numerical summary for comparing Australian cities and Airlines
Air New Zealand (N = 44), Singapore Airlines (N = 12), and Cathay Pacific (N = 21) were three leading
airlines operating primary among Australian cities, especially in Brisbane (N = 28), Sydney (N = 26),
and Melbourne (N= 23). Air New Zealand was the leading air carrier in Sydney (N = 20), Cathay
Pacific was the leader in Brisbane (N = 14), followed by Singapore Airlines (N = 6) as the most
frequent carrier.
Figure 6: Summary of Air New Zealand, Singapore Airlines, and Cathy Pacific flying in and out of
Brisbane, Sydney, and Melbourne
b. Hypothesis test
Assuming that all perquisites for inference were met, the assumption was tested (H0: There is no
association between frequency of flights from three airlines to the three Australian cities (Part a)) at
5% significance level to check whether there had been a link between the Australian cities and
airlines (HA: There is significant association between frequency of flights from three airlines to the
three Australian cities), taking into account only three cities and three airlines that the Chi-squared
Association test carried out. A statistically significant relation among three airlines and cities was
obtained ( χ2=16 . 93 , p<0 . 05 ) at 5% level, which indicated that there existed a strong evidence of
association of flights from the three carriers and the three Australian cities (Pandis, 2016).
5

Figure 7: Chi-Square Test of Association Results
Figure 8: Bootstrapping for Chi-Square test of Association (5000 samples)
c. Conclusion and Contribution
From the observed and expected frequency count, as well as contribution of each cell in Chi-Square
table (Figure 7), and from the numerical summary of comparison between Australian cities and
Airlines the conclusion has been drawn. Brisbane city contributed largely in the Chi-square value
where the cell Chi-Square values changed along three airlines. The trend was also visible in Sydney,
but with a less variation compared to Brisbane. Melbourne flights were better predicted across the
three airlines. Hence, Brisbane was the leading performer and it was also supported in the numerical
summary with leading flights operating (N= 28).
6

Section 4: Collection and analysis of Dataset 2
Graphical Display
The scholar was interested to find that KOI students have a good experience in flying in or out
through which airport in Australia in particular Sydney, Melbourne or Brisbane. 49 sample
observations and 9 categorical variables to collect qualitative data to ensure a good graphical view of
travellers’ views were collected. The following diagrams explain the summary of customer
satisfaction parameters, especially in reference to Sydney, Melbourne or Brisbane.
Figure 9: Best Check-in experience distribution
Figure 10: Efficient Security experience distribution
Figure 11: Opinion on Adequate waiting seats distribution
7
Paraphrase This Document
Need a fresh take? Get an instant paraphrase of this document with our AI Paraphraser

Figure 12: Shopping experience in three airports
Figure 13: Opinions on choice of eateries in three airports
Figure 14: Views on best clean airport
Figure 15: Better arrival experience for three airports
8
Figure 13: Opinions on choice of eateries in three airports
Figure 14: Views on best clean airport
Figure 15: Better arrival experience for three airports
8

Figure 16: Opinion on helpful airport staffs in three airports
Figure 17: Overall experience review on airports
Comments
Based on the survey results and traveller reviews and their satisfaction levels, Sydney airport was
noted to be best in overall customer satisfaction, primarily because of best check-in experience,
adequate waiting seats, cleanliness, and helpful airport staffs. On the contrary Sydney was way
behind Brisbane and Melbourne airports in number of eateries, arrival delays, satisfactory shopping
facilities, and adequate security arrangements. The airport authority of Sydney airport should look
into these paucities of customer service.
Section 5: Discussion & Conclusion
a. Executive Summary
Air New Zealand was the leading airline in Sydney, the leader of Brisbane was Cathay, followed by
Singapore Airlines, which became the most common airlines. There was a statistically significant
correlation between the three airlines and cities, indicating reliable links between the three airlines
and flights in three Australian cities. Brisbane's association was primarily the reason for significant
association, with the cell changing values of Chi-Square for the three airlines. The trend was also
evident in Sydney, but slightly different from Brisbane. Based on survey results and traveller reviews
and their satisfaction, Sydney Airport is considered the airport with the best overall customer
satisfaction, mainly due to better check-in facilities, suitable waiting places, clean premises, and
helpful staff. To be a leader and to attract more passengers Sydney should focus on the number of
restaurants, shopping opportunities for passengers, and the necessary security measures.
9

b. Suggestion for Further Research
Future research work can focus on building a decision model and estimating the number of
passengers as well as flights depending on the key factors of the survey. This will help in forecasting
the exact scenario for frequencies of airlines operating in future, and also act as a guideline for
assessing the exact impact of the predictors of customer satisfaction.
References
Lakens, D. (2017). Equivalence tests: a practical primer for t tests, correlations, and meta-analyses.
Social Psychological and Personality Science, 8(4), 355-362.
Pandis, N. (2016). The chi-square test. American journal of orthodontics and dentofacial orthopedics,
150(5), 898-899.
10
1 out of 10
Related Documents

Your All-in-One AI-Powered Toolkit for Academic Success.
+13062052269
info@desklib.com
Available 24*7 on WhatsApp / Email
Unlock your academic potential
© 2024 | Zucol Services PVT LTD | All rights reserved.