BUS708 Statistics and Data Analysis Report: Fuel Price Analysis
VerifiedAdded on 2023/01/04
|11
|2432
|54
Report
AI Summary
This report presents a statistical analysis of fuel prices, comparing different brands in Australia using data from 1000 service stations across various suburbs. The study employs descriptive statistics to analyze petrol prices, including measures of central tendency (mean, median, mode) and dispersion (variance, standard deviation). Hypothesis testing is used to determine if the average petrol price in September 2016 was less than or equal to 115 Australian cents. Additionally, the report analyzes student preferences for petrol stations, based on a sample of 30 students from KOI, revealing the most popular brands. The findings include price comparisons, brand preferences, and statistical inferences, providing valuable insights into the fuel market.
Statistics
Statistics and data analysis
Student name:
Tutor name:
1 | P a g e
Statistics and data analysis
Student name:
Tutor name:
1 | P a g e
Paraphrase This Document
Need a fresh take? Get an instant paraphrase of this document with our AI Paraphraser
Statistics
Executive summary
The objective of this research was to compare the fuel prices among different brands in
Australia. A list of 1000 stations from different suburbs was involved in the sample and the price
of petrol in brands in those suburbs recorded. Various variables were involved but the most
important ones were the brand and the price of petrol. The other variables were the suburb that
represents the town where the brand is located while the brand represents the company that is
selling the fuel. Descriptive statistics was used to describe the data. Measures of central tendency
such as the mean, median and modal petrol price were calculated and found to be 123.03, 122.15
and 119.9 respectively. Measures of dispersion such as variance and standard deviation for the
petrol price were also calculated and found to be 173.39 and 13.16 respectively. The minimum
and the maximum prices were 56.9 and 185.6 respectively. The research study tested the
hypothesis that the petrol prices in service stations in September 2016 were less than 115. The
research found that there was no sufficient evidence to support the claim hence it was concluded
that the average price of petrol in all service stations in September 2016 is less than or equal to
115 Australian cents. The research also had another dataset showing the preferred stations for the
students. A sample of 30 students from KOI was sampled using simple random sampling and
asked about their preferred petrol stations. 10 students representing 33.3% preferred buying fuel
from Caltex. 7 students preferred buying the fuel from Caltex Woolworths representing 23.3%. 4
students representing 13.3% preferred buying from 7-Eleven. 3 students preferred BP and Coles
Express representing 10% each. 2 students preferred United representing 6.7%. 1 student
preferred Speedway representing 3.3%.
2 | P a g e
Statistics
Introduction
Fuel prices have been a subject of discussion in the recent years. The prices have been staggering
due to the price of crude oil which is dictated by the oil producing and exporting countries
(Giradi 2012) and (Elliot 2015). This is coupled again by the rate at which the dollar is trading in
these particular countries. In various local countries, the cost of the final product which is fuel is
further escalated due to various factors such as cost of importation and proximity to the port of
entry (Williams 2011). Towns and cities which are near the pipeline buy the fuel at a little lower
rate per litter than those that are far away from the pipelines (Kraus 2017). Suburbs in Australia
have also been facing fluctuation of fuel prices due to the factors mentioned above. For that
reason different towns and brands have been selling fuel at different costs per litter.
According to weekly global fuel prices review (May 7, 2019) (www.globalpetrolprices.com)
there was a two week of decline of crude oil around the mentioned. In contrast, the review
reported an increase in the price of gasoline. The international crude oil prices recorded that the
global mean gasoline and diesel costs were 1.13 and 1.04 US dollars in every liter respectively.
The report also showed that the European average gasoline cost was 1.43 US dollars recording a
0.5% increase in the same compared to the previous week. In Asia, the price also went up by
1.5%. In Africa and USA, it went up by 0.6% and 0.2% respectively. It was also found that the
major increases were experienced in New Zealand, Thailand and Croatia (Macrotrends 2017).
Dataset 1
Data set 1 contains six variables. Three of them are nominal variables which include address,
suburb and brand. Address in this case represents the directions of the location where a particular
brand is located. Suburb represents the town where the brand is located while the brand
represents the company that is selling the fuel. The other variables are ordinal variables which
include postcode and fuel code. The only numerical variable which is very important for analysis
is the fuel price. Price in this case is a numerical variable which is also an interval measure. The
data is a secondary type of data since it is obtained from a source and not collected first hand.
3 | P a g e
⊘ This is a preview!⊘
Do you want full access?
Subscribe today to unlock all pages.
Trusted by 1+ million students worldwide
Statistics
Dataset 2
Dataset 2 about KOI students’ preference of service station. In selecting of the students from a
list, simple random sampling and convenience sampling were used to pick the students that have
made the sample. Convenience sampling was used to select 90 students from the population who
admitted that they have been buying petrol. After this, simple random sampling was used to
select the students that finally made the sample. This method (simple random sampling) was
found suitable as it gave each country an equal opportunity of being selected into the sample.
The limitation that this method had is that there are chances that we could have collected samples
from not many variations. The variable “percentage change” involved here is numeric. Since
data was extracted from a review report, it can be concluded that the data is secondary.
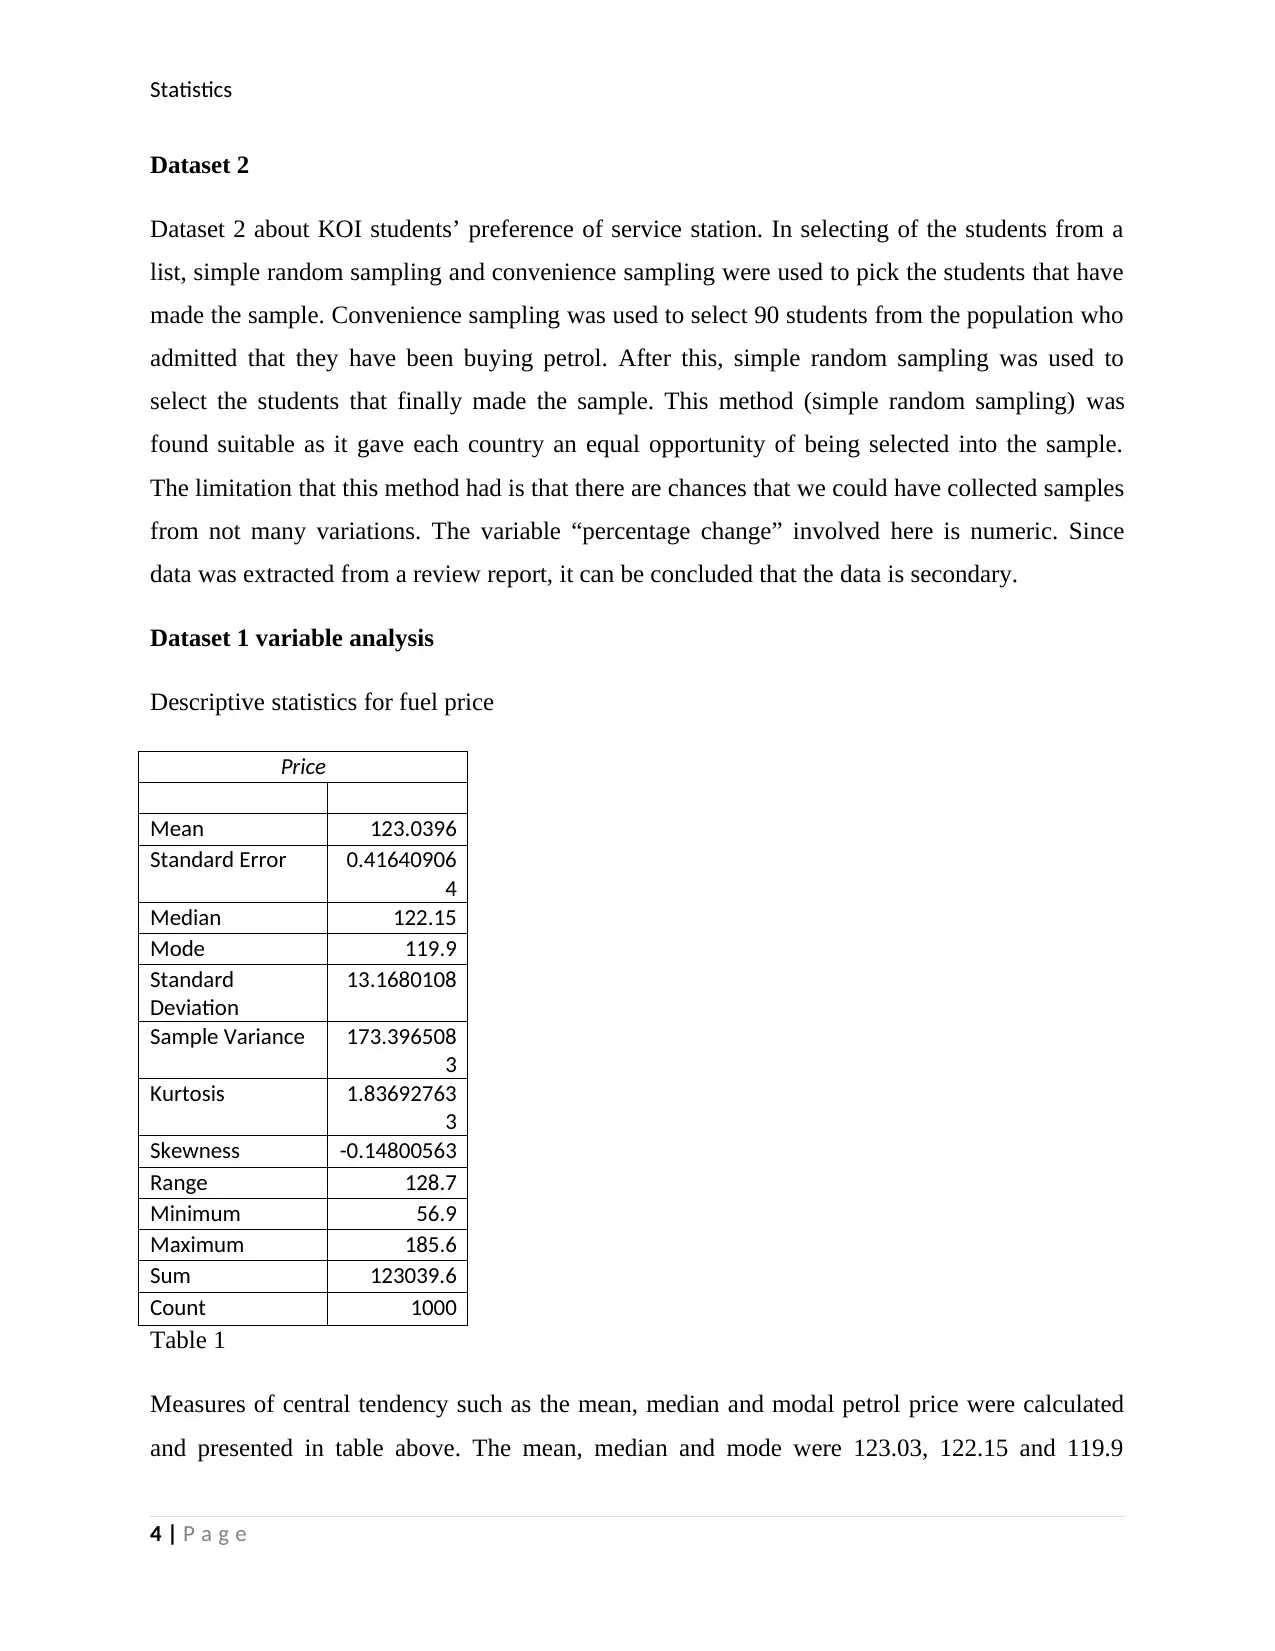
Dataset 1 variable analysis
Descriptive statistics for fuel price
Price
Mean 123.0396
Standard Error 0.41640906
4
Median 122.15
Mode 119.9
Standard
Deviation
13.1680108
Sample Variance 173.396508
3
Kurtosis 1.83692763
3
Skewness -0.14800563
Range 128.7
Minimum 56.9
Maximum 185.6
Sum 123039.6
Count 1000
Table 1
Measures of central tendency such as the mean, median and modal petrol price were calculated
and presented in table above. The mean, median and mode were 123.03, 122.15 and 119.9
4 | P a g e
Dataset 2
Dataset 2 about KOI students’ preference of service station. In selecting of the students from a
list, simple random sampling and convenience sampling were used to pick the students that have
made the sample. Convenience sampling was used to select 90 students from the population who
admitted that they have been buying petrol. After this, simple random sampling was used to
select the students that finally made the sample. This method (simple random sampling) was
found suitable as it gave each country an equal opportunity of being selected into the sample.
The limitation that this method had is that there are chances that we could have collected samples
from not many variations. The variable “percentage change” involved here is numeric. Since
data was extracted from a review report, it can be concluded that the data is secondary.
Dataset 1 variable analysis
Descriptive statistics for fuel price
Price
Mean 123.0396
Standard Error 0.41640906
4
Median 122.15
Mode 119.9
Standard
Deviation
13.1680108
Sample Variance 173.396508
3
Kurtosis 1.83692763
3
Skewness -0.14800563
Range 128.7
Minimum 56.9
Maximum 185.6
Sum 123039.6
Count 1000
Table 1
Measures of central tendency such as the mean, median and modal petrol price were calculated
and presented in table above. The mean, median and mode were 123.03, 122.15 and 119.9
4 | P a g e
Paraphrase This Document
Need a fresh take? Get an instant paraphrase of this document with our AI Paraphraser

Statistics
respectively. Measures of dispersion such as variance and standard deviation for the petrol price
were also calculated and found to be 173.39 and 13.16 respectively as can be observed from
table 1 above. The minimum and the maximum prices were 56.9 and 185.6 respectively as can
be observed from the table.
The distribution of the variable price
1 51 101151201251301351401451501551601651701751801851901951
0
20
40
60
80
100
120
140
160
180
200
Price distribution
Price
Figure 1
The frequency graph above is of the distribution of the petrol prices. As can be observed, the
prices had a uniform distribution since the number of times each price appeared was generally
equal for all the prices. The frequencies ranged from between 100 to about 180 times.
“Is the average price of petrol in all service station in September 2016 is more than 115
Australian cents?”
Hypothesis
H0: The average price of petrol in all service stations in September 2016 is more than 115
Australian cents
H1: The average price of petrol in all service stations in September 2016 is less than or equal to
115 Australian cents
5 | P a g e
Statistics
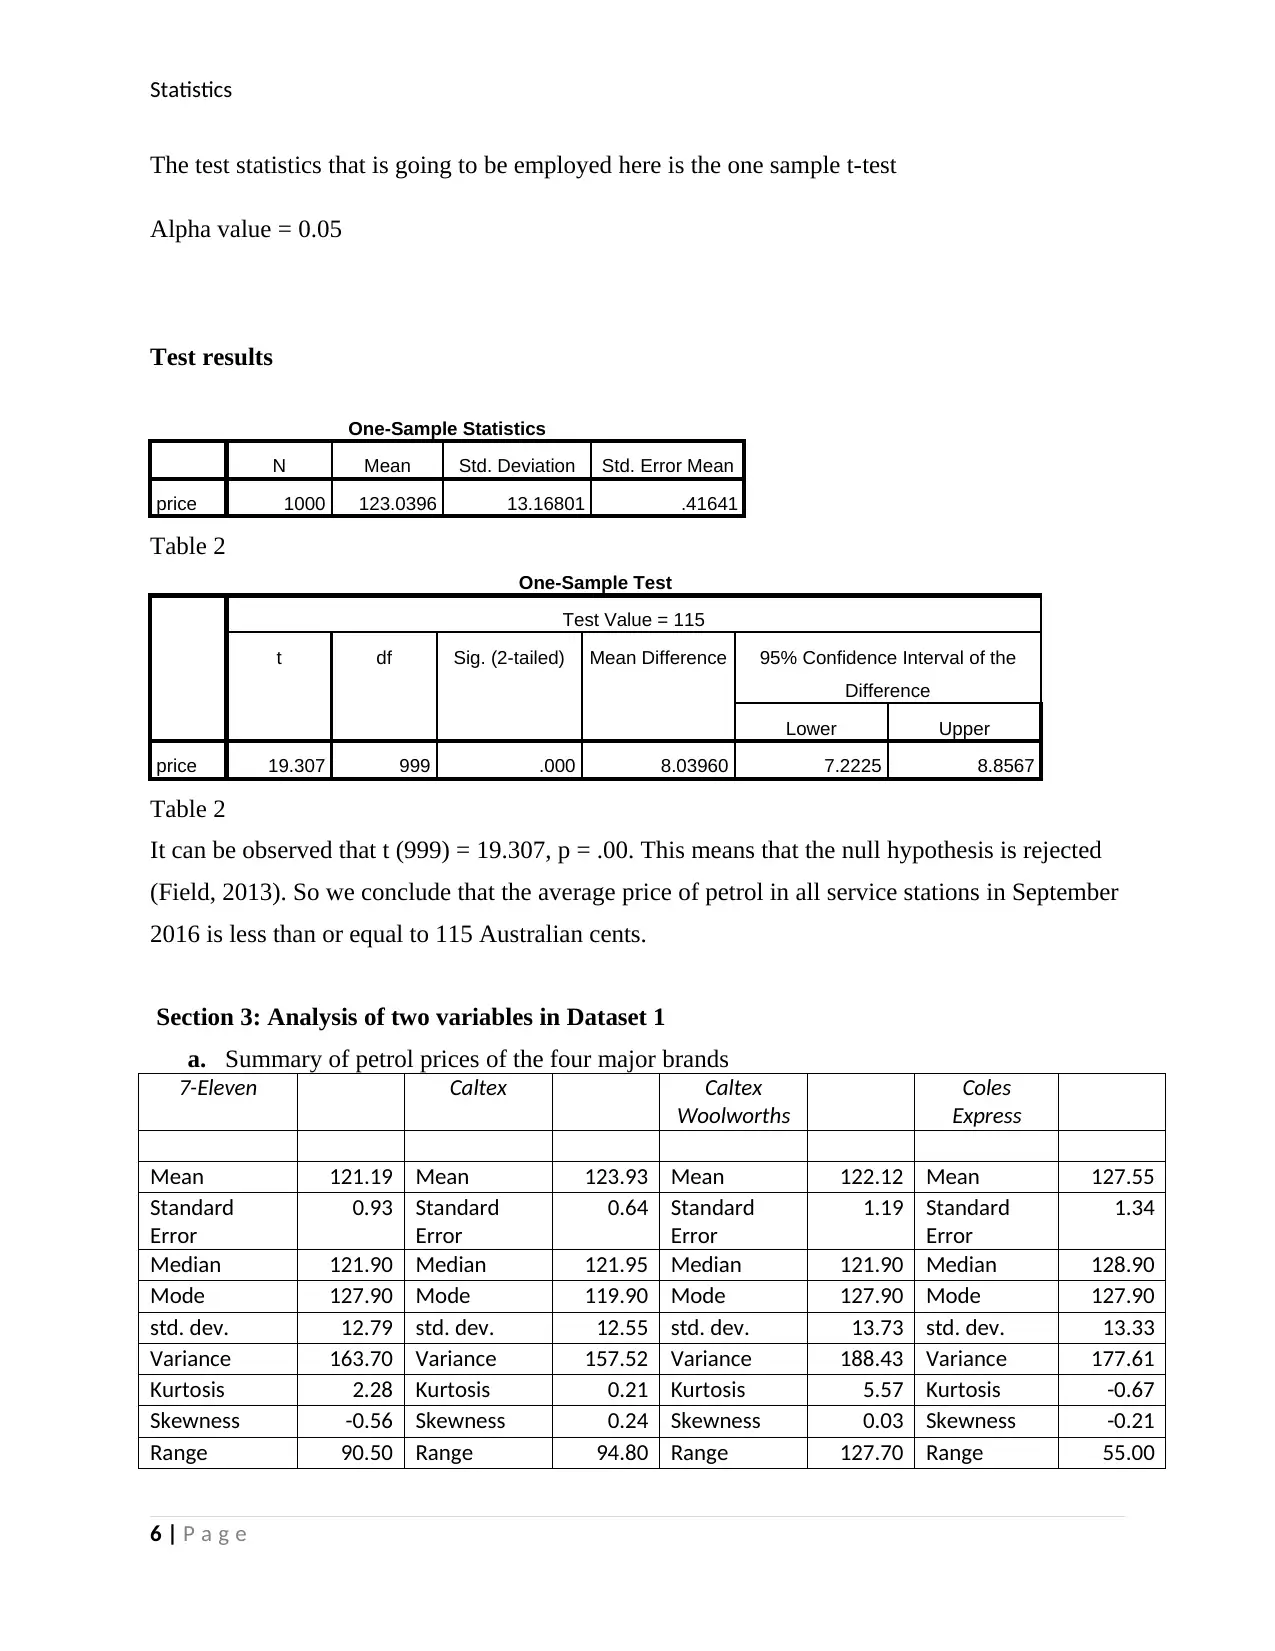
The test statistics that is going to be employed here is the one sample t-test
Alpha value = 0.05
Test results
One-Sample Statistics
N Mean Std. Deviation Std. Error Mean
price 1000 123.0396 13.16801 .41641
Table 2
One-Sample Test
Test Value = 115
t df Sig. (2-tailed) Mean Difference 95% Confidence Interval of the
Difference
Lower Upper
price 19.307 999 .000 8.03960 7.2225 8.8567
Table 2
It can be observed that t (999) = 19.307, p = .00. This means that the null hypothesis is rejected
(Field, 2013). So we conclude that the average price of petrol in all service stations in September
2016 is less than or equal to 115 Australian cents.
Section 3: Analysis of two variables in Dataset 1
a. Summary of petrol prices of the four major brands
7-Eleven Caltex Caltex
Woolworths
Coles
Express
Mean 121.19 Mean 123.93 Mean 122.12 Mean 127.55
Standard
Error
0.93 Standard
Error
0.64 Standard
Error
1.19 Standard
Error
1.34
Median 121.90 Median 121.95 Median 121.90 Median 128.90
Mode 127.90 Mode 119.90 Mode 127.90 Mode 127.90
std. dev. 12.79 std. dev. 12.55 std. dev. 13.73 std. dev. 13.33
Variance 163.70 Variance 157.52 Variance 188.43 Variance 177.61
Kurtosis 2.28 Kurtosis 0.21 Kurtosis 5.57 Kurtosis -0.67
Skewness -0.56 Skewness 0.24 Skewness 0.03 Skewness -0.21
Range 90.50 Range 94.80 Range 127.70 Range 55.00
6 | P a g e
⊘ This is a preview!⊘
Do you want full access?
Subscribe today to unlock all pages.
Trusted by 1+ million students worldwide
Statistics
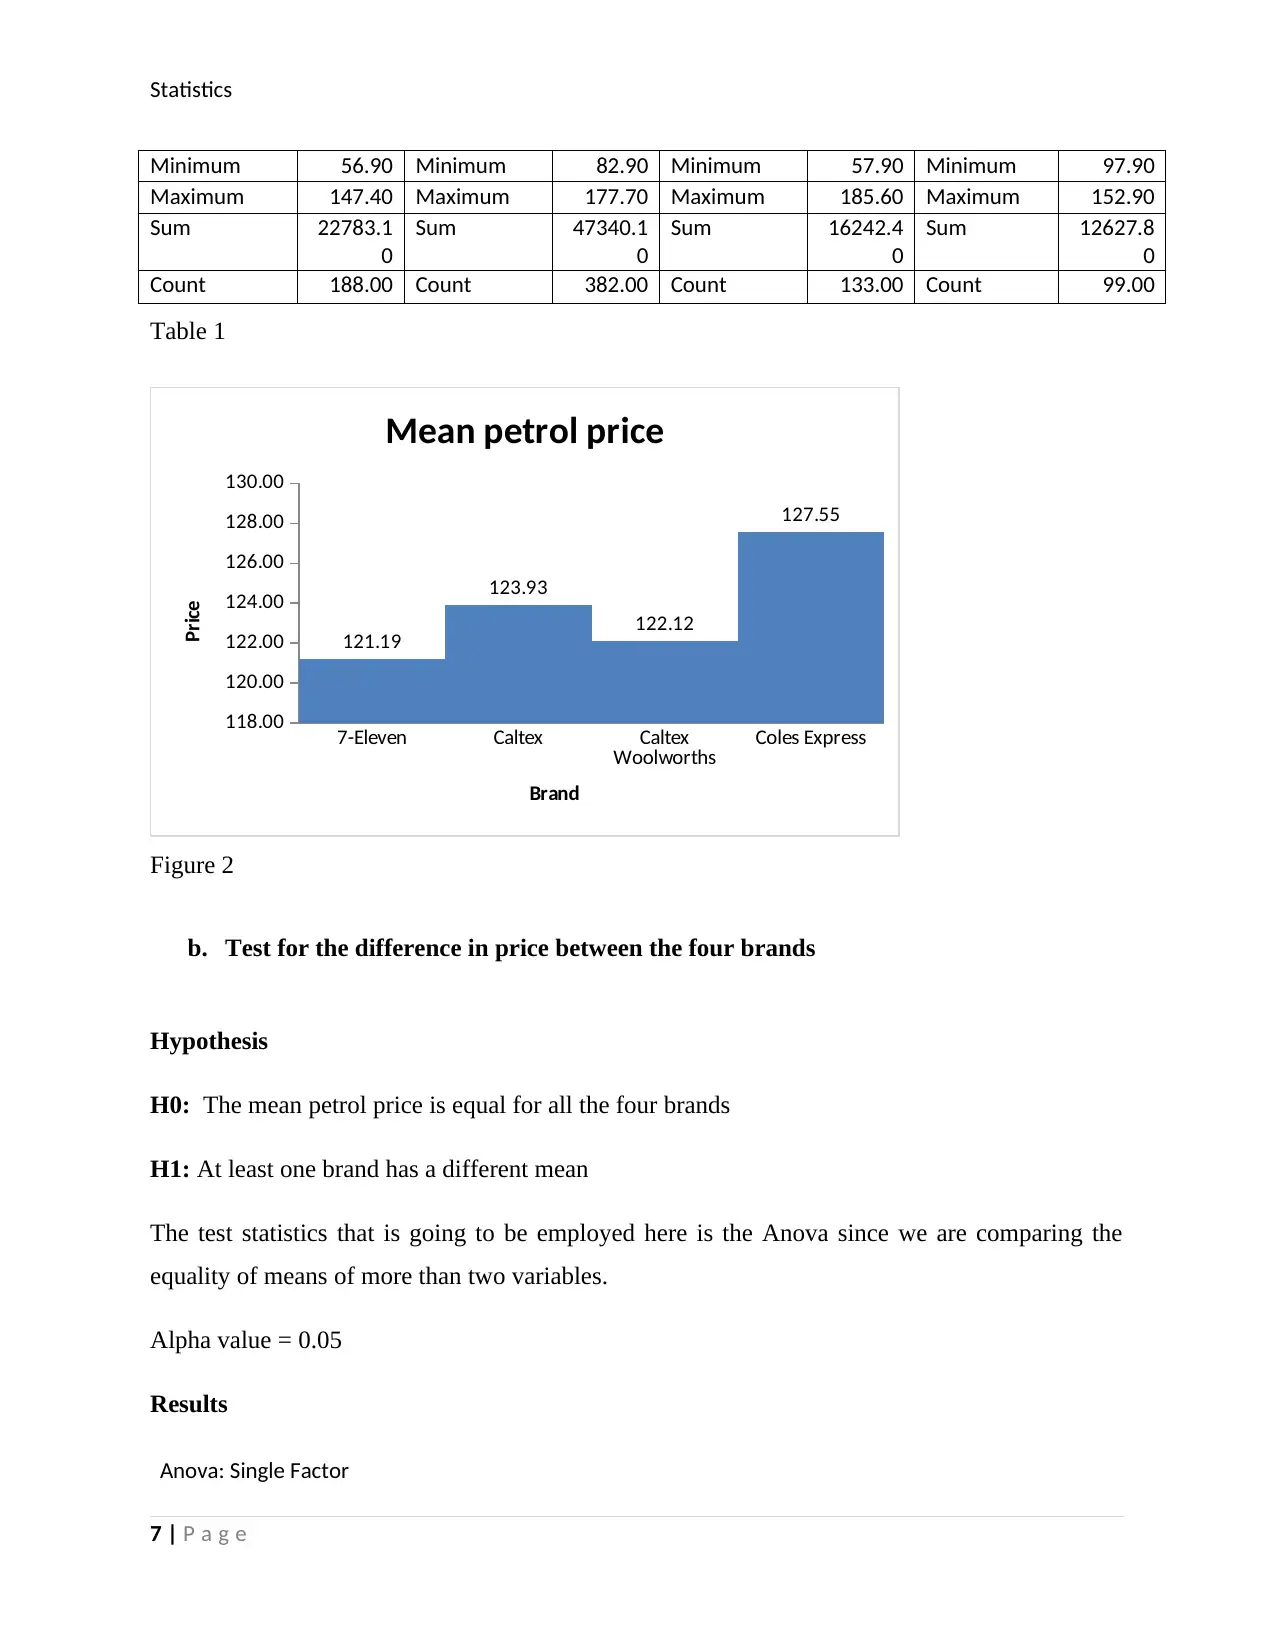
Minimum 56.90 Minimum 82.90 Minimum 57.90 Minimum 97.90
Maximum 147.40 Maximum 177.70 Maximum 185.60 Maximum 152.90
Sum 22783.1
0
Sum 47340.1
0
Sum 16242.4
0
Sum 12627.8
0
Count 188.00 Count 382.00 Count 133.00 Count 99.00
Table 1
7-Eleven Caltex Caltex
Woolworths Coles Express
118.00
120.00
122.00
124.00
126.00
128.00
130.00
121.19
123.93
122.12
127.55
Mean petrol price
Brand
Price
Figure 2
b. Test for the difference in price between the four brands
Hypothesis
H0: The mean petrol price is equal for all the four brands
H1: At least one brand has a different mean
The test statistics that is going to be employed here is the Anova since we are comparing the
equality of means of more than two variables.
Alpha value = 0.05
Results
Anova: Single Factor
7 | P a g e
Paraphrase This Document
Need a fresh take? Get an instant paraphrase of this document with our AI Paraphraser
Statistics
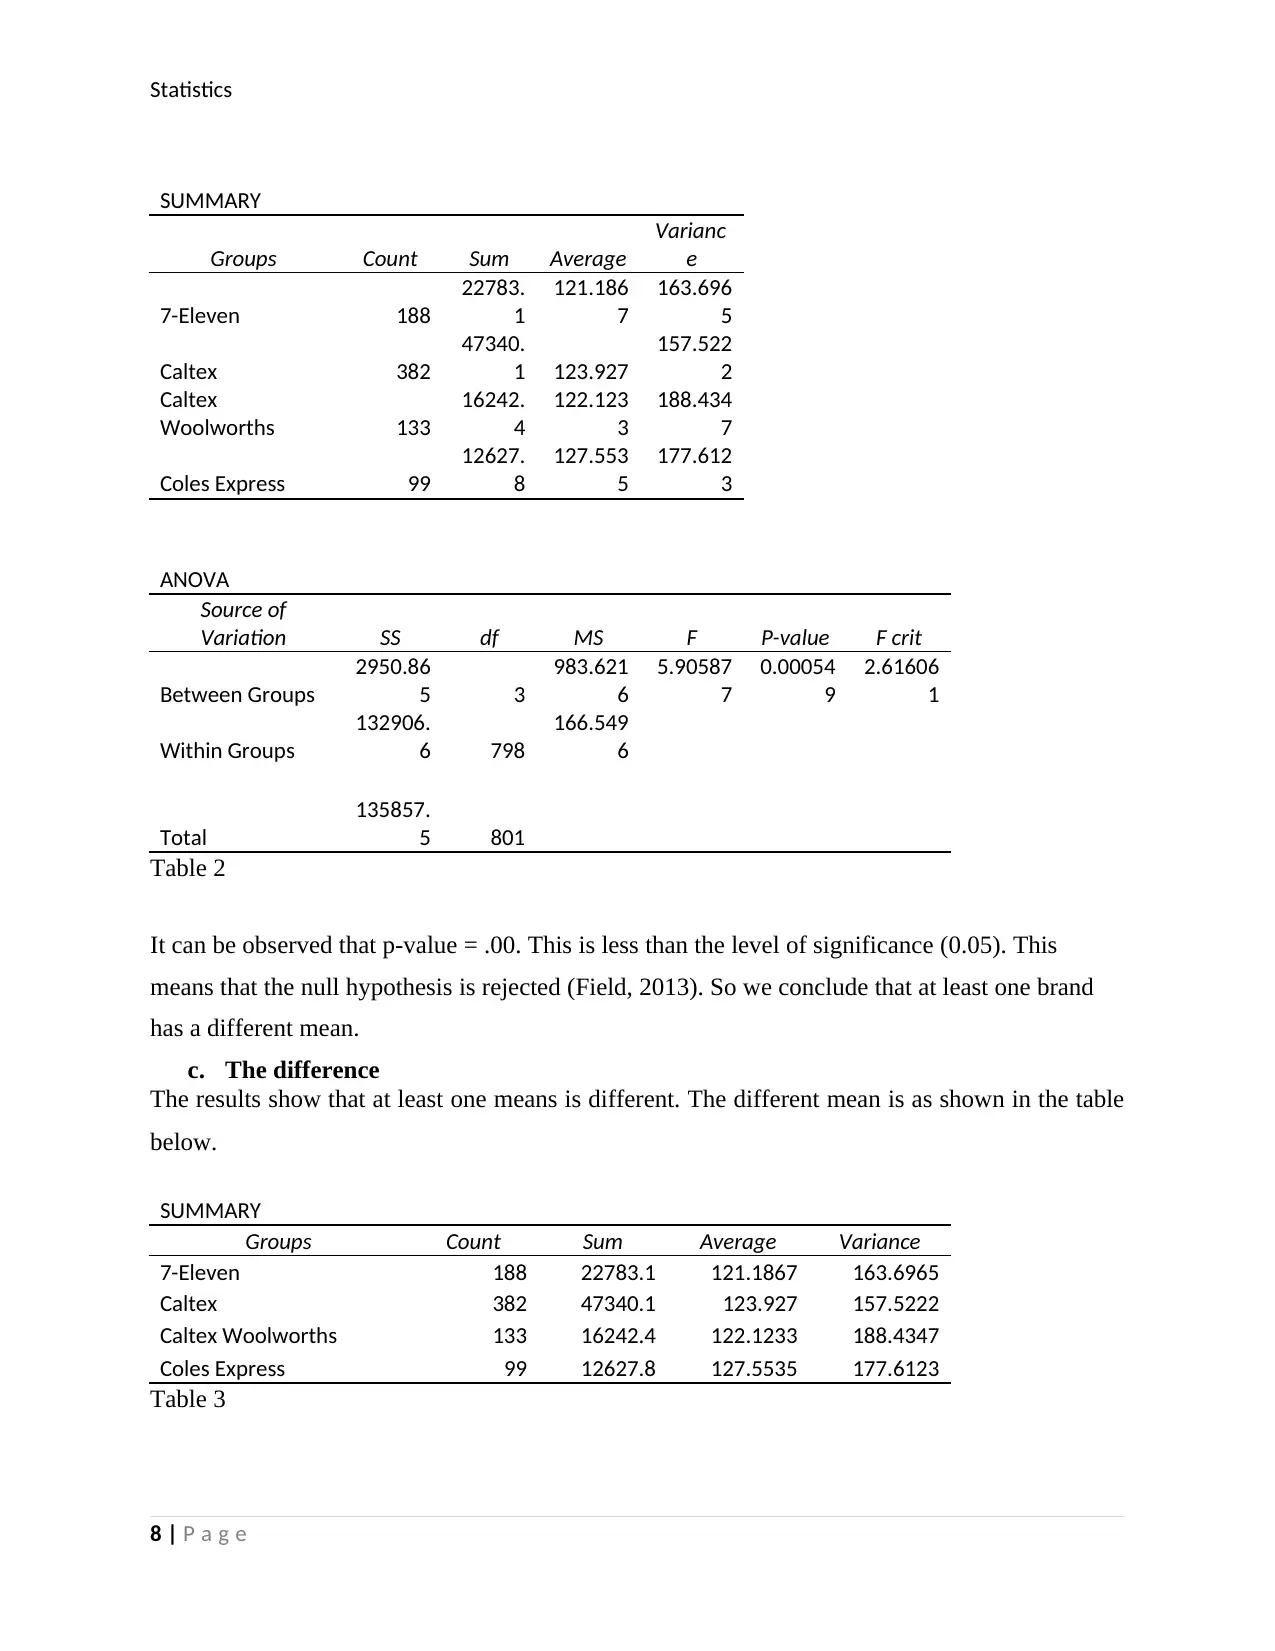
SUMMARY
Groups Count Sum Average
Varianc
e
7-Eleven 188
22783.
1
121.186
7
163.696
5
Caltex 382
47340.
1 123.927
157.522
2
Caltex
Woolworths 133
16242.
4
122.123
3
188.434
7
Coles Express 99
12627.
8
127.553
5
177.612
3
ANOVA
Source of
Variation SS df MS F P-value F crit
Between Groups
2950.86
5 3
983.621
6
5.90587
7
0.00054
9
2.61606
1
Within Groups
132906.
6 798
166.549
6
Total
135857.
5 801
Table 2
It can be observed that p-value = .00. This is less than the level of significance (0.05). This
means that the null hypothesis is rejected (Field, 2013). So we conclude that at least one brand
has a different mean.
c. The difference
The results show that at least one means is different. The different mean is as shown in the table
below.
SUMMARY
Groups Count Sum Average Variance
7-Eleven 188 22783.1 121.1867 163.6965
Caltex 382 47340.1 123.927 157.5222
Caltex Woolworths 133 16242.4 122.1233 188.4347
Coles Express 99 12627.8 127.5535 177.6123
Table 3
8 | P a g e
SUMMARY
Groups Count Sum Average
Varianc
e
7-Eleven 188
22783.
1
121.186
7
163.696
5
Caltex 382
47340.
1 123.927
157.522
2
Caltex
Woolworths 133
16242.
4
122.123
3
188.434
7
Coles Express 99
12627.
8
127.553
5
177.612
3
ANOVA
Source of
Variation SS df MS F P-value F crit
Between Groups
2950.86
5 3
983.621
6
5.90587
7
0.00054
9
2.61606
1
Within Groups
132906.
6 798
166.549
6
Total
135857.
5 801
Table 2
It can be observed that p-value = .00. This is less than the level of significance (0.05). This
means that the null hypothesis is rejected (Field, 2013). So we conclude that at least one brand
has a different mean.
c. The difference
The results show that at least one means is different. The different mean is as shown in the table
below.
SUMMARY
Groups Count Sum Average Variance
7-Eleven 188 22783.1 121.1867 163.6965
Caltex 382 47340.1 123.927 157.5222
Caltex Woolworths 133 16242.4 122.1233 188.4347
Coles Express 99 12627.8 127.5535 177.6123
Table 3
8 | P a g e
Statistics
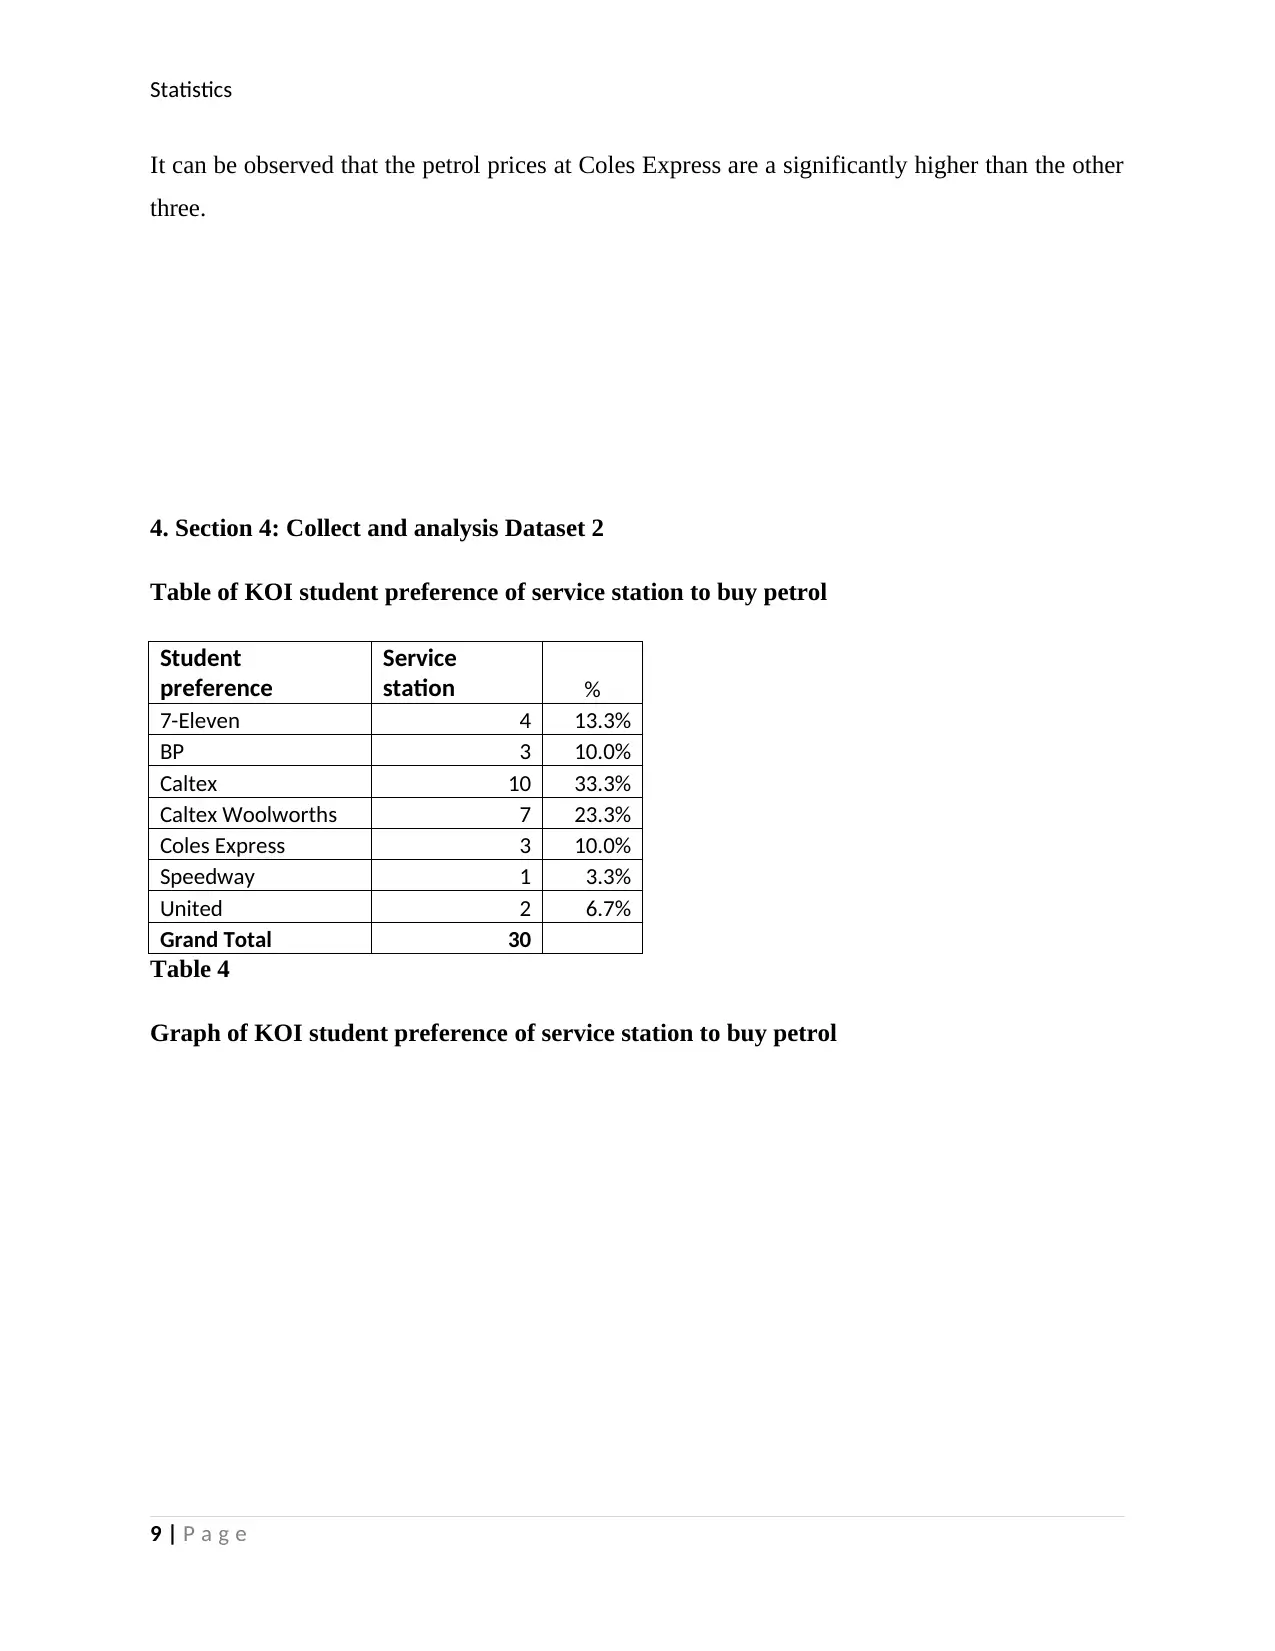
It can be observed that the petrol prices at Coles Express are a significantly higher than the other
three.
4. Section 4: Collect and analysis Dataset 2
Table of KOI student preference of service station to buy petrol
Student
preference
Service
station %
7-Eleven 4 13.3%
BP 3 10.0%
Caltex 10 33.3%
Caltex Woolworths 7 23.3%
Coles Express 3 10.0%
Speedway 1 3.3%
United 2 6.7%
Grand Total 30
Table 4
Graph of KOI student preference of service station to buy petrol
9 | P a g e
⊘ This is a preview!⊘
Do you want full access?
Subscribe today to unlock all pages.
Trusted by 1+ million students worldwide
Statistics
7-Eleven
BP
Caltex
Caltex Woolworths
Coles Express
Speedway
United
0
2
4
6
8
10
12
4 3
10
7
3
1 2
Student preference of service station
Preferred station
Number of station
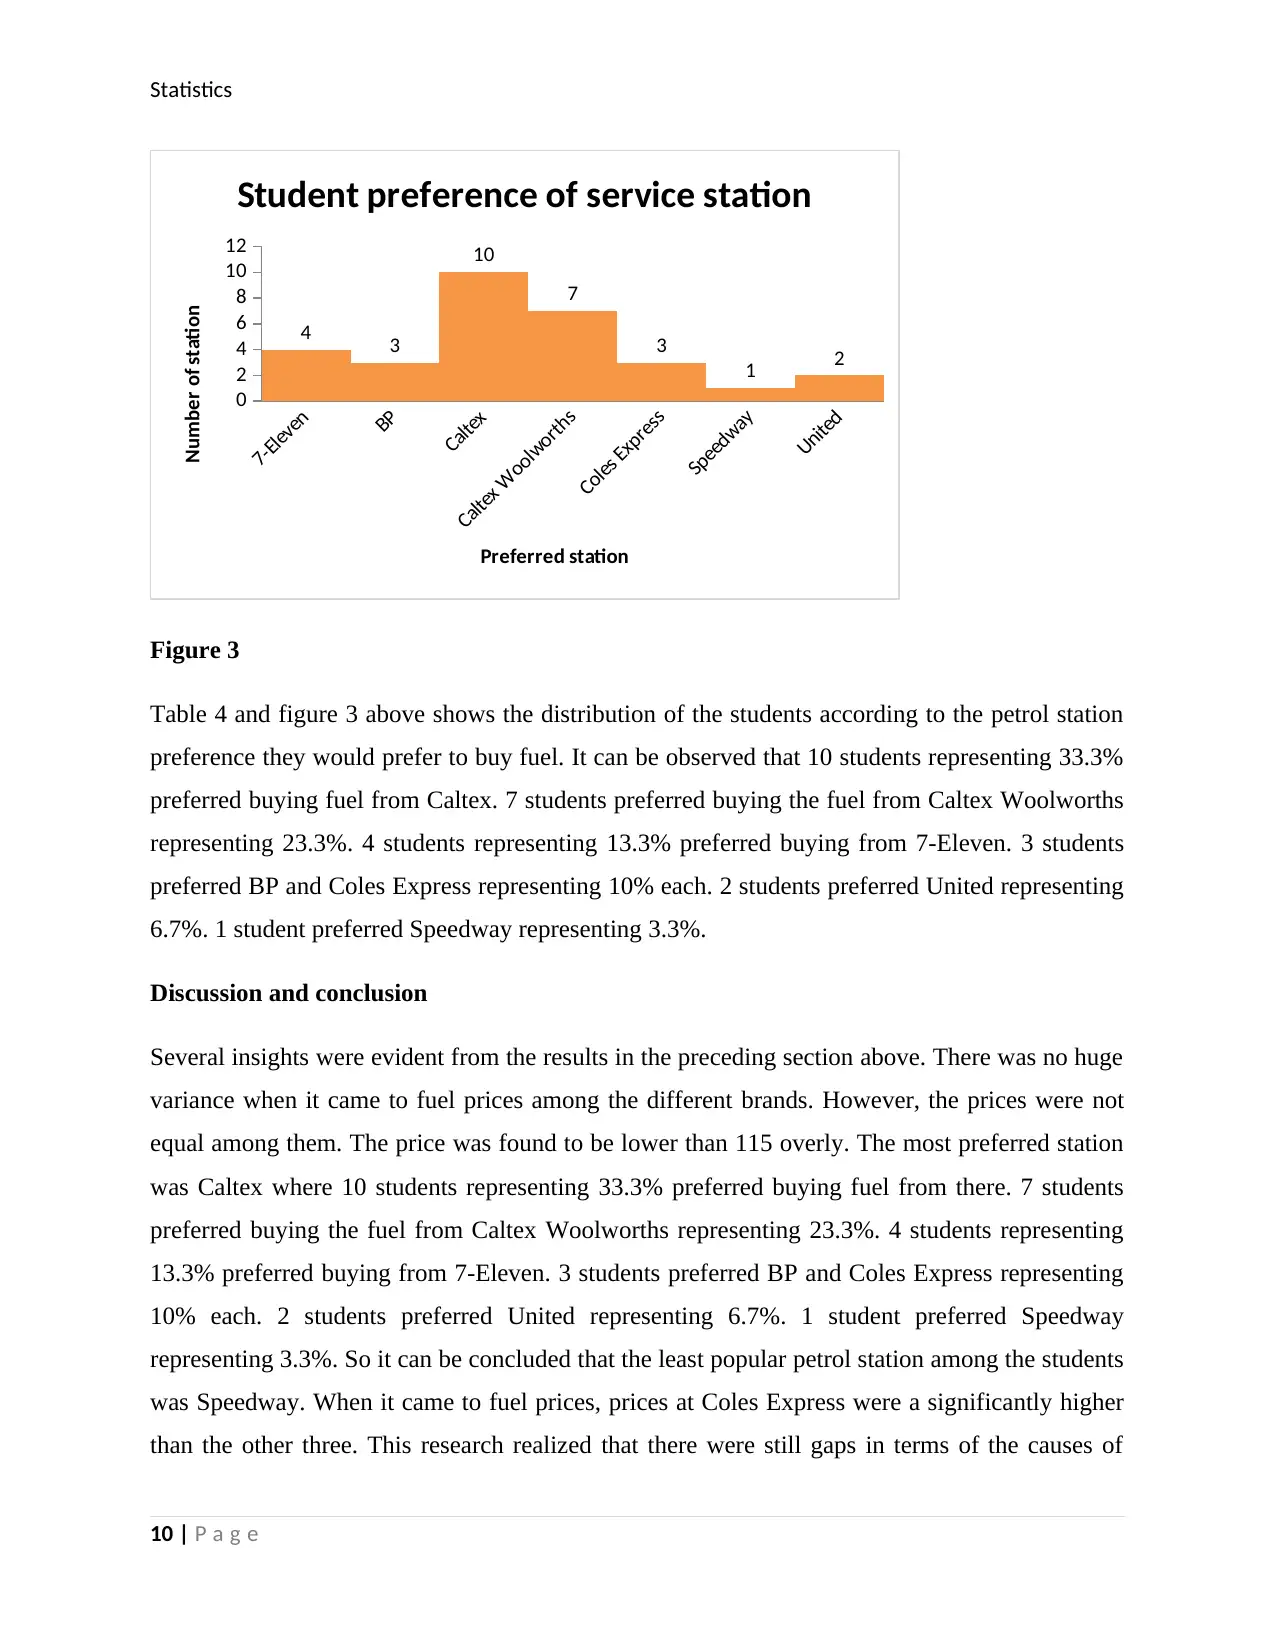
Figure 3
Table 4 and figure 3 above shows the distribution of the students according to the petrol station
preference they would prefer to buy fuel. It can be observed that 10 students representing 33.3%
preferred buying fuel from Caltex. 7 students preferred buying the fuel from Caltex Woolworths
representing 23.3%. 4 students representing 13.3% preferred buying from 7-Eleven. 3 students
preferred BP and Coles Express representing 10% each. 2 students preferred United representing
6.7%. 1 student preferred Speedway representing 3.3%.
Discussion and conclusion
Several insights were evident from the results in the preceding section above. There was no huge
variance when it came to fuel prices among the different brands. However, the prices were not
equal among them. The price was found to be lower than 115 overly. The most preferred station
was Caltex where 10 students representing 33.3% preferred buying fuel from there. 7 students
preferred buying the fuel from Caltex Woolworths representing 23.3%. 4 students representing
13.3% preferred buying from 7-Eleven. 3 students preferred BP and Coles Express representing
10% each. 2 students preferred United representing 6.7%. 1 student preferred Speedway
representing 3.3%. So it can be concluded that the least popular petrol station among the students
was Speedway. When it came to fuel prices, prices at Coles Express were a significantly higher
than the other three. This research realized that there were still gaps in terms of the causes of
10 | P a g e
7-Eleven
BP
Caltex
Caltex Woolworths
Coles Express
Speedway
United
0
2
4
6
8
10
12
4 3
10
7
3
1 2
Student preference of service station
Preferred station
Number of station
Figure 3
Table 4 and figure 3 above shows the distribution of the students according to the petrol station
preference they would prefer to buy fuel. It can be observed that 10 students representing 33.3%
preferred buying fuel from Caltex. 7 students preferred buying the fuel from Caltex Woolworths
representing 23.3%. 4 students representing 13.3% preferred buying from 7-Eleven. 3 students
preferred BP and Coles Express representing 10% each. 2 students preferred United representing
6.7%. 1 student preferred Speedway representing 3.3%.
Discussion and conclusion
Several insights were evident from the results in the preceding section above. There was no huge
variance when it came to fuel prices among the different brands. However, the prices were not
equal among them. The price was found to be lower than 115 overly. The most preferred station
was Caltex where 10 students representing 33.3% preferred buying fuel from there. 7 students
preferred buying the fuel from Caltex Woolworths representing 23.3%. 4 students representing
13.3% preferred buying from 7-Eleven. 3 students preferred BP and Coles Express representing
10% each. 2 students preferred United representing 6.7%. 1 student preferred Speedway
representing 3.3%. So it can be concluded that the least popular petrol station among the students
was Speedway. When it came to fuel prices, prices at Coles Express were a significantly higher
than the other three. This research realized that there were still gaps in terms of the causes of
10 | P a g e
Paraphrase This Document
Need a fresh take? Get an instant paraphrase of this document with our AI Paraphraser
Statistics
variance in prices among different brands. There were also gaps in terms of what caused the
difference in preferences. This study therefore recommends further research to establish the
cause of the difference in prices and difference in preference.
Reference
www.globalpetrolprices.com
Girardi, D 2012, Do Financial Investors Affect the Price of Petrol? MPRA Paper No. 40285.
Elliott, L 2015, Opec bid to kill off US shale sends oil price down to 2009 low. The Guardian.
Williams, T 2011, Global Commodity Markets – Price Volatility and Financialisation. RBA
Bulletin, June, pp.49 - 57.
Krauss, C 2017, Oil Prices: What to Make of the Volatility. The New York Times.
Macrotrends, 2017, WTI Crude Oil Prices - 10 Year Daily Chart. Available at:
http://www.macrotrends.net/2516/wti-crude-oil-prices-10-year-daily-chart
11 | P a g e
1 out of 11
Related Documents


Your All-in-One AI-Powered Toolkit for Academic Success.
+13062052269
info@desklib.com
Available 24*7 on WhatsApp / Email
![[object Object]](/_next/static/media/star-bottom.7253800d.svg)
Unlock your academic potential
Copyright © 2020–2026 A2Z Services. All Rights Reserved. Developed and managed by ZUCOL.