BUS708 Statistics and Data Analysis: Aviation Industry Report
VerifiedAdded on 2023/04/24
|9
|1558
|411
Report
AI Summary
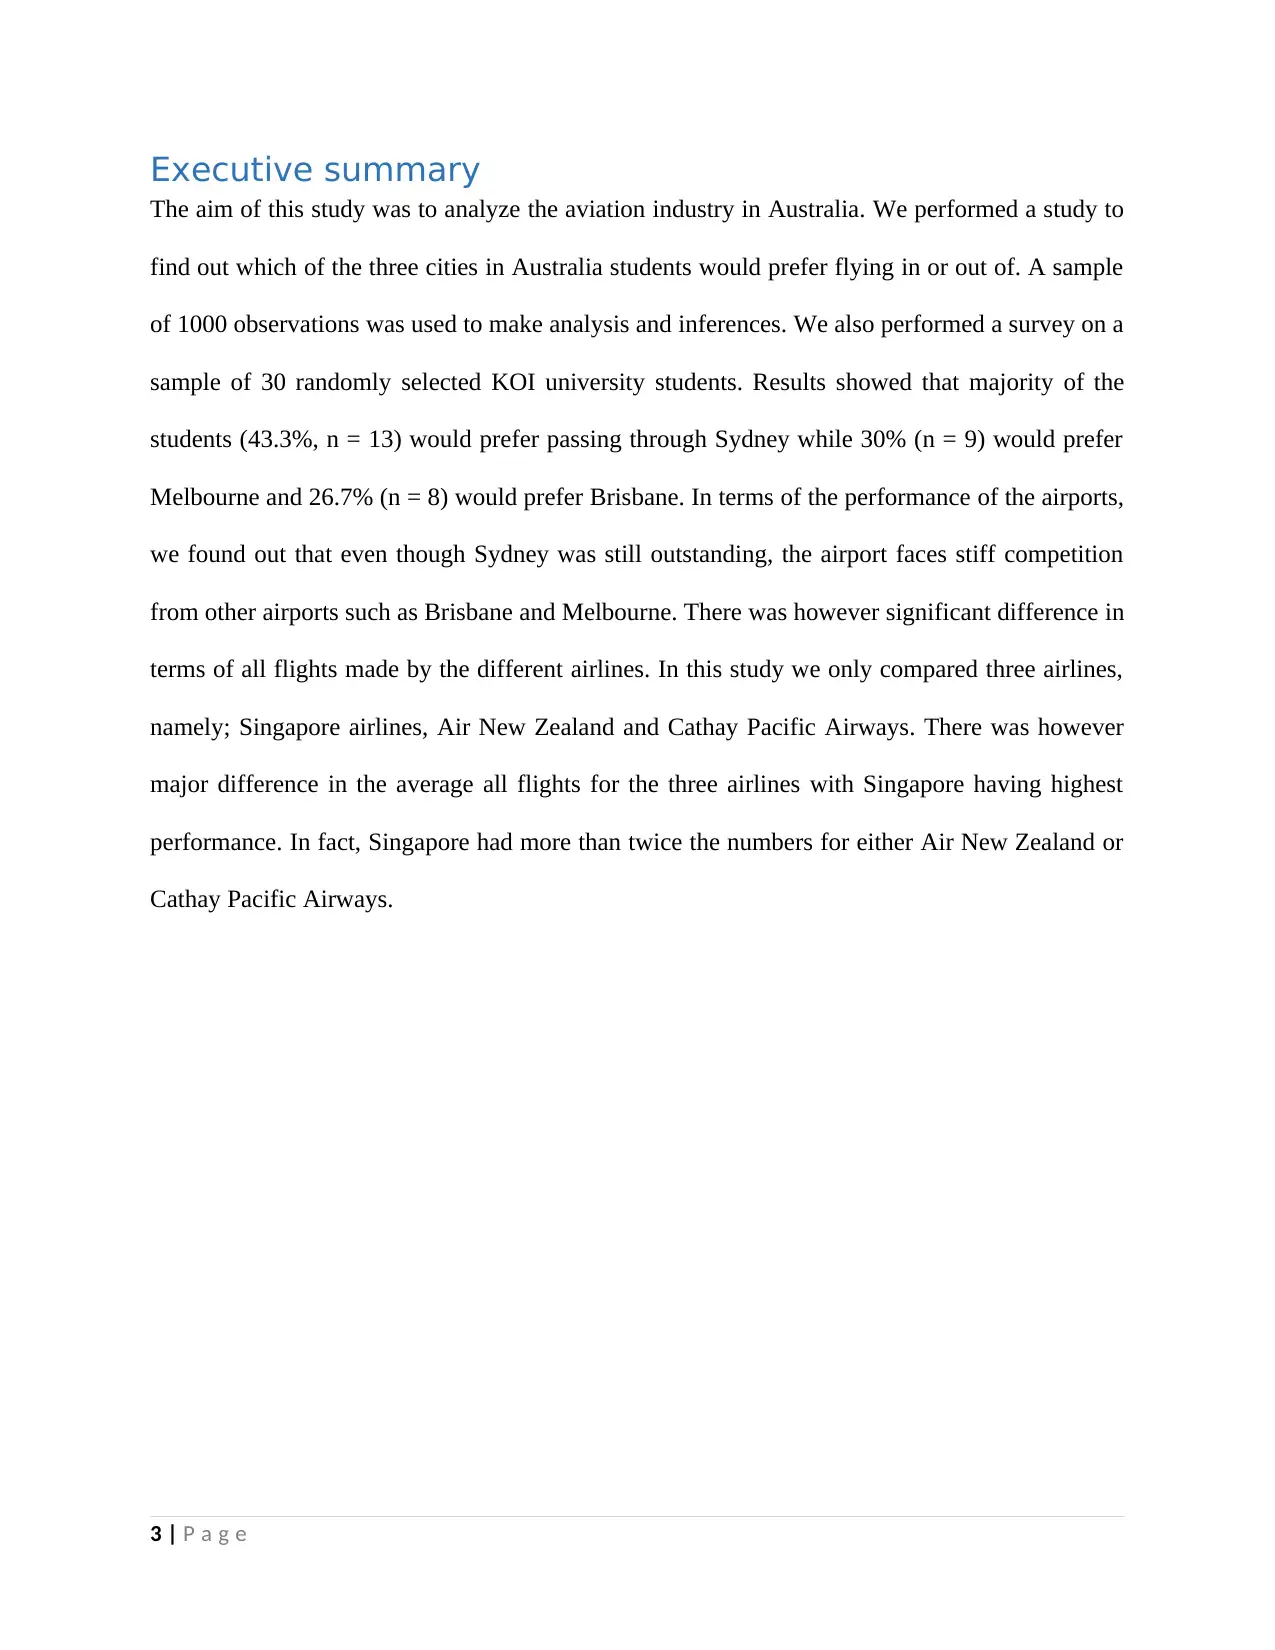
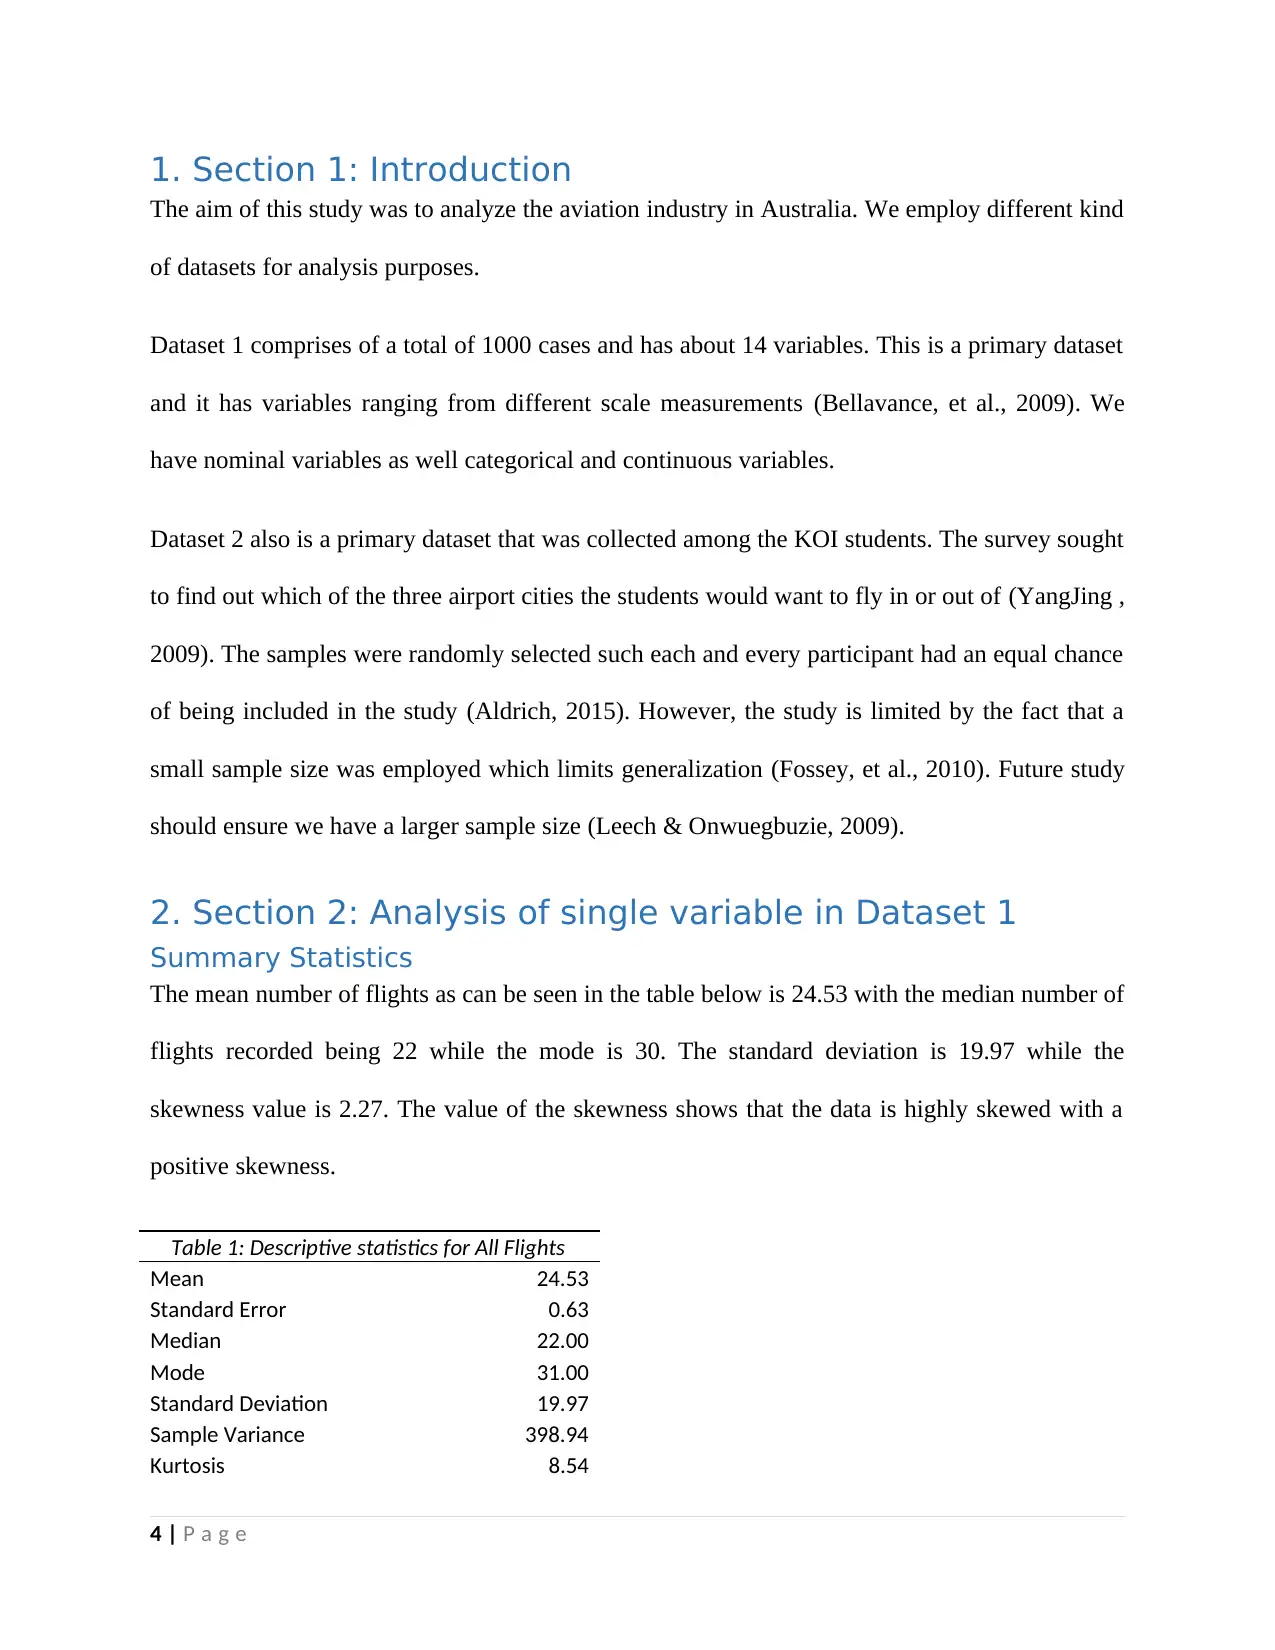
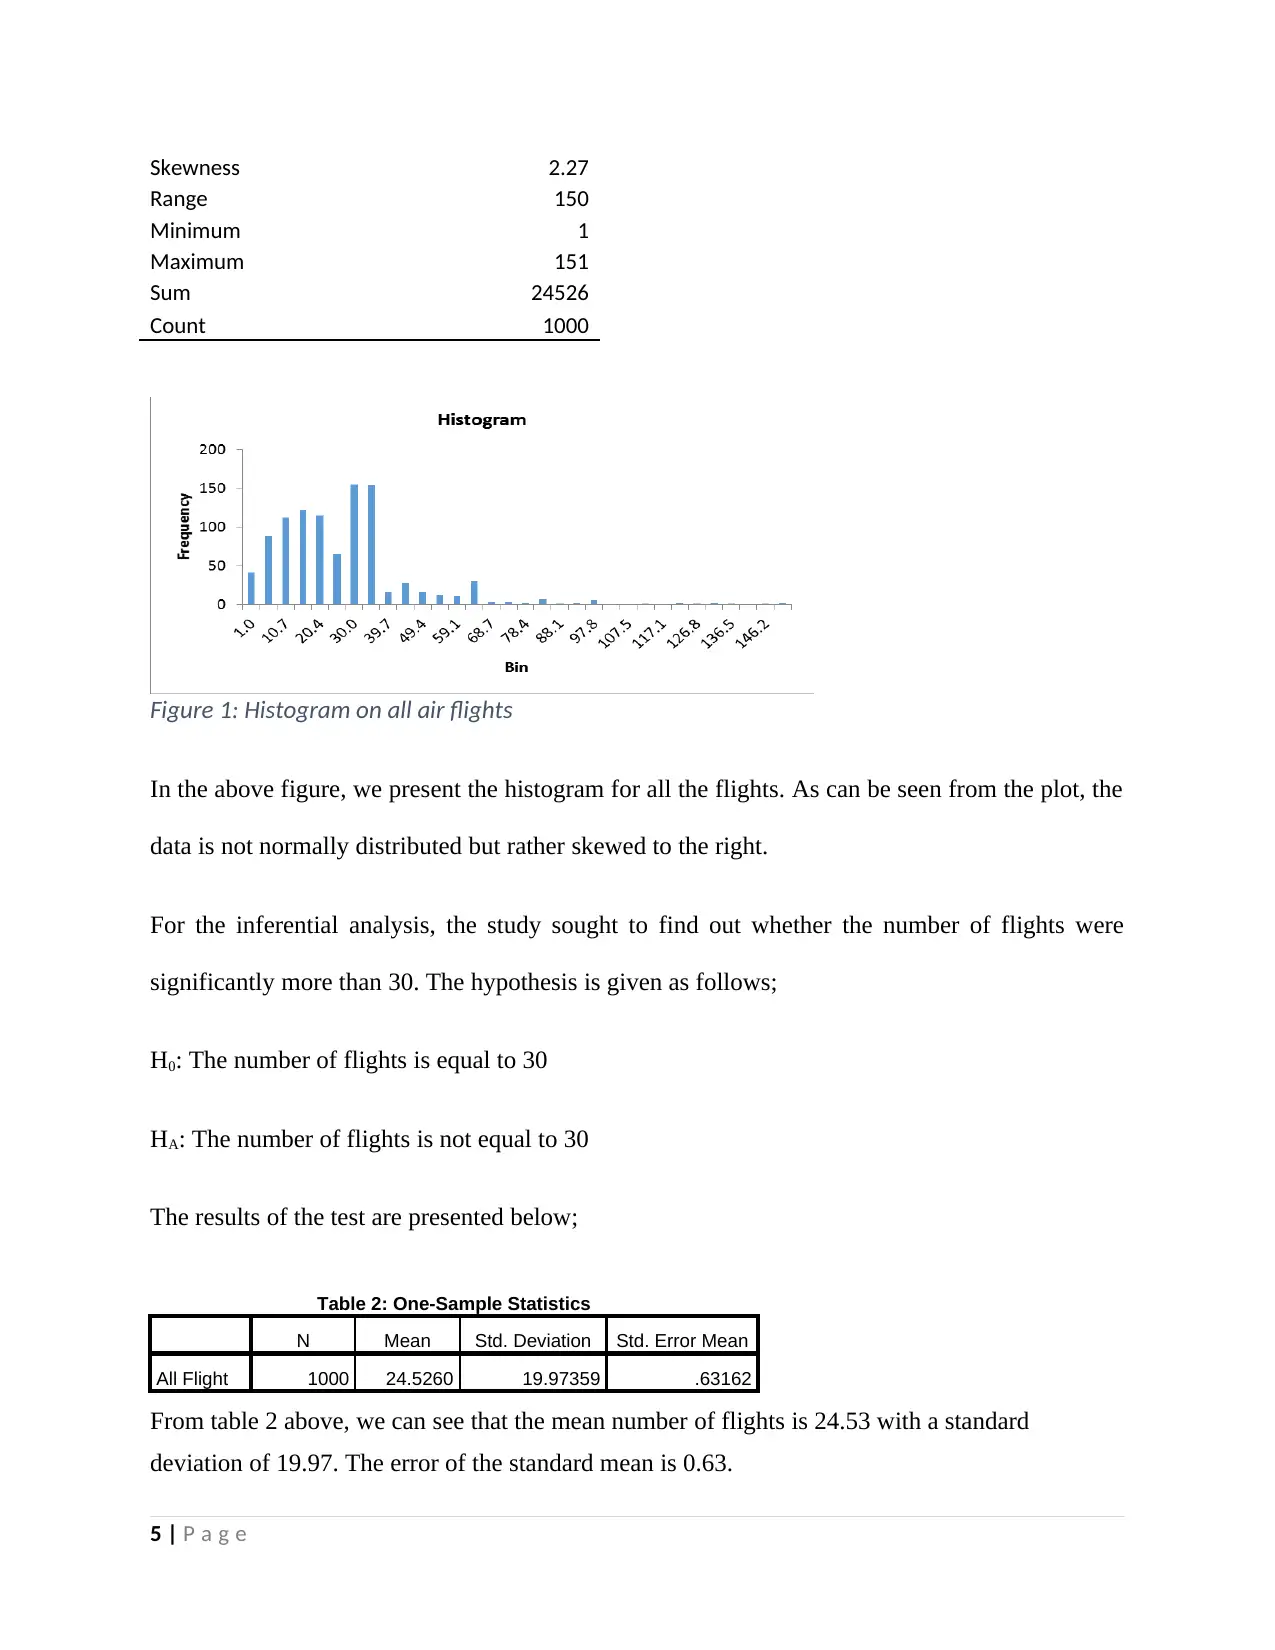
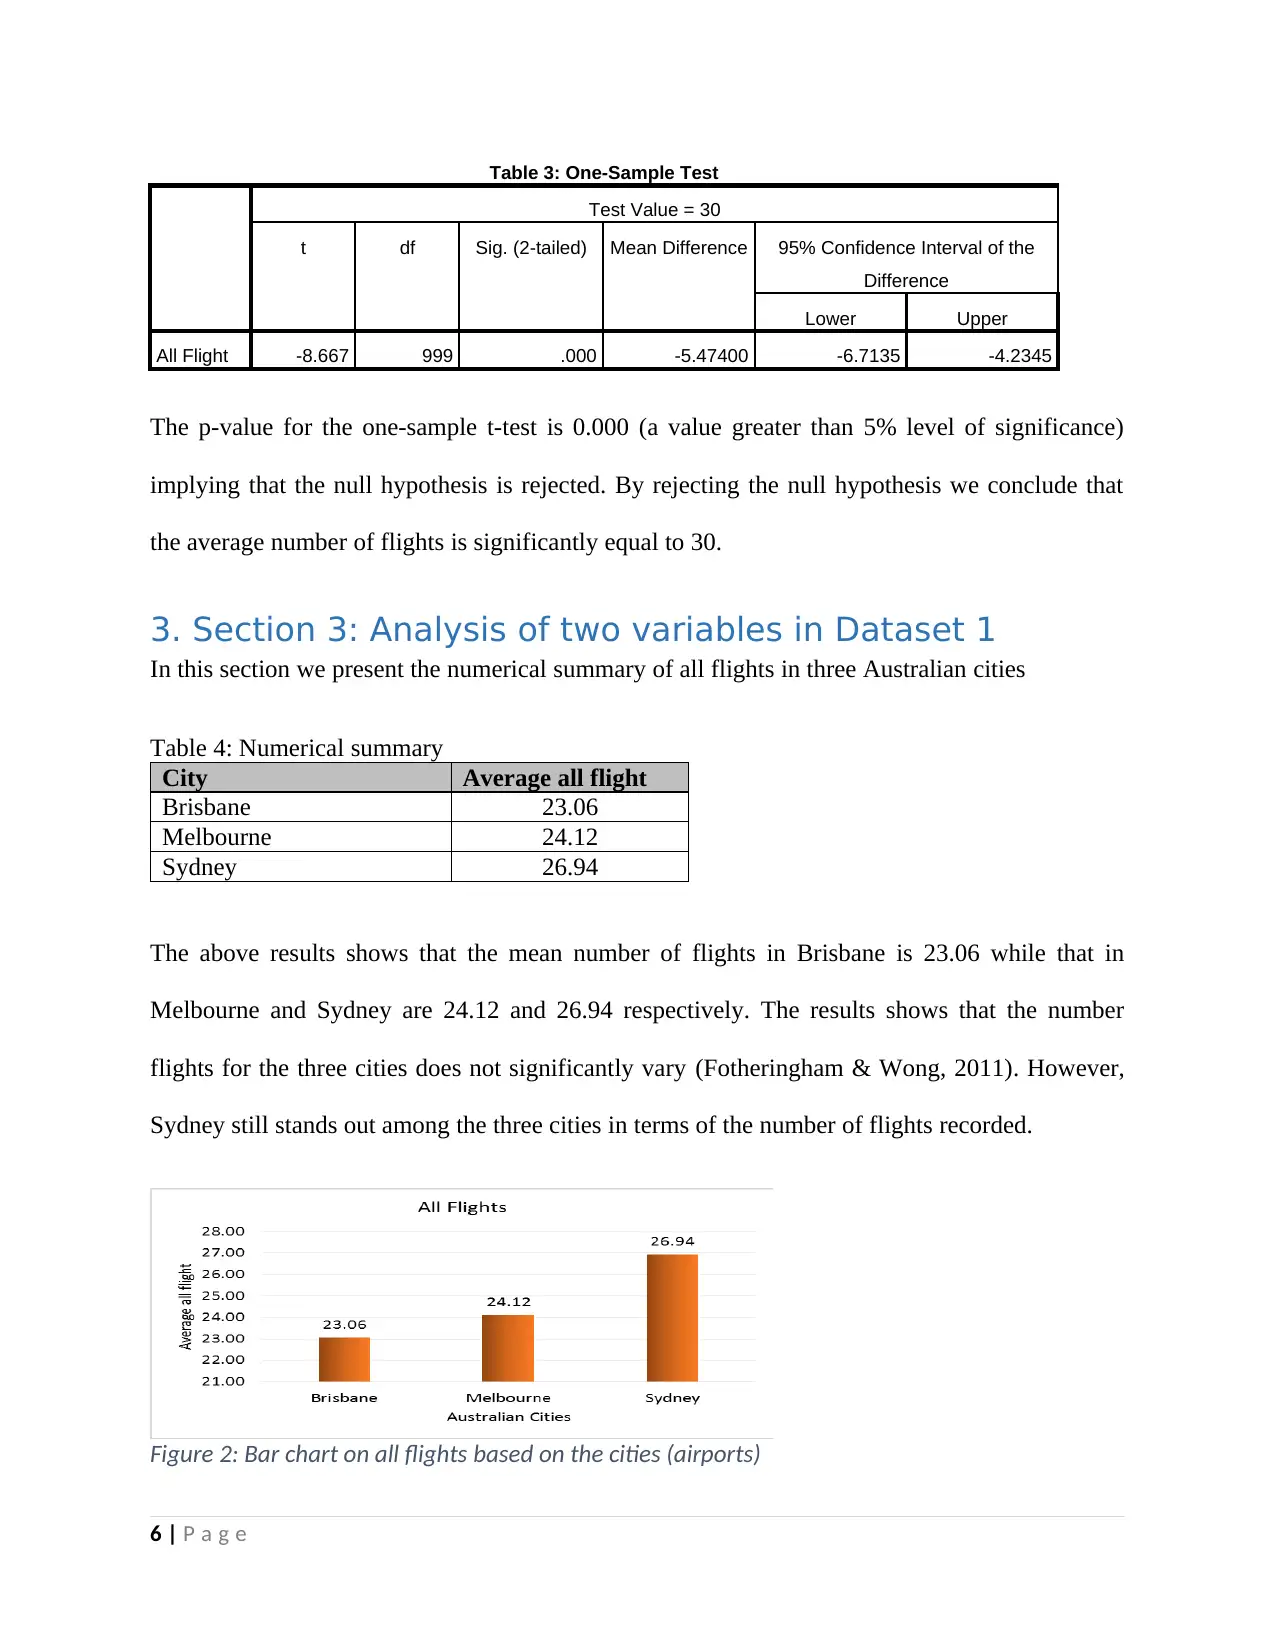
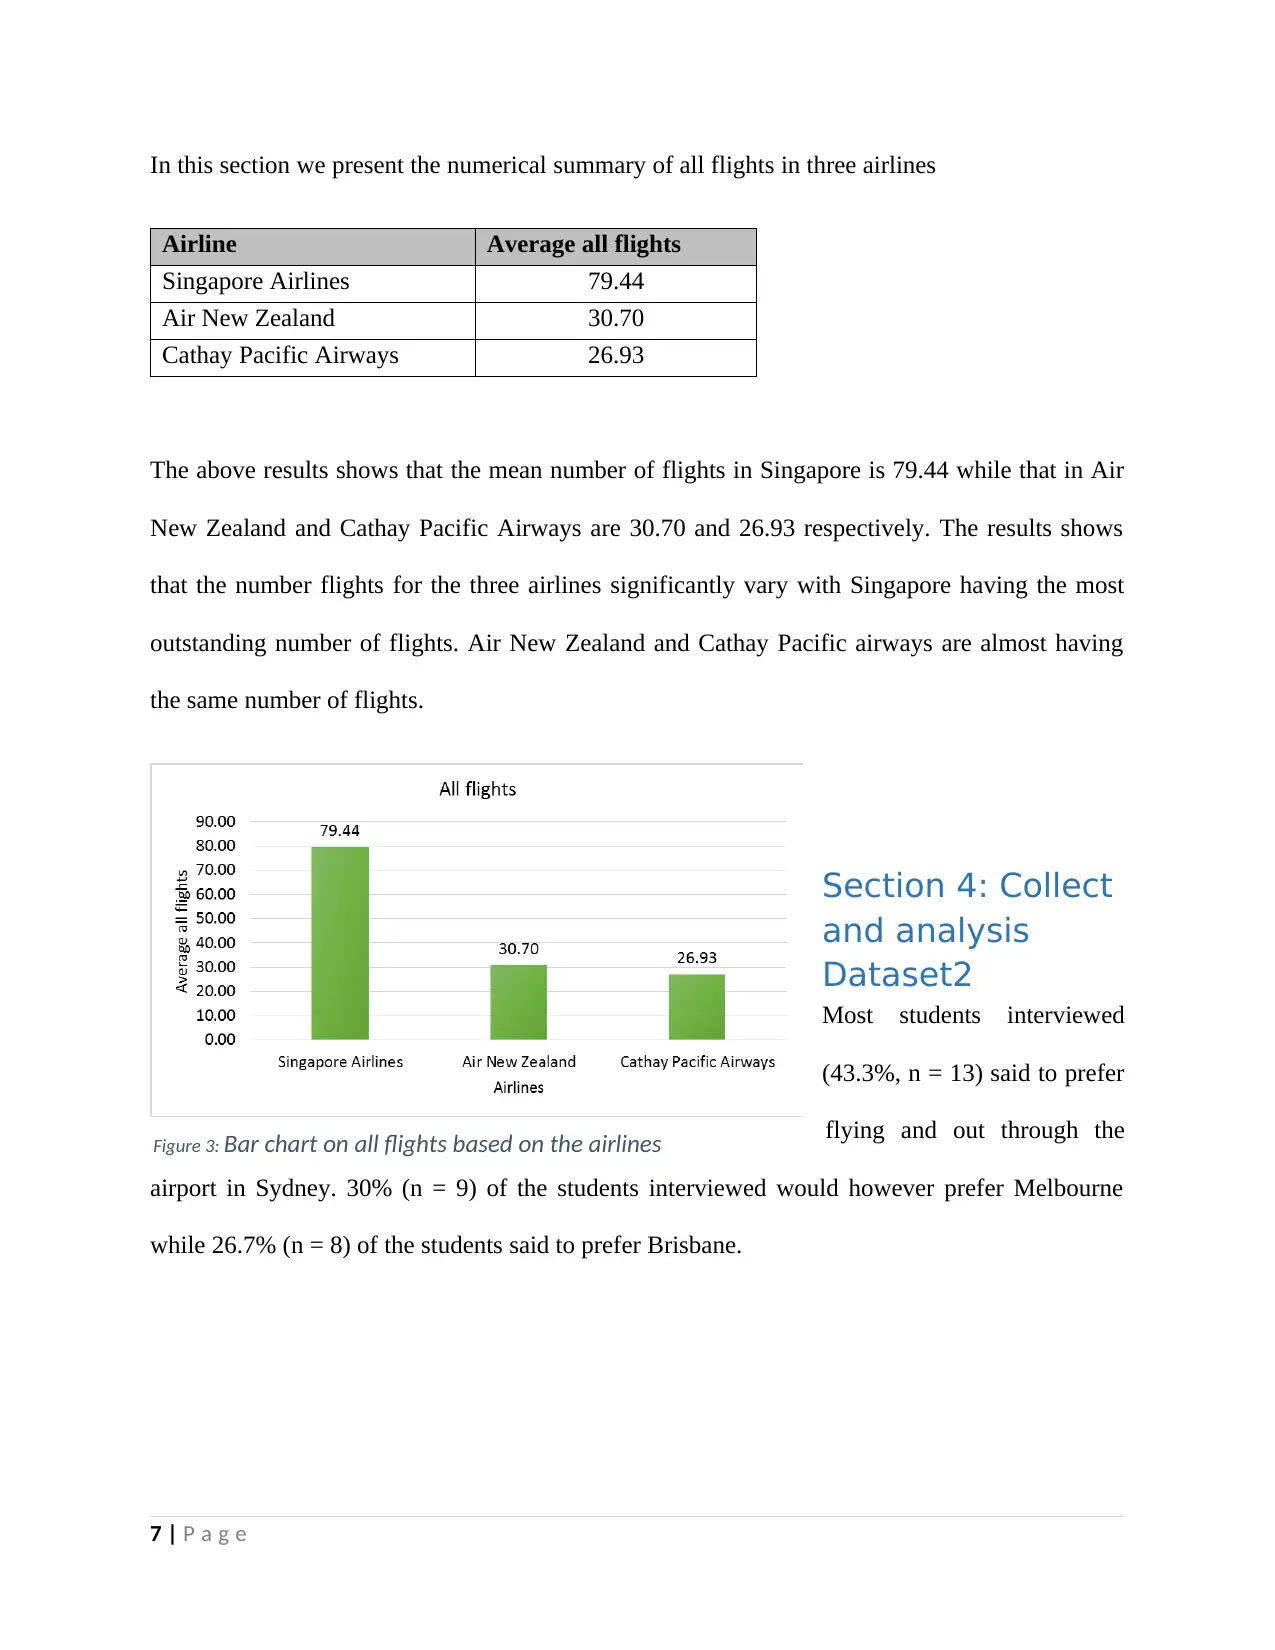
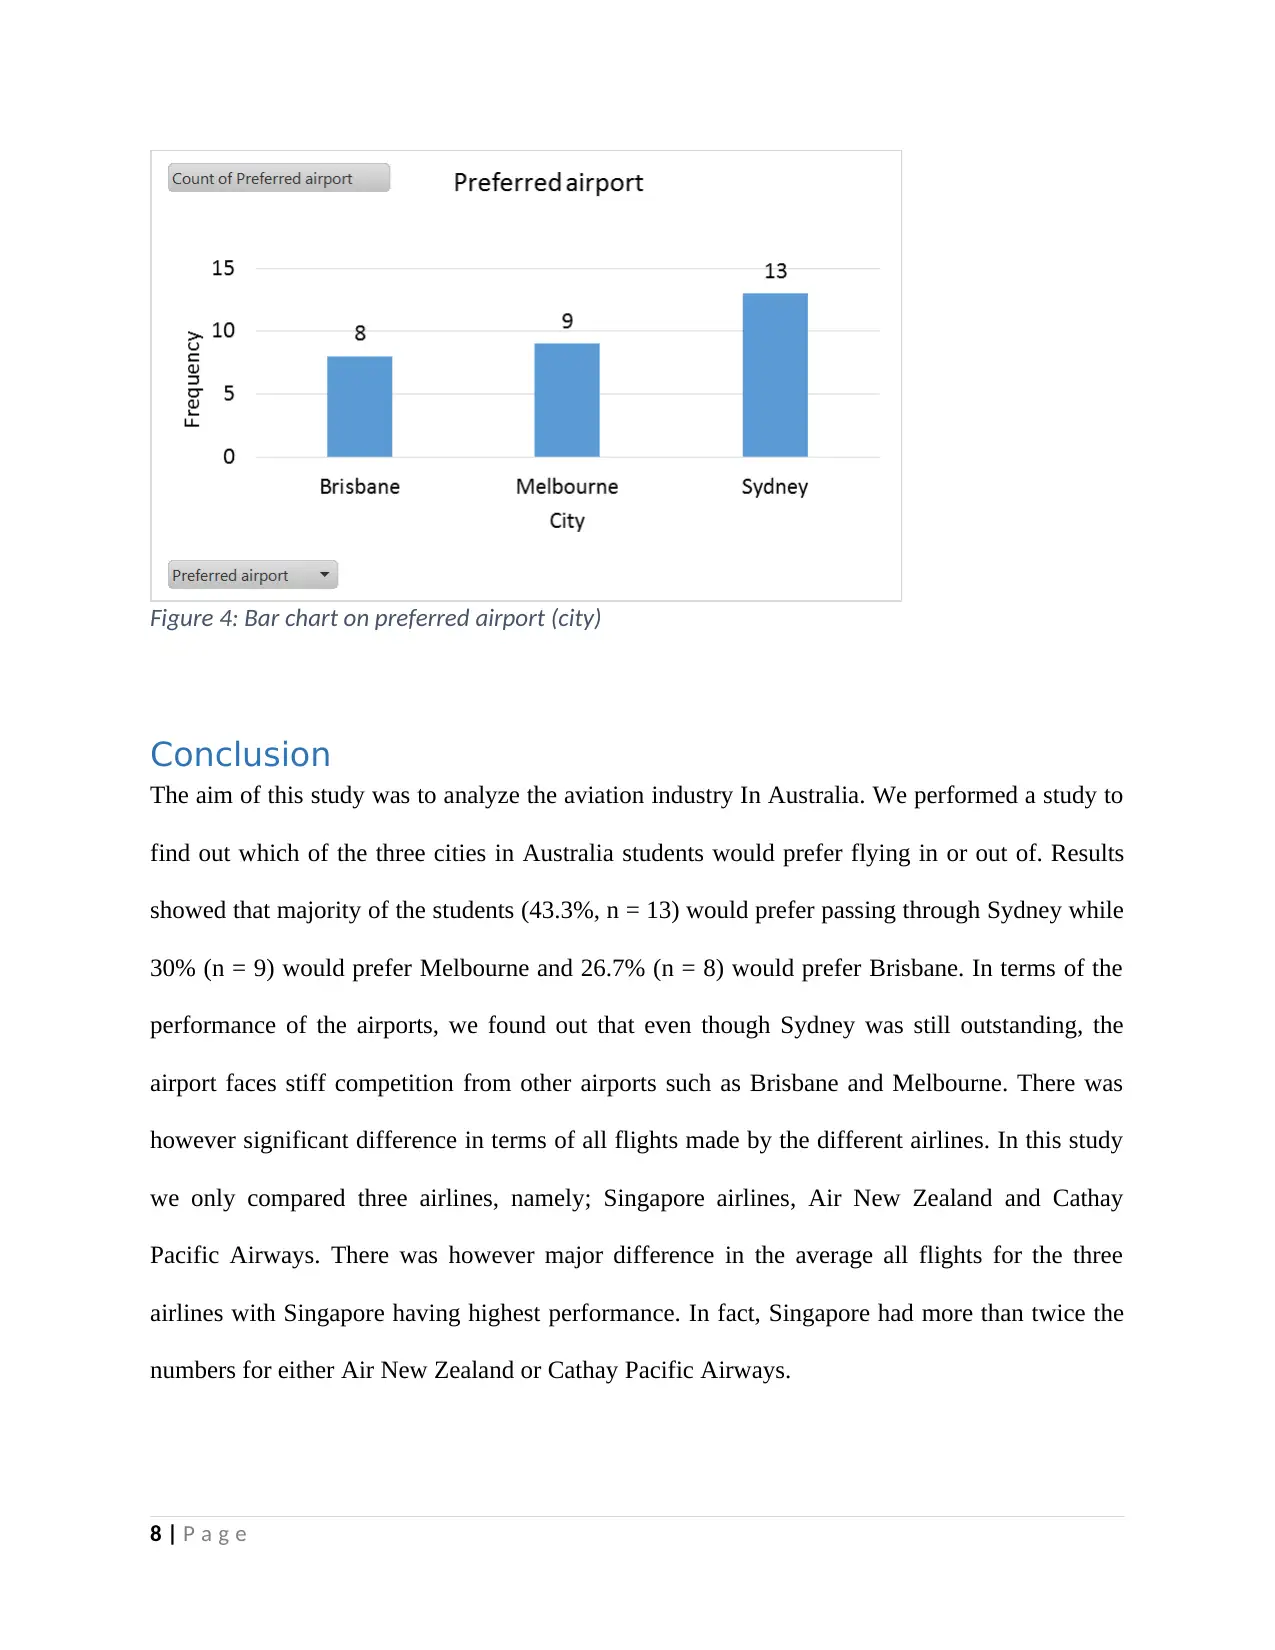
This report analyzes the Australian aviation industry using statistical methods, including descriptive statistics, hypothesis testing, and comparative analysis. The study examines a dataset of 1000 observations to assess airport performance and airline preferences. A survey of KOI University students reveals that Sydney is the preferred airport city, though Melbourne and Brisbane offer significant competition. The analysis of airline data indicates substantial performance differences, with Singapore Airlines outperforming Air New Zealand and Cathay Pacific Airways. The report concludes with recommendations based on the statistical findings, providing valuable insights for improving airport services. Desklib provides access to similar solved assignments and past papers for students.

Statistics
Student Name:
Student Number:
Course Instructor:
Date: 24th January 2019
1 | P a g e
Student Name:
Student Number:
Course Instructor:
Date: 24th January 2019
1 | P a g e
Paraphrase This Document
Need a fresh take? Get an instant paraphrase of this document with our AI Paraphraser

Table of Contents
Executive summary.........................................................................................................................3
1. Section 1: Introduction................................................................................................................4
2. Section 2: Analysis of single variable in Dataset 1.....................................................................4
Summary Statistics.......................................................................................................................4
3. Section 3: Analysis of two variables in Dataset 1.......................................................................6
Section 4: Collect and analysis Dataset2........................................................................................7
Conclusion.......................................................................................................................................8
2 | P a g e

Executive summary
The aim of this study was to analyze the aviation industry in Australia. We performed a study to
find out which of the three cities in Australia students would prefer flying in or out of. A sample
of 1000 observations was used to make analysis and inferences. We also performed a survey on a
sample of 30 randomly selected KOI university students. Results showed that majority of the
students (43.3%, n = 13) would prefer passing through Sydney while 30% (n = 9) would prefer
Melbourne and 26.7% (n = 8) would prefer Brisbane. In terms of the performance of the airports,
we found out that even though Sydney was still outstanding, the airport faces stiff competition
from other airports such as Brisbane and Melbourne. There was however significant difference in
terms of all flights made by the different airlines. In this study we only compared three airlines,
namely; Singapore airlines, Air New Zealand and Cathay Pacific Airways. There was however
major difference in the average all flights for the three airlines with Singapore having highest
performance. In fact, Singapore had more than twice the numbers for either Air New Zealand or
Cathay Pacific Airways.
3 | P a g e
⊘ This is a preview!⊘
Do you want full access?
Subscribe today to unlock all pages.

Trusted by 1+ million students worldwide

1. Section 1: Introduction
The aim of this study was to analyze the aviation industry in Australia. We employ different kind
of datasets for analysis purposes.
Dataset 1 comprises of a total of 1000 cases and has about 14 variables. This is a primary dataset
and it has variables ranging from different scale measurements (Bellavance, et al., 2009). We
have nominal variables as well categorical and continuous variables.
Dataset 2 also is a primary dataset that was collected among the KOI students. The survey sought
to find out which of the three airport cities the students would want to fly in or out of (YangJing ,
2009). The samples were randomly selected such each and every participant had an equal chance
of being included in the study (Aldrich, 2015). However, the study is limited by the fact that a
small sample size was employed which limits generalization (Fossey, et al., 2010). Future study
should ensure we have a larger sample size (Leech & Onwuegbuzie, 2009).
2. Section 2: Analysis of single variable in Dataset 1
Summary Statistics
The mean number of flights as can be seen in the table below is 24.53 with the median number of
flights recorded being 22 while the mode is 30. The standard deviation is 19.97 while the
skewness value is 2.27. The value of the skewness shows that the data is highly skewed with a
positive skewness.
Table 1: Descriptive statistics for All Flights
Mean 24.53
Standard Error 0.63
Median 22.00
Mode 31.00
Standard Deviation 19.97
Sample Variance 398.94
Kurtosis 8.54
4 | P a g e
Paraphrase This Document
Need a fresh take? Get an instant paraphrase of this document with our AI Paraphraser

Skewness 2.27
Range 150
Minimum 1
Maximum 151
Sum 24526
Count 1000
Figure 1: Histogram on all air flights
In the above figure, we present the histogram for all the flights. As can be seen from the plot, the
data is not normally distributed but rather skewed to the right.
For the inferential analysis, the study sought to find out whether the number of flights were
significantly more than 30. The hypothesis is given as follows;
H0: The number of flights is equal to 30
HA: The number of flights is not equal to 30
The results of the test are presented below;
Table 2: One-Sample Statistics
N Mean Std. Deviation Std. Error Mean
All Flight 1000 24.5260 19.97359 .63162
From table 2 above, we can see that the mean number of flights is 24.53 with a standard
deviation of 19.97. The error of the standard mean is 0.63.
5 | P a g e

Table 3: One-Sample Test
Test Value = 30
t df Sig. (2-tailed) Mean Difference 95% Confidence Interval of the
Difference
Lower Upper
All Flight -8.667 999 .000 -5.47400 -6.7135 -4.2345
The p-value for the one-sample t-test is 0.000 (a value greater than 5% level of significance)
implying that the null hypothesis is rejected. By rejecting the null hypothesis we conclude that
the average number of flights is significantly equal to 30.
3. Section 3: Analysis of two variables in Dataset 1
In this section we present the numerical summary of all flights in three Australian cities
Table 4: Numerical summary
City Average all flight
Brisbane 23.06
Melbourne 24.12
Sydney 26.94
The above results shows that the mean number of flights in Brisbane is 23.06 while that in
Melbourne and Sydney are 24.12 and 26.94 respectively. The results shows that the number
flights for the three cities does not significantly vary (Fotheringham & Wong, 2011). However,
Sydney still stands out among the three cities in terms of the number of flights recorded.
Figure 2: Bar chart on all flights based on the cities (airports)
6 | P a g e
⊘ This is a preview!⊘
Do you want full access?
Subscribe today to unlock all pages.

Trusted by 1+ million students worldwide

In this section we present the numerical summary of all flights in three airlines
Airline Average all flights
Singapore Airlines 79.44
Air New Zealand 30.70
Cathay Pacific Airways 26.93
The above results shows that the mean number of flights in Singapore is 79.44 while that in Air
New Zealand and Cathay Pacific Airways are 30.70 and 26.93 respectively. The results shows
that the number flights for the three airlines significantly vary with Singapore having the most
outstanding number of flights. Air New Zealand and Cathay Pacific airways are almost having
the same number of flights.
Section 4: Collect
and analysis
Dataset2
Most students interviewed
(43.3%, n = 13) said to prefer
flying and out through the
airport in Sydney. 30% (n = 9) of the students interviewed would however prefer Melbourne
while 26.7% (n = 8) of the students said to prefer Brisbane.
7 | P a g e
Figure 3: Bar chart on all flights based on the airlines
Paraphrase This Document
Need a fresh take? Get an instant paraphrase of this document with our AI Paraphraser

Figure 4: Bar chart on preferred airport (city)
Conclusion
The aim of this study was to analyze the aviation industry In Australia. We performed a study to
find out which of the three cities in Australia students would prefer flying in or out of. Results
showed that majority of the students (43.3%, n = 13) would prefer passing through Sydney while
30% (n = 9) would prefer Melbourne and 26.7% (n = 8) would prefer Brisbane. In terms of the
performance of the airports, we found out that even though Sydney was still outstanding, the
airport faces stiff competition from other airports such as Brisbane and Melbourne. There was
however significant difference in terms of all flights made by the different airlines. In this study
we only compared three airlines, namely; Singapore airlines, Air New Zealand and Cathay
Pacific Airways. There was however major difference in the average all flights for the three
airlines with Singapore having highest performance. In fact, Singapore had more than twice the
numbers for either Air New Zealand or Cathay Pacific Airways.
8 | P a g e

References
Aldrich, J., 2015. Fisher and Regression. Statistical Science, 20(4), p. 401–417.
Bellavance, F., Georges , D. & Martin , L., 2009. The value of a statistical life: A meta-analysis
with a mixed effects regression model. Journal of Health Economics, 28(2), pp. 444-464.
Fossey, E., Harvey, C., McDermott, F. & Davidson, L., 2010. Understanding and evaluating
qualitative research. Australian and New Zealand Journal of Psychiatry, 36(6), pp. 717-732.
Fotheringham, A. S. & Wong, D. W., 2011. The modifiable areal unit problem in multivariate
statistical analysis. Environment and Planning, 23(7), p. 1025–1044.
Leech, N. & Onwuegbuzie, A., 2009. An array of qualitative data analysis tools: A call for data
analysis triangulation. School Psychology Quarterly, 22(4), pp. 557-584.
YangJing , L., 2009. Human age estimation by metric learning for regression problems.
International Conference on Computer Analysis of Images and Patterns, 6(3), p. 74–82.
9 | P a g e
⊘ This is a preview!⊘
Do you want full access?
Subscribe today to unlock all pages.

Trusted by 1+ million students worldwide
1 out of 9
Related Documents

Your All-in-One AI-Powered Toolkit for Academic Success.
+13062052269
info@desklib.com
Available 24*7 on WhatsApp / Email
Unlock your academic potential
Copyright © 2020–2025 A2Z Services. All Rights Reserved. Developed and managed by ZUCOL.