BUS708: Statistical Modelling & Data Analysis of NSW Transport
VerifiedAdded on 2023/06/04
|10
|1794
|100
Report
AI Summary
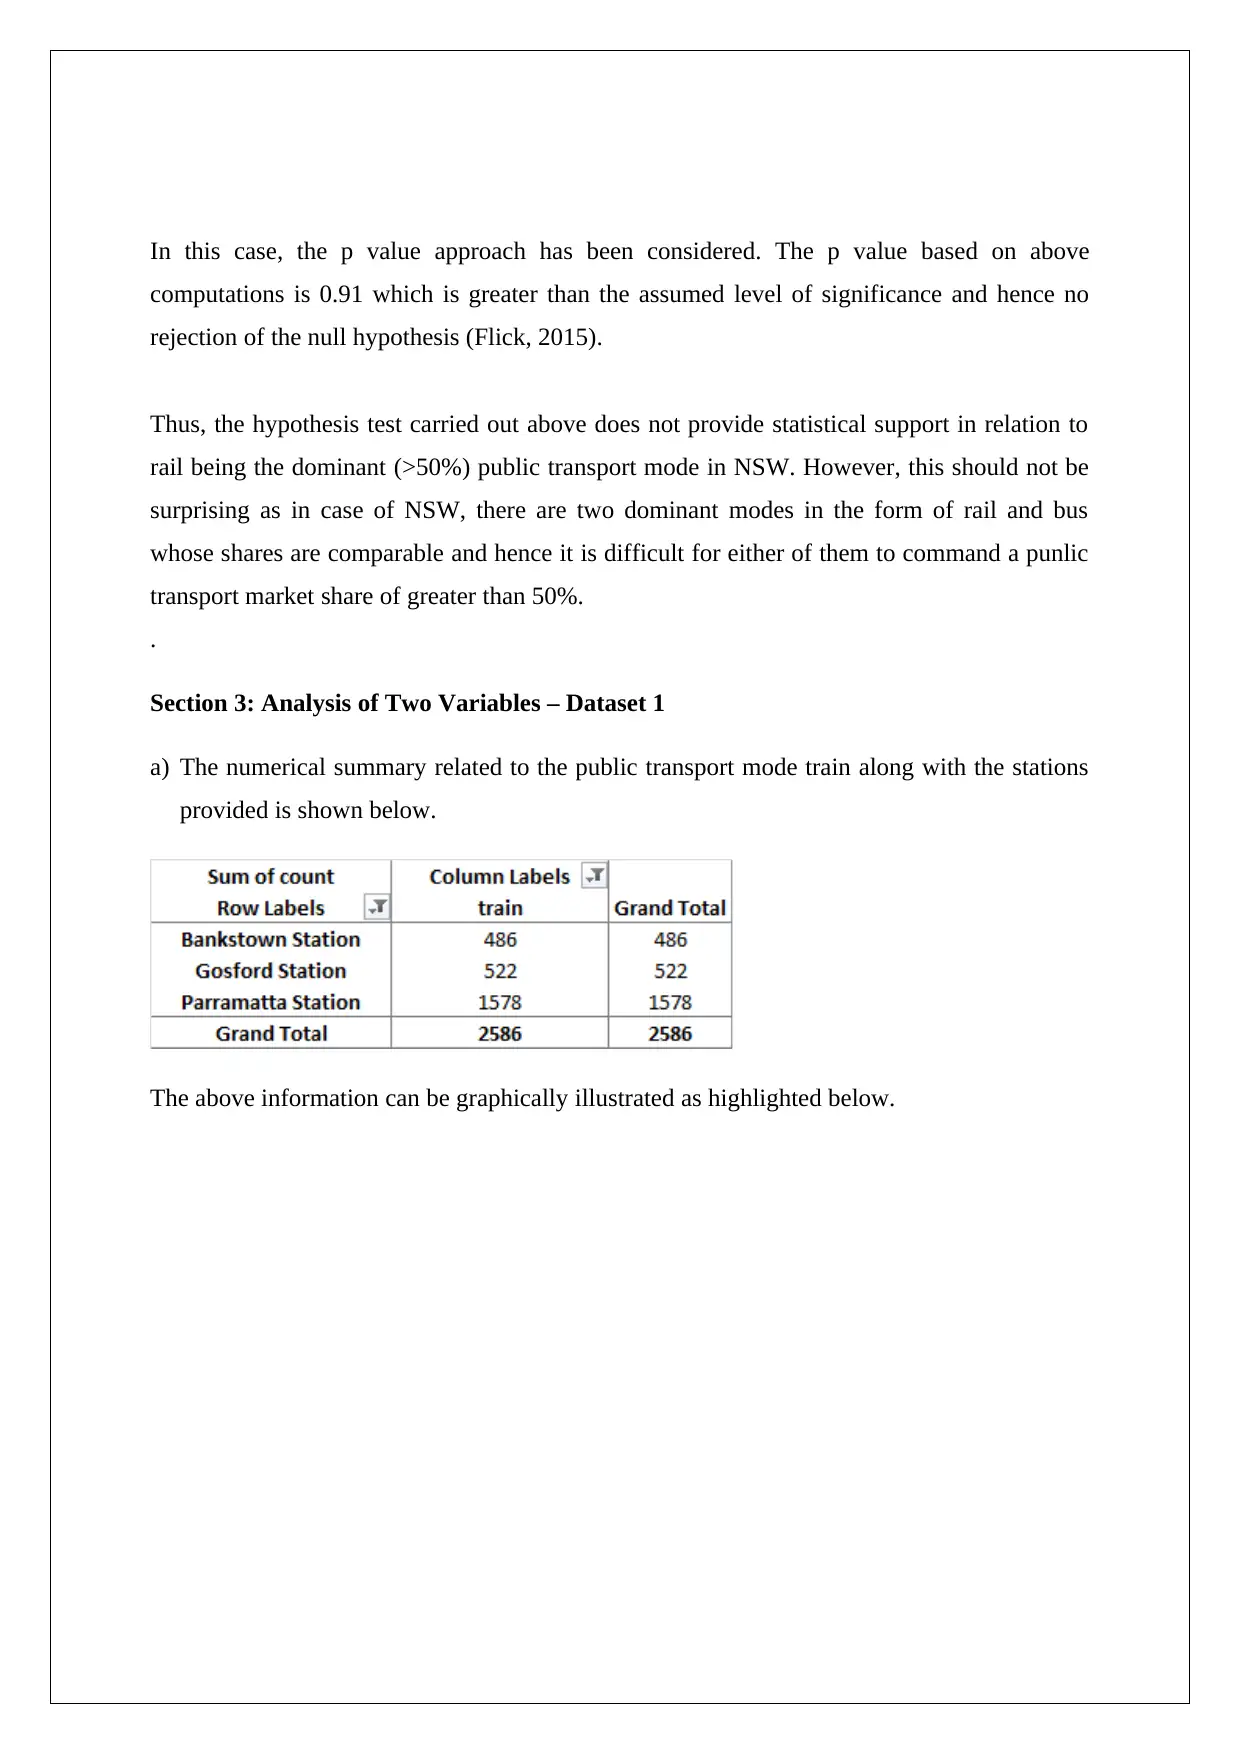
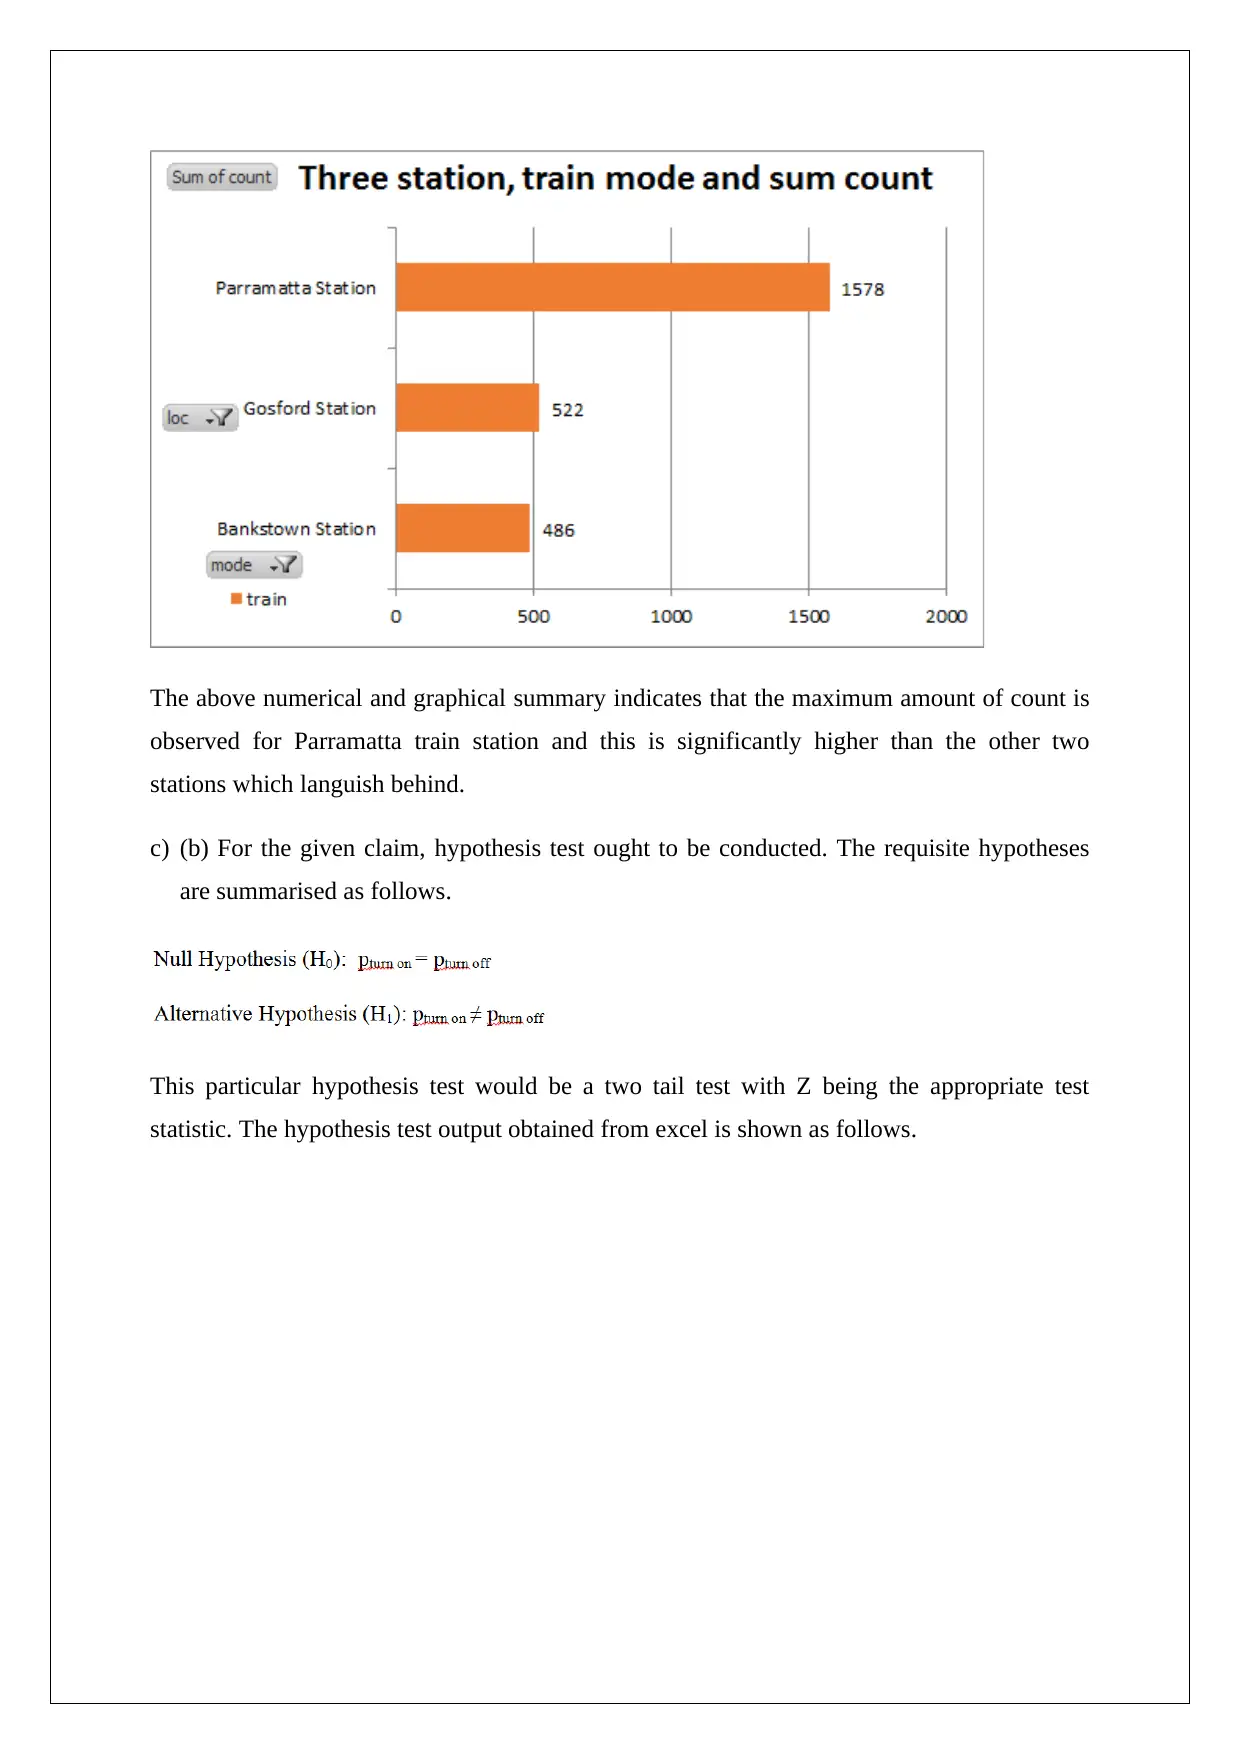
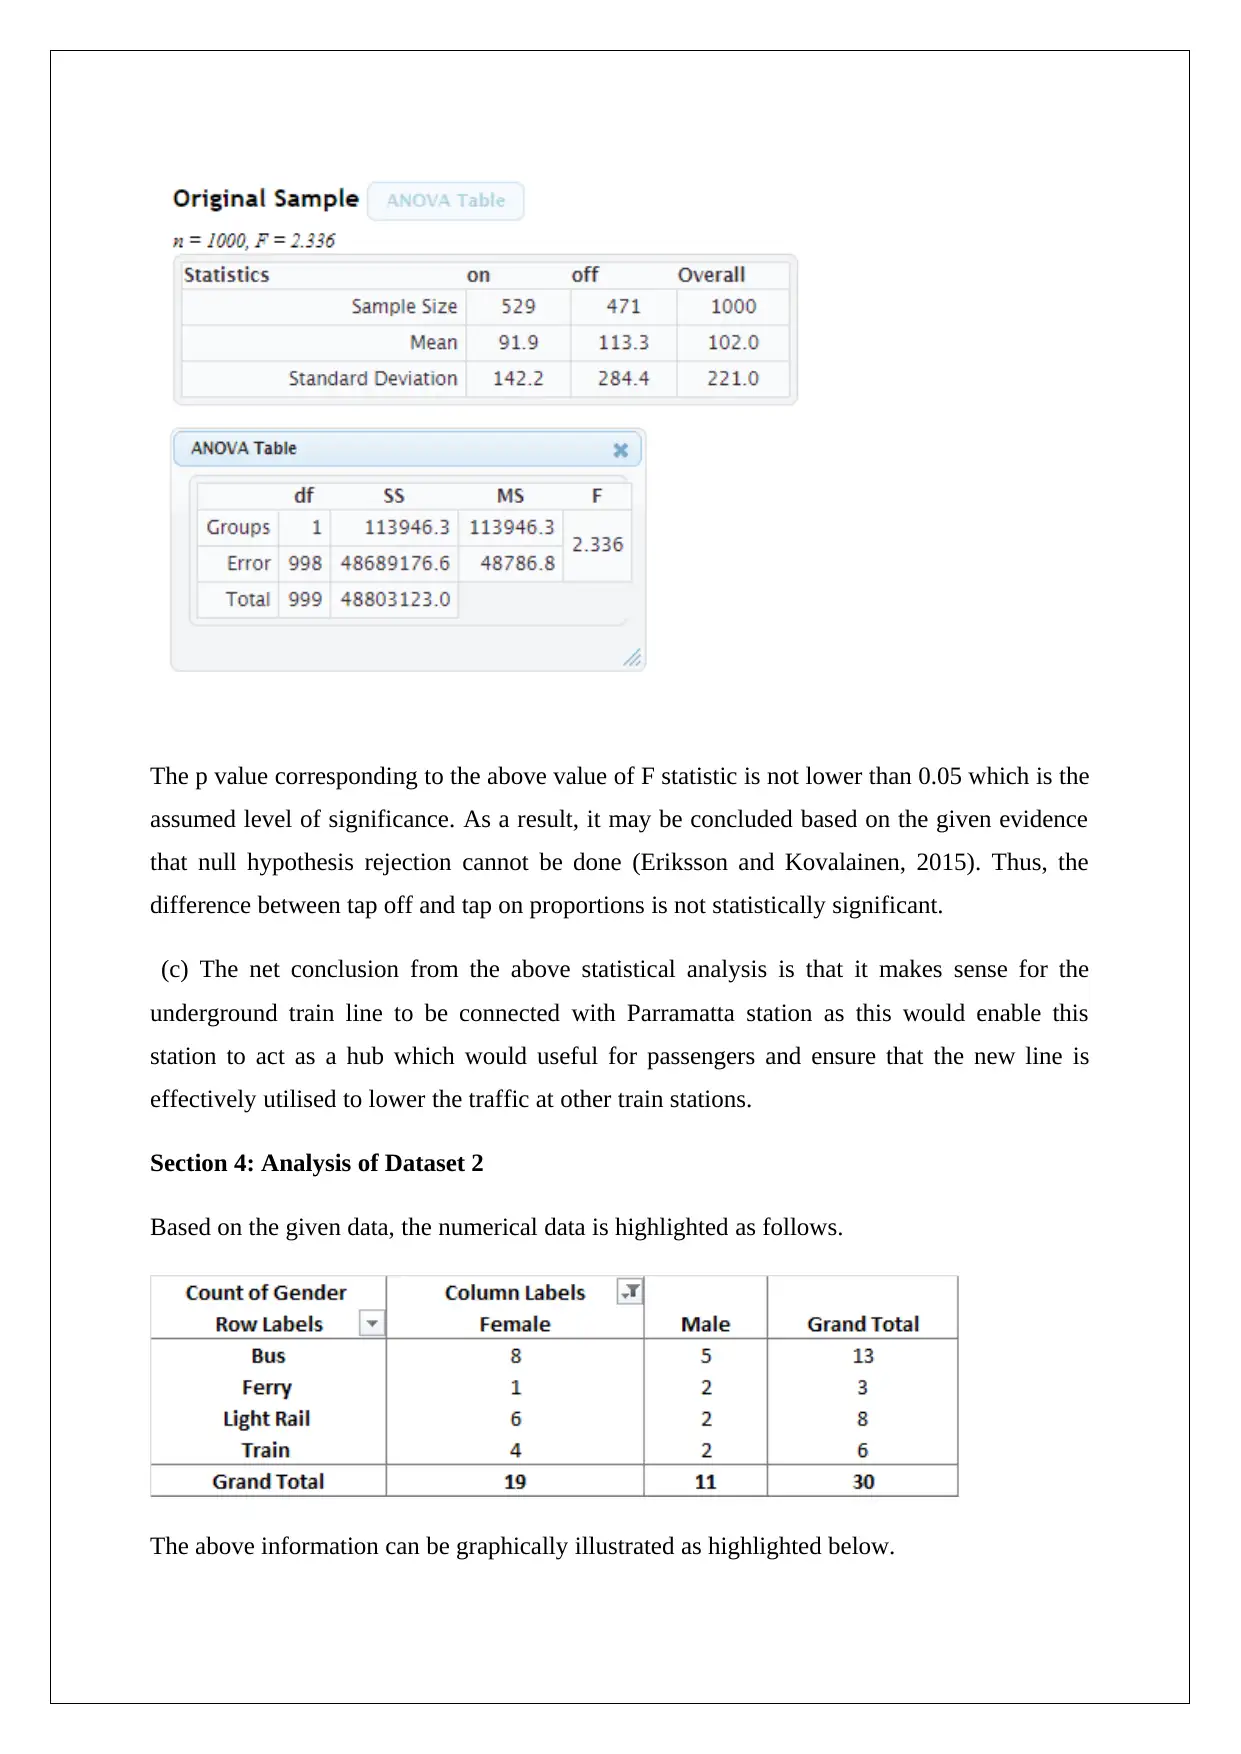
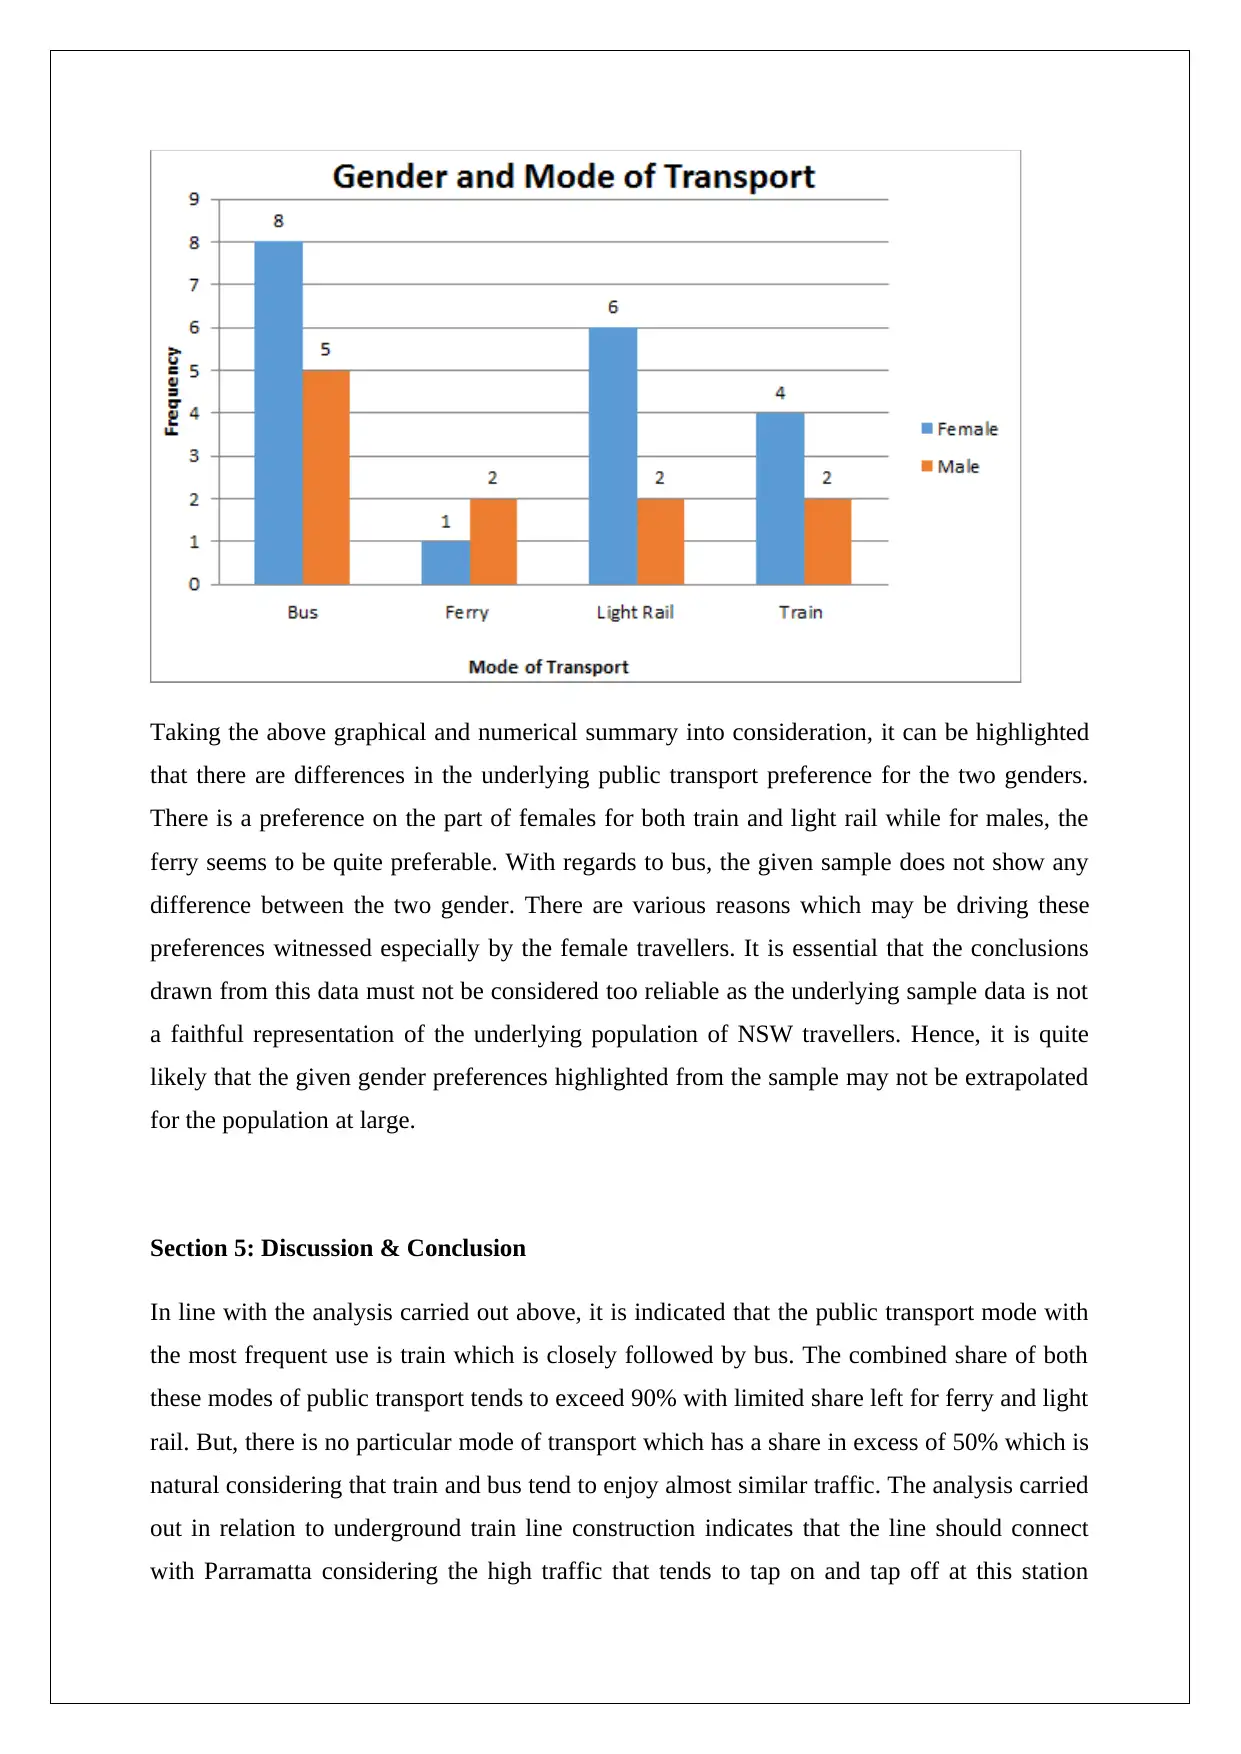
This report presents a statistical analysis of public transport usage in NSW, focusing on data from two datasets. Dataset 1 provides information on transport mode, date, tap, time, count, and location, revealing that train and bus are the most frequently used modes. Hypothesis testing is conducted to assess claims about rail dominance and tap-on/tap-off proportions at Parramatta station, suggesting its potential as a transport hub. Dataset 2 explores gender-based preferences in transport mode, indicating differences between male and female travelers, but cautions against over-generalization due to sample limitations. The report concludes with recommendations for future research, including longitudinal studies and consideration of extraneous factors influencing transport mode choices. Desklib offers a variety of similar solved assignments for students.
Contribute Materials
Your contribution can guide someone’s learning journey. Share your
documents today.

STATISTICAL MODELLING
STUDENT ID:
[Pick the date]
STUDENT ID:
[Pick the date]
Secure Best Marks with AI Grader
Need help grading? Try our AI Grader for instant feedback on your assignments.

Section 1: Introduction
a) As the urban cities grow in size and population, an additional strain is developing on the
transport infrastructure which requires continuous investments in order to provide quick,
efficient and affordable mobility options to the dwellers. This is why there are timetable
changes and alternative overhauls in the routes of various modes of public transport so as
to cater to the highest amount of people and enhance efficiency. For determining these
changes in timetables and routes, the relevant departments tend to use the expertise of
dedicated agencies involved in research regarding public transportation system and the
behaviour and preferences of the passengers who use the same (Meyers, 2017). These
inputs are critical in order to ensure that changes brought are useful to the people at large
and ensure that maximise usage of the available infrastructure can be done so as to avoid
undue congestion at roads. Failure in this regards would lead to significant burden on the
ailing city infrastructure coupled with environmental factors involved especially climate
change.
b) A primary dataset is collected by the researcher which is not the case here as the
underlying data has been obtained by the university from a particular website. The website
has originally collected this data. Thus, the concerned data would be classified as
secondary (Eriksson and Kovalainen, 2015). The given dataset comprises of six variables
namely mode, date, tap, time, count and location.
Mode is represented using nominal scale and is a categorical variable. Date is represented
using ordinal scale since natural alignment is possible. Tap is represented using nominal
scale and is a categorical variable. Time is represented using internal scale and is a
quantitative or numerical variable. Count is represented using ratio measurement and is a
quantitative or numerical variable. Location is represented using nominal scale and is a
categorical variable (Flick, 2015). The various cases that arise in the given study
correspond to the difference in preference and travel behaviour of the individuals which
has been recorded and presented in the form of dated data.
c) The dataset 2 comprises of data which has been collected on the basis of surveying with 30
respondents. Only two variables have been reported in regards to these respondents i.e.

gender and mode of public transport. This dataset is primary as this has been collected
through the use of survey with the respondents (Hair et. al., 2015). However, this does not
imply that the accuracy of this dataset would be higher than dataset 1. This is because of the
low sample size of 30 observations coupled with use of non-probability sampling technique.
This makes the sample not being an accurate description of the underlying population
(Eriksson and Kovalainen, 2015). Gender and mode of transport both are represented using
nominal scale and are categorical variables (Hillier, 2016).
Section 2: Single variable Analysis – Dataset 1
a) The numerical summary related to the public transport usage during the given period is
highlighted below.
The above information can be graphically illustrated as highlighted below.

The numerical and graphical summary highlighted above clearly reflects that train is the most
popular mode of public transport as it has the highest frequency in the given sample data. The
corresponding frequency of usage of bus is also not much behind which implies that other
modes such as ferry and light rail have limited use only as public transport means.
Considering the high amount of traffic being handled by bus and train, it makes sense for the
government to invest in the existing infrastructure related to these two modes while ensuring
higher use of the other means so as to lower the dependence on these two modes of public
transport.
b) For the given claim, hypothesis test ought to be conducted. The requisite hypotheses are
summarised as follows.
The sample proportion has been found considered 1000 as the sample size and 479 being the
value of the favourable cases i.e. rail travel. The relevant output with regards to hypothesis
test is shown as follows.
Secure Best Marks with AI Grader
Need help grading? Try our AI Grader for instant feedback on your assignments.

In this case, the p value approach has been considered. The p value based on above
computations is 0.91 which is greater than the assumed level of significance and hence no
rejection of the null hypothesis (Flick, 2015).
Thus, the hypothesis test carried out above does not provide statistical support in relation to
rail being the dominant (>50%) public transport mode in NSW. However, this should not be
surprising as in case of NSW, there are two dominant modes in the form of rail and bus
whose shares are comparable and hence it is difficult for either of them to command a punlic
transport market share of greater than 50%.
.
Section 3: Analysis of Two Variables – Dataset 1
a) The numerical summary related to the public transport mode train along with the stations
provided is shown below.
The above information can be graphically illustrated as highlighted below.

The above numerical and graphical summary indicates that the maximum amount of count is
observed for Parramatta train station and this is significantly higher than the other two
stations which languish behind.
c) (b) For the given claim, hypothesis test ought to be conducted. The requisite hypotheses
are summarised as follows.
This particular hypothesis test would be a two tail test with Z being the appropriate test
statistic. The hypothesis test output obtained from excel is shown as follows.

The p value corresponding to the above value of F statistic is not lower than 0.05 which is the
assumed level of significance. As a result, it may be concluded based on the given evidence
that null hypothesis rejection cannot be done (Eriksson and Kovalainen, 2015). Thus, the
difference between tap off and tap on proportions is not statistically significant.
(c) The net conclusion from the above statistical analysis is that it makes sense for the
underground train line to be connected with Parramatta station as this would enable this
station to act as a hub which would useful for passengers and ensure that the new line is
effectively utilised to lower the traffic at other train stations.
Section 4: Analysis of Dataset 2
Based on the given data, the numerical data is highlighted as follows.
The above information can be graphically illustrated as highlighted below.
Paraphrase This Document
Need a fresh take? Get an instant paraphrase of this document with our AI Paraphraser

Taking the above graphical and numerical summary into consideration, it can be highlighted
that there are differences in the underlying public transport preference for the two genders.
There is a preference on the part of females for both train and light rail while for males, the
ferry seems to be quite preferable. With regards to bus, the given sample does not show any
difference between the two gender. There are various reasons which may be driving these
preferences witnessed especially by the female travellers. It is essential that the conclusions
drawn from this data must not be considered too reliable as the underlying sample data is not
a faithful representation of the underlying population of NSW travellers. Hence, it is quite
likely that the given gender preferences highlighted from the sample may not be extrapolated
for the population at large.
Section 5: Discussion & Conclusion
In line with the analysis carried out above, it is indicated that the public transport mode with
the most frequent use is train which is closely followed by bus. The combined share of both
these modes of public transport tends to exceed 90% with limited share left for ferry and light
rail. But, there is no particular mode of transport which has a share in excess of 50% which is
natural considering that train and bus tend to enjoy almost similar traffic. The analysis carried
out in relation to underground train line construction indicates that the line should connect
with Parramatta considering the high traffic that tends to tap on and tap off at this station

which highlights the potential of this station to act as a hub. Besides, dataset 2 primarily
relates to preferences of the two gender in relation to usage of public transport where it has
been noticed that females tend to prefer train and light rail unlike males who have a
preference for ferry. However, more research is required in this regards as the given sample
in Dataset 2 is not a reliable representation of the population of interest.
In relation to suggests for conducting future research, it makes sense for similar exercise to be
repeated at various times of the years so as to ensure that the behaviour and usage of various
public transport modes does not significantly differ. Considering the amount of capital
expenditure involved in building enabling infrastructure, the research needs to consider
various extraneous factor influencing behaviour such as presence of any discounts on any
particular transport mode. Besides, more research is required on the underlying reasons why
people prefer to choose a particular mode of public transport which would allow
improvements in the service level and the future planning of urban transport infrastructure.

References
Eriksson, P. and Kovalainen, A. (2015) Quantitative methods in business research 3rd ed.
London: Sage Publications.
Flick, U. (2015) Introducing research methodology: A beginner's guide to doing a research
project. 4th ed. New York: Sage Publications.
Hair, J. F., Wolfinbarger, M., Money, A. H., Samouel, P., and Page, M. J. (2015) Essentials
of business research methods. 2nd ed. New York: Routledge.
Hillier, F. (2016) Introduction to Operations Research 6th ed. New York: McGraw Hill
Publications.
Mayers, L. (2017) Greater Sydney and NSW public transport undergo state's 'largest'
timetable overhaul ever, [online] Available at http://www.abc.net.au/news/2017-11-26/new-
sydney-and-nsw-public-transport-timetable-launched/9194538 (Assessed September 19,
2018)
1 out of 10
Related Documents

Your All-in-One AI-Powered Toolkit for Academic Success.
+13062052269
info@desklib.com
Available 24*7 on WhatsApp / Email
Unlock your academic potential
© 2024 | Zucol Services PVT LTD | All rights reserved.