BUS708 Statistical Modelling: Analysis of NSW Transport System Data
VerifiedAdded on 2023/06/07
|13
|2758
|315
Report
AI Summary
This report provides a statistical analysis of the NSW transport system, utilizing two datasets to answer research questions related to public transport usage and potential improvements. The analysis includes descriptive statistics and hypothesis testing to determine the most used modes of transport, differences in tap on/off counts, and preferred locations for infrastructure development. The study uses both primary data collected via an online survey and secondary data from the Opal ticketing system. The findings suggest that trains are the most favored mode of transport, and Parramatta is the preferred location for building an underground railway line to the central business district. The report concludes with recommendations for the NSW government to invest in train services and consider Parramatta for infrastructure projects.

Statistical Modelling 1
Statistical Modelling
Name of Student
Course
Tutor
University
City/State
Statistical Modelling
Name of Student
Course
Tutor
University
City/State
Paraphrase This Document
Need a fresh take? Get an instant paraphrase of this document with our AI Paraphraser
Statistical Modelling 2
Statistical Modelling
1 (a)
Transport and logistics industry one of the most important sector in the economy of Australia.
The size of the country and vast distances between major urban centres implies that many
consumers and businesses rely on the efficiency of freight businesses for access to many vital
products. For that reason, ensuring that the sector operates safely and effectively is of critical
concern. Yet, incomplete structural reforms and insufficient investments continue to negatively
affect Australian economy in terms of revolutionising its large transport system. Urban transport
problems in Australia are increasing, as a consequence of inadequate traffic management and
weak policy coordination (Best of Business, 2016).
After years of decline, public transport investment in Australia is finally rising. But then again
the Australian’ government has been caught on the hop. Poor planning has contributed to dozens
of serviceable Hitachi trains being scrapped just as commuters began returning to the train
network in droves. Crowding on trains (in addition to bus and tram routes) has given rise to, and
mean the effect of just one cancelled service is severe. According to Wade (2014), the value of
transport lies not so much in the service itself, however in its power to allow people to move
around and enjoy the things that they consider necessary to them. As such, the improvement of
the transport in Australia should mostly focus on reliability, productivity, access and efficiency.
Decisions that are made by consumers about transport are very long-lived, not only compelling
people to years of infrastructure maintenance besides locking them into today’s usage and
technological innovations. With this knowledge, the focus of this paper is on the development of
Statistical Modelling 3
strategies to assess and improve the efficiency and performance of the transport industry in
Australia.
1 (b)
This dataset offers counts of tap ons and tap offs created on the Opal-ticketing system for the
duration of two non-consecutive weeks in 2016 (Open Data, 2016). This data is secondary data
as it was retrieved from the online site of Opal-ticketing system. According to Cooper and
Schindler (2014), secondary data constitutes data that has been gathered by somebody other than
the user. Conventional sources of secondary data include censuses, government publications,
peer-reviewed journals, newspapers, magazines etc. The advantages of secondary data are
several. First, they are economical in terms of time and resources. Second, secondary data offer a
basis for comparison for the data that is collected by other investigators. Third, secondary data
sources are readily available (Cooper & Schindler, 2014). Finally, secondary data helps improve
the understanding of the problem being investigated. On the other side, secondary data has been
faulted for various reasons including providing inappropriate data as the data is collected by
other people, lack of control by the researcher over data quality and quality issues.
The dataset, in this case, is constituted by both categorical and numeric variables. Categorical
variables according to Saunders et al. (2016), are variables that someone can assign categories,
but the groups have no natural order. In this case, the categorical variables in dataset 1 are the
mode of transport (train, bus and light rail), location, tap, and date. On the other side, the values
of a numerical variable are numbers (Fahimnia et al., 2013). The numeric variable in this data set
is time (which is a continuous variable) and count (which is a desecrate variable). Discrete can
be further categorized into continuous or discrete variables (Van Buuren., 2007). The discrete
⊘ This is a preview!⊘
Do you want full access?
Subscribe today to unlock all pages.
Trusted by 1+ million students worldwide
Statistical Modelling 4
variable only take on a finite number of values while continuous variable has an infinite number
of possible values (Saunders et al., 2016).
1 (c)
The dataset 2 is primary data as I collected it personally for a specific reason. According to
Nguyen and Tongzon (2010), primary data is an original data that is collected first-hand by the
investigator in a particular research project or project. Primary data has several advantages
according to researchers. First, primary data is very reliable as an investigator can duplicate the
procedure to check the validity of the results, as they understand how the data was gathered and
analysed (Cooper & Schindler, 2014). Second, primary data collection provides the latest data as
data obtained from previous years is less likely to answer the questions that a researcher wants to
address consistently. Lastly, primary data allow researchers to be subjective in types of data they
are gathering in line with the hypothesis they are trying to test. Regardless of the advantages of
primary data, this method of data collection is faulted for being expensive regarding resources
and time consuming (Nguyen and Tongzon, 2010).
The main methods of collecting primary data include direct observations, survey questionnaires,
and conducting interviews (oral or phone interviews) (Nguyen and Tongzon, 2010).). In our
contest, an online survey questionnaire was randomly distributed to the targeted respondents and
the responses recorded for analysis. Simple random sampling is a research technique where each
sample element of a given size has an equal chance of being selected ((Nguyen and Tongzon,
2010). The use of online questionnaire was preferred in this survey as it is less costly regarding
administration and is convenience as it enables respondents to participate in any study at any
place provided they are connected to the internet. Gadgets like mobile phones, tablets, pcs and
desktops usually allow participation or respondents in online surveys.
Paraphrase This Document
Need a fresh take? Get an instant paraphrase of this document with our AI Paraphraser
Statistical Modelling 5
The two variables of interest under this study were gender and mode of transport as the
investigator sought to investigate the relationship between the two. Since this was a small scale
survey, a total of 30 responses were recorded out of the 50 targeted responses, which represents a
60% response rate. Under this case, both gender (male and female) and mode of transport (train,
light rail and buses) are categorical variables.
2(a)
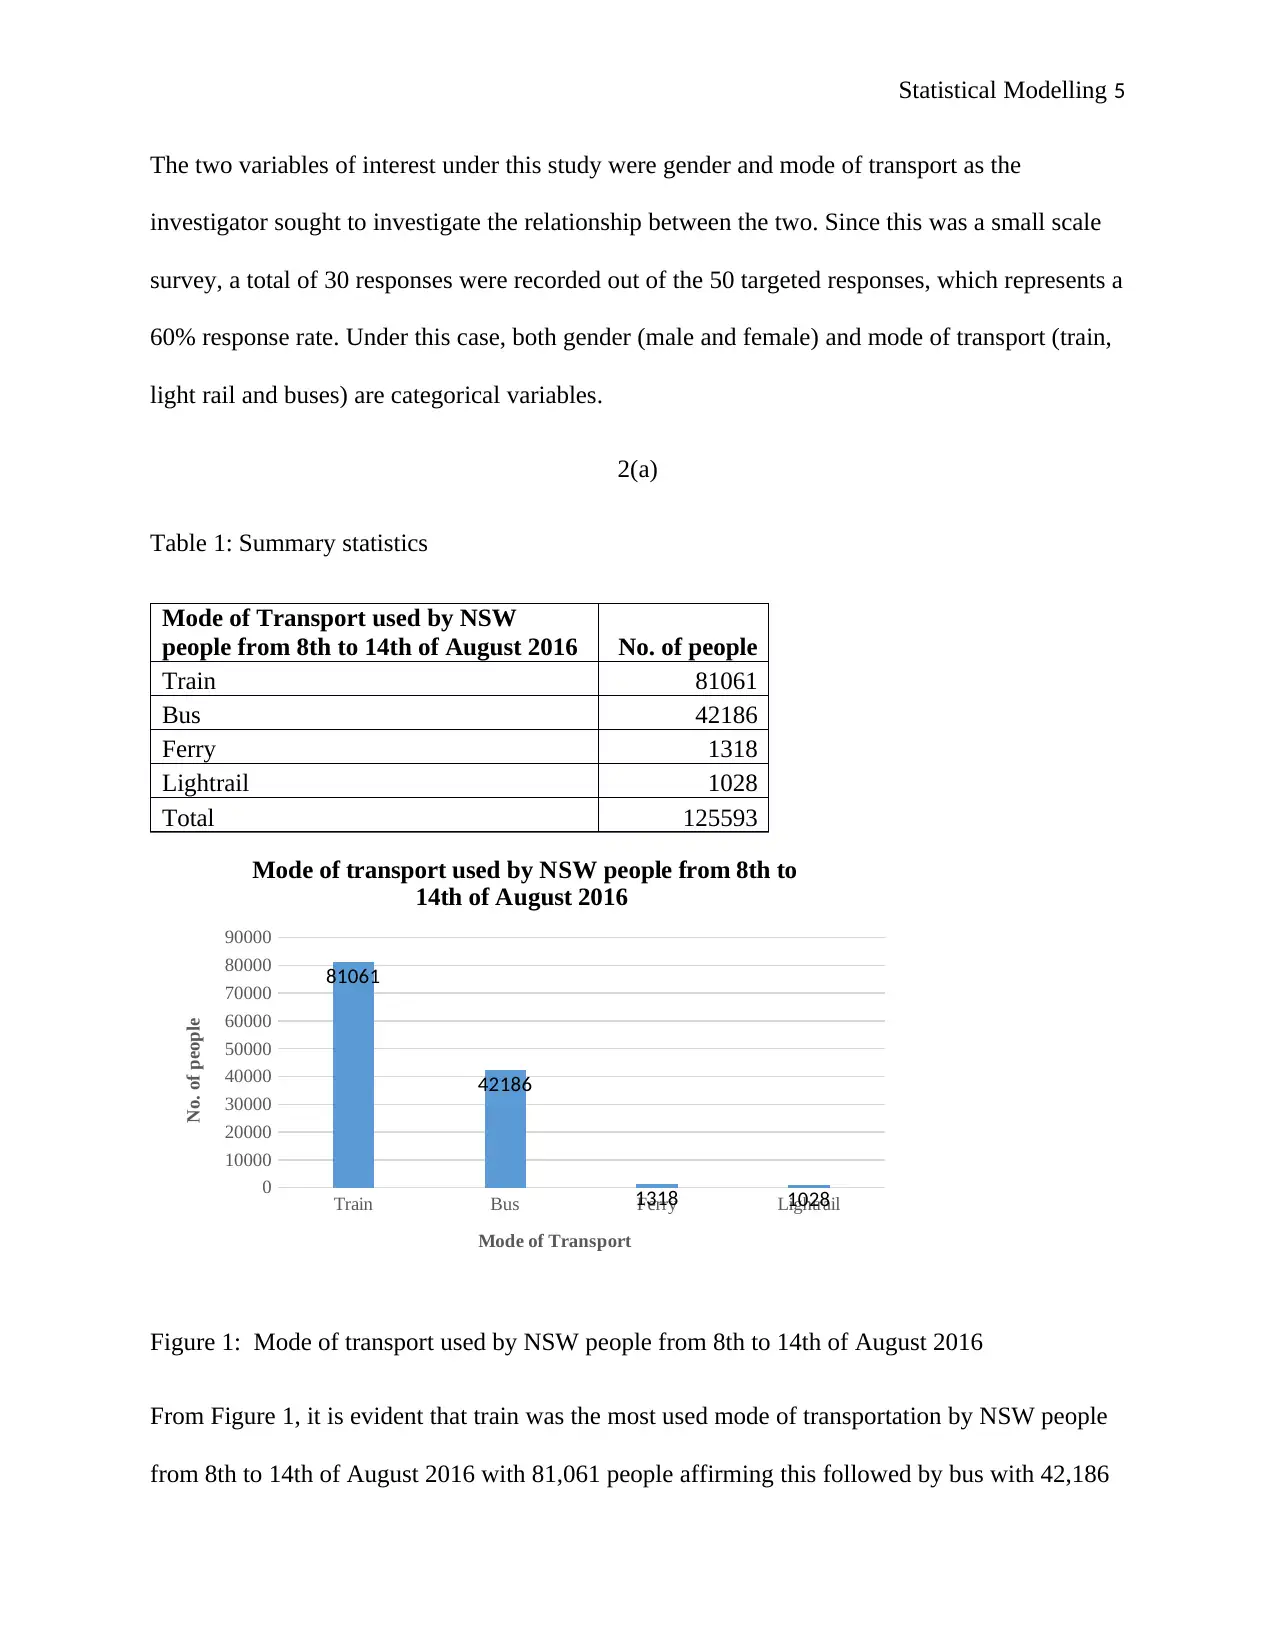
Table 1: Summary statistics
Mode of Transport used by NSW
people from 8th to 14th of August 2016 No. of people
Train 81061
Bus 42186
Ferry 1318
Lightrail 1028
Total 125593
Train Bus Ferry Lightrail
0
10000
20000
30000
40000
50000
60000
70000
80000
90000
81061
42186
1318 1028
Mode of transport used by NSW people from 8th to
14th of August 2016
Mode of Transport
No. of people
Figure 1: Mode of transport used by NSW people from 8th to 14th of August 2016
From Figure 1, it is evident that train was the most used mode of transportation by NSW people
from 8th to 14th of August 2016 with 81,061 people affirming this followed by bus with 42,186
The two variables of interest under this study were gender and mode of transport as the
investigator sought to investigate the relationship between the two. Since this was a small scale
survey, a total of 30 responses were recorded out of the 50 targeted responses, which represents a
60% response rate. Under this case, both gender (male and female) and mode of transport (train,
light rail and buses) are categorical variables.
2(a)
Table 1: Summary statistics
Mode of Transport used by NSW
people from 8th to 14th of August 2016 No. of people
Train 81061
Bus 42186
Ferry 1318
Lightrail 1028
Total 125593
Train Bus Ferry Lightrail
0
10000
20000
30000
40000
50000
60000
70000
80000
90000
81061
42186
1318 1028
Mode of transport used by NSW people from 8th to
14th of August 2016
Mode of Transport
No. of people
Figure 1: Mode of transport used by NSW people from 8th to 14th of August 2016
From Figure 1, it is evident that train was the most used mode of transportation by NSW people
from 8th to 14th of August 2016 with 81,061 people affirming this followed by bus with 42,186
Statistical Modelling 6
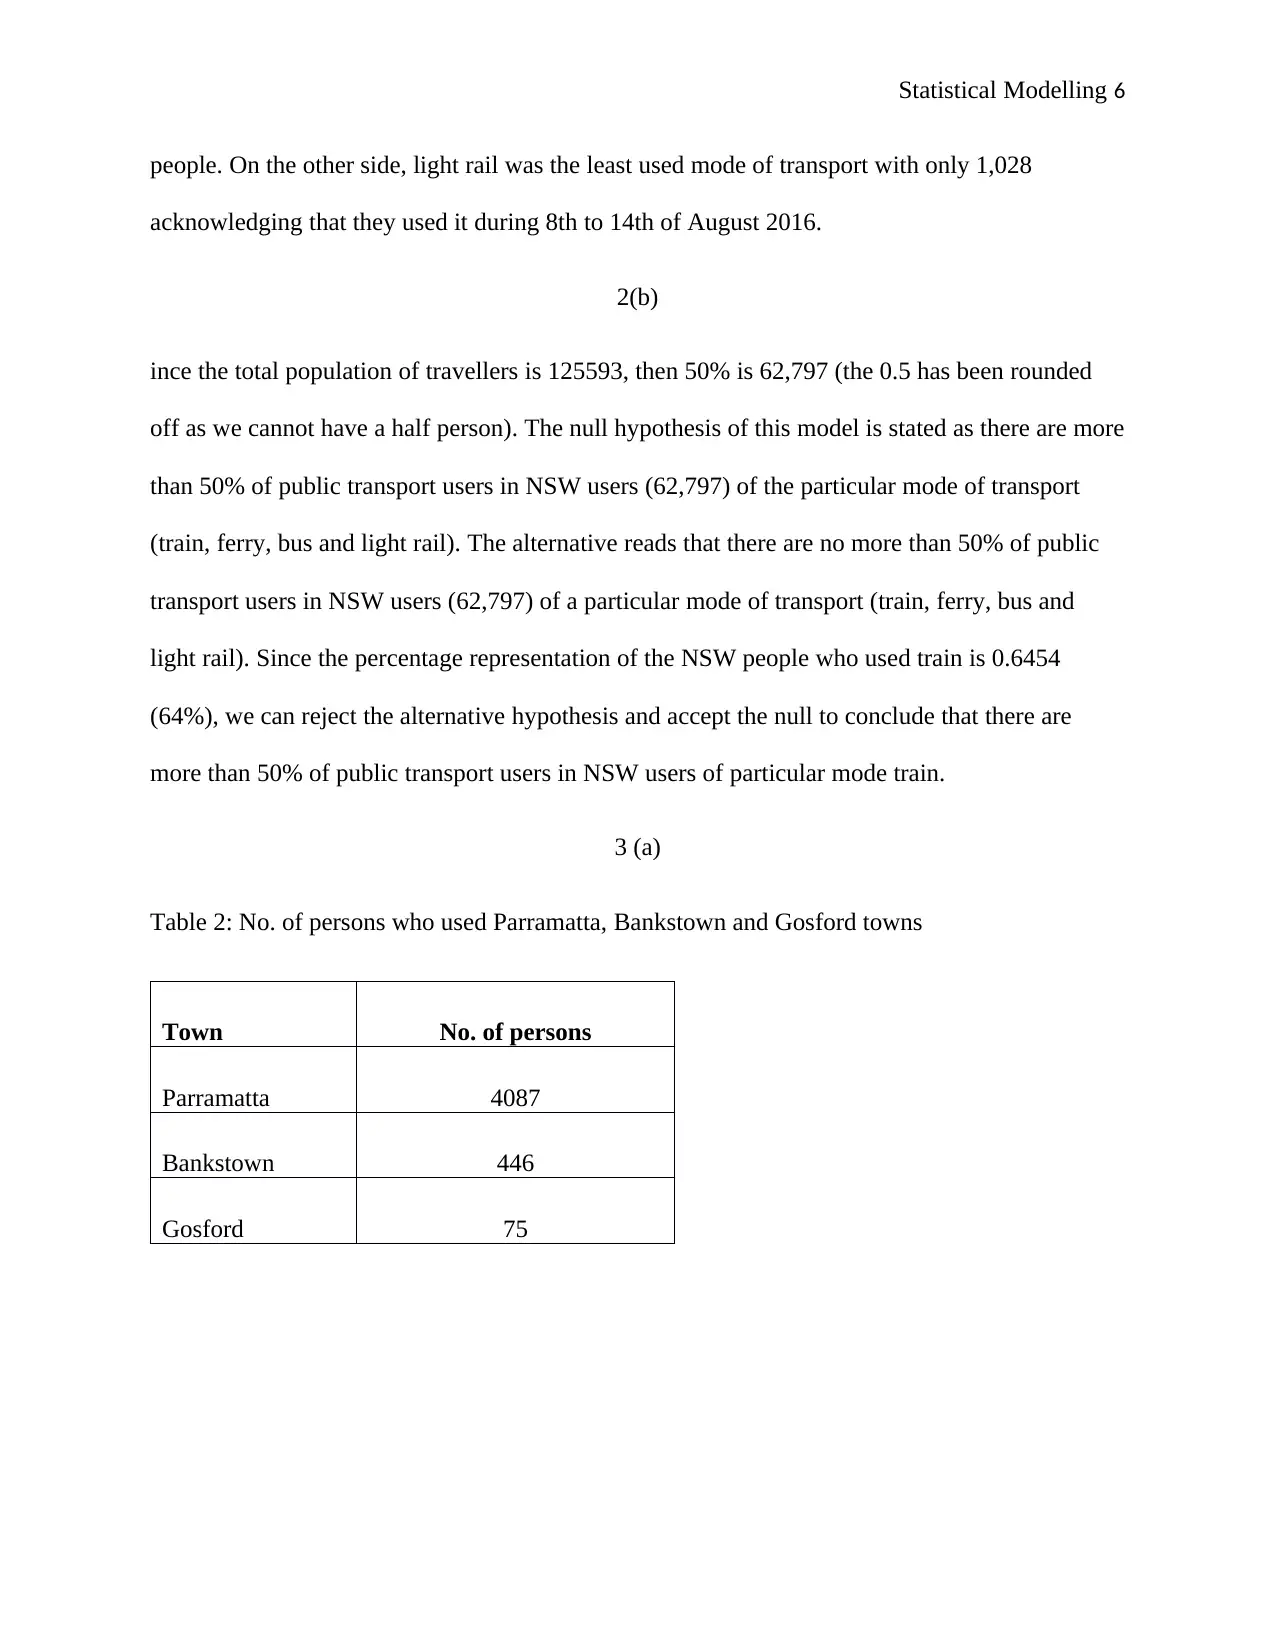
people. On the other side, light rail was the least used mode of transport with only 1,028
acknowledging that they used it during 8th to 14th of August 2016.
2(b)
ince the total population of travellers is 125593, then 50% is 62,797 (the 0.5 has been rounded
off as we cannot have a half person). The null hypothesis of this model is stated as there are more
than 50% of public transport users in NSW users (62,797) of the particular mode of transport
(train, ferry, bus and light rail). The alternative reads that there are no more than 50% of public
transport users in NSW users (62,797) of a particular mode of transport (train, ferry, bus and
light rail). Since the percentage representation of the NSW people who used train is 0.6454
(64%), we can reject the alternative hypothesis and accept the null to conclude that there are
more than 50% of public transport users in NSW users of particular mode train.
3 (a)
Table 2: No. of persons who used Parramatta, Bankstown and Gosford towns
Town No. of persons
Parramatta 4087
Bankstown 446
Gosford 75
⊘ This is a preview!⊘
Do you want full access?
Subscribe today to unlock all pages.
Trusted by 1+ million students worldwide
Statistical Modelling 7
89%
10%
2%
Persons who used different towns to access train
services
Parramatta Bankstown Gosford
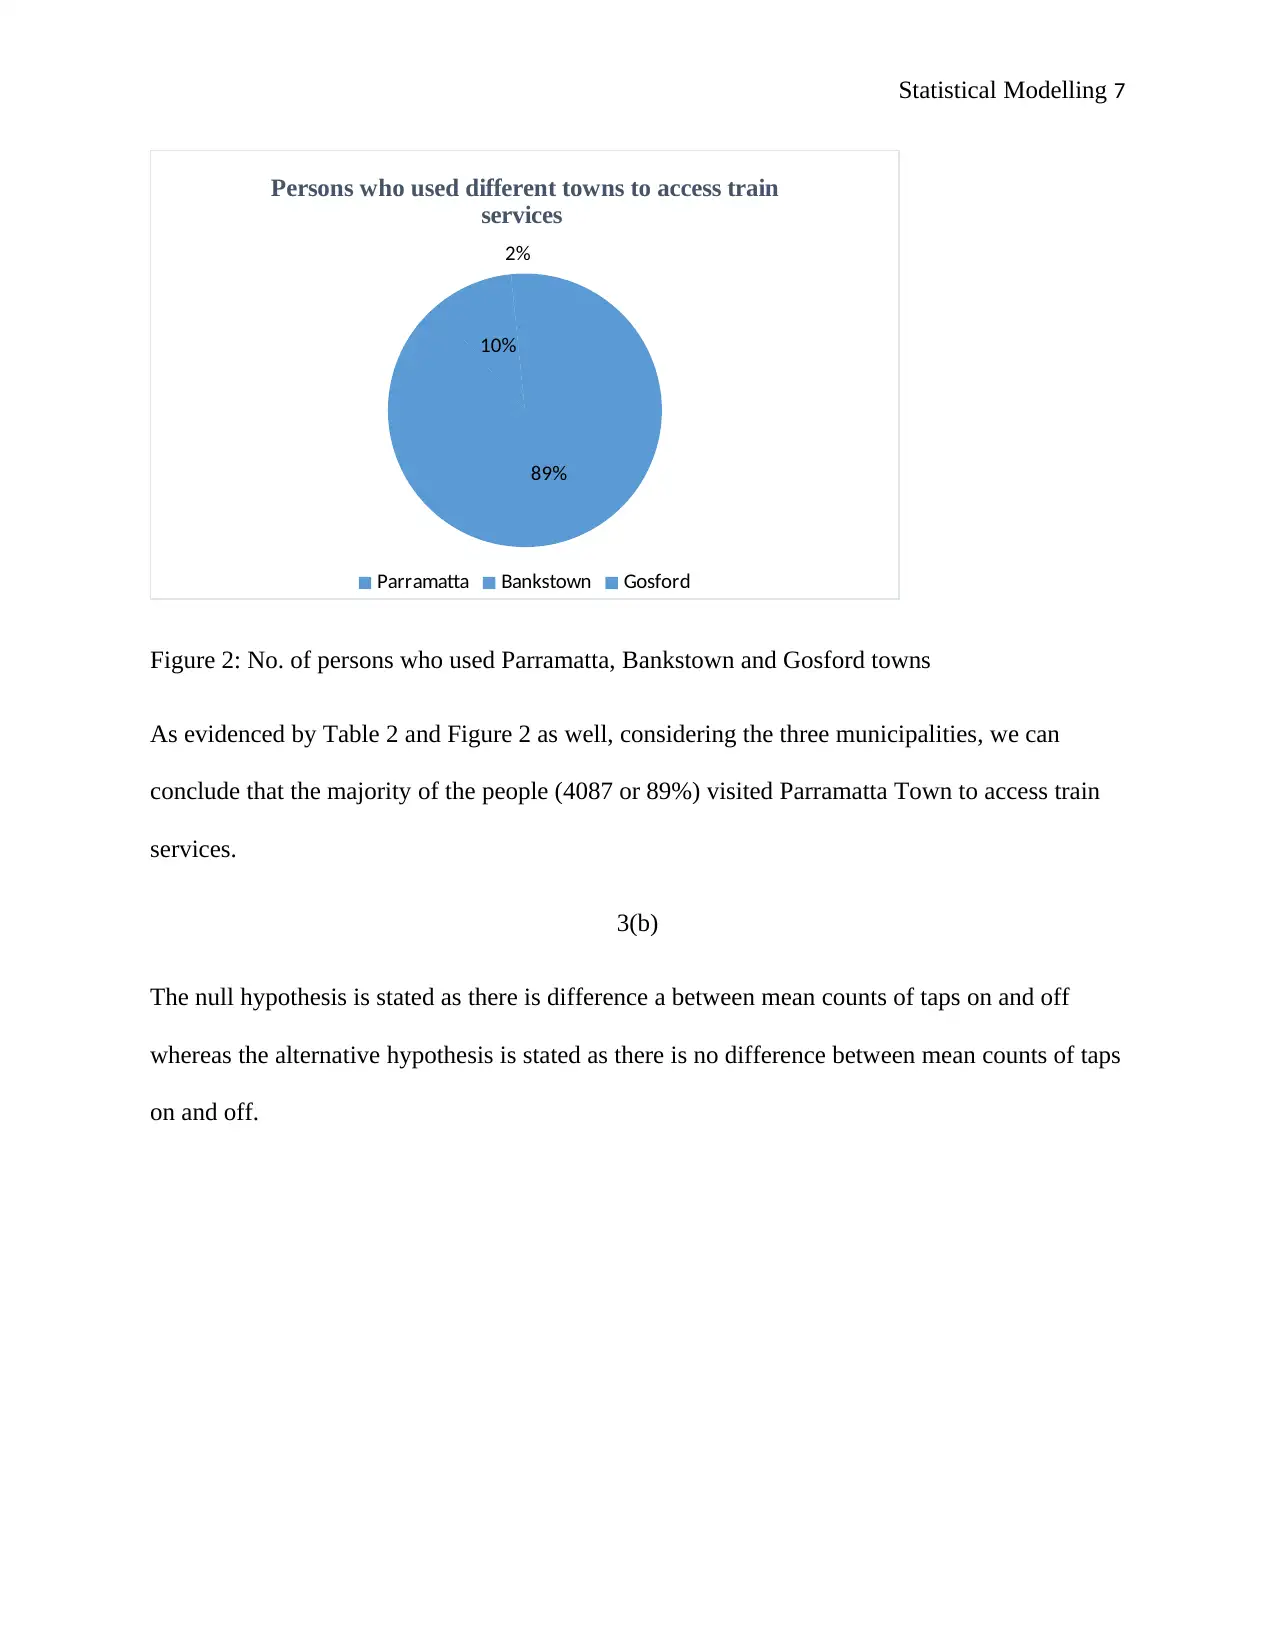
Figure 2: No. of persons who used Parramatta, Bankstown and Gosford towns
As evidenced by Table 2 and Figure 2 as well, considering the three municipalities, we can
conclude that the majority of the people (4087 or 89%) visited Parramatta Town to access train
services.
3(b)
The null hypothesis is stated as there is difference a between mean counts of taps on and off
whereas the alternative hypothesis is stated as there is no difference between mean counts of taps
on and off.
89%
10%
2%
Persons who used different towns to access train
services
Parramatta Bankstown Gosford
Figure 2: No. of persons who used Parramatta, Bankstown and Gosford towns
As evidenced by Table 2 and Figure 2 as well, considering the three municipalities, we can
conclude that the majority of the people (4087 or 89%) visited Parramatta Town to access train
services.
3(b)
The null hypothesis is stated as there is difference a between mean counts of taps on and off
whereas the alternative hypothesis is stated as there is no difference between mean counts of taps
on and off.
Paraphrase This Document
Need a fresh take? Get an instant paraphrase of this document with our AI Paraphraser
Statistical Modelling 8
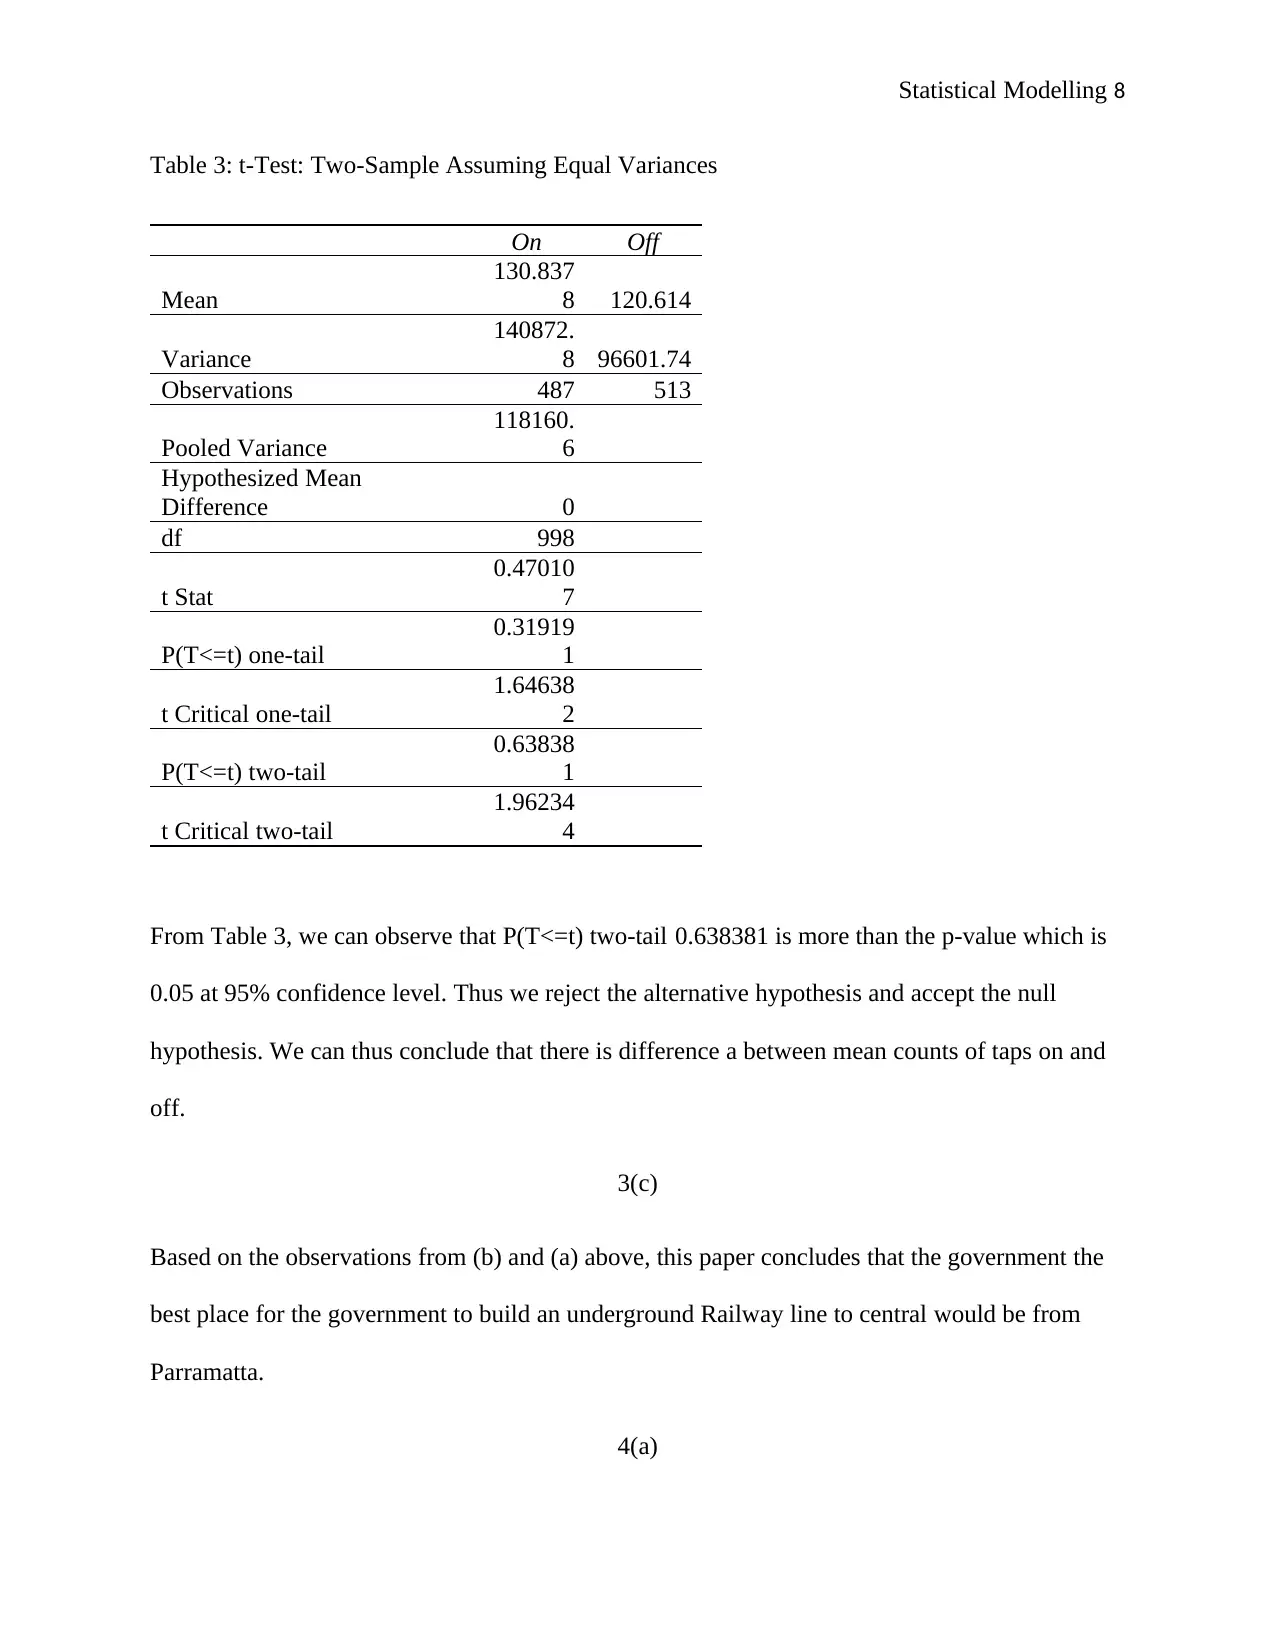
Table 3: t-Test: Two-Sample Assuming Equal Variances
On Off
Mean
130.837
8 120.614
Variance
140872.
8 96601.74
Observations 487 513
Pooled Variance
118160.
6
Hypothesized Mean
Difference 0
df 998
t Stat
0.47010
7
P(T<=t) one-tail
0.31919
1
t Critical one-tail
1.64638
2
P(T<=t) two-tail
0.63838
1
t Critical two-tail
1.96234
4
From Table 3, we can observe that P(T<=t) two-tail 0.638381 is more than the p-value which is
0.05 at 95% confidence level. Thus we reject the alternative hypothesis and accept the null
hypothesis. We can thus conclude that there is difference a between mean counts of taps on and
off.
3(c)
Based on the observations from (b) and (a) above, this paper concludes that the government the
best place for the government to build an underground Railway line to central would be from
Parramatta.
4(a)
Statistical Modelling 9
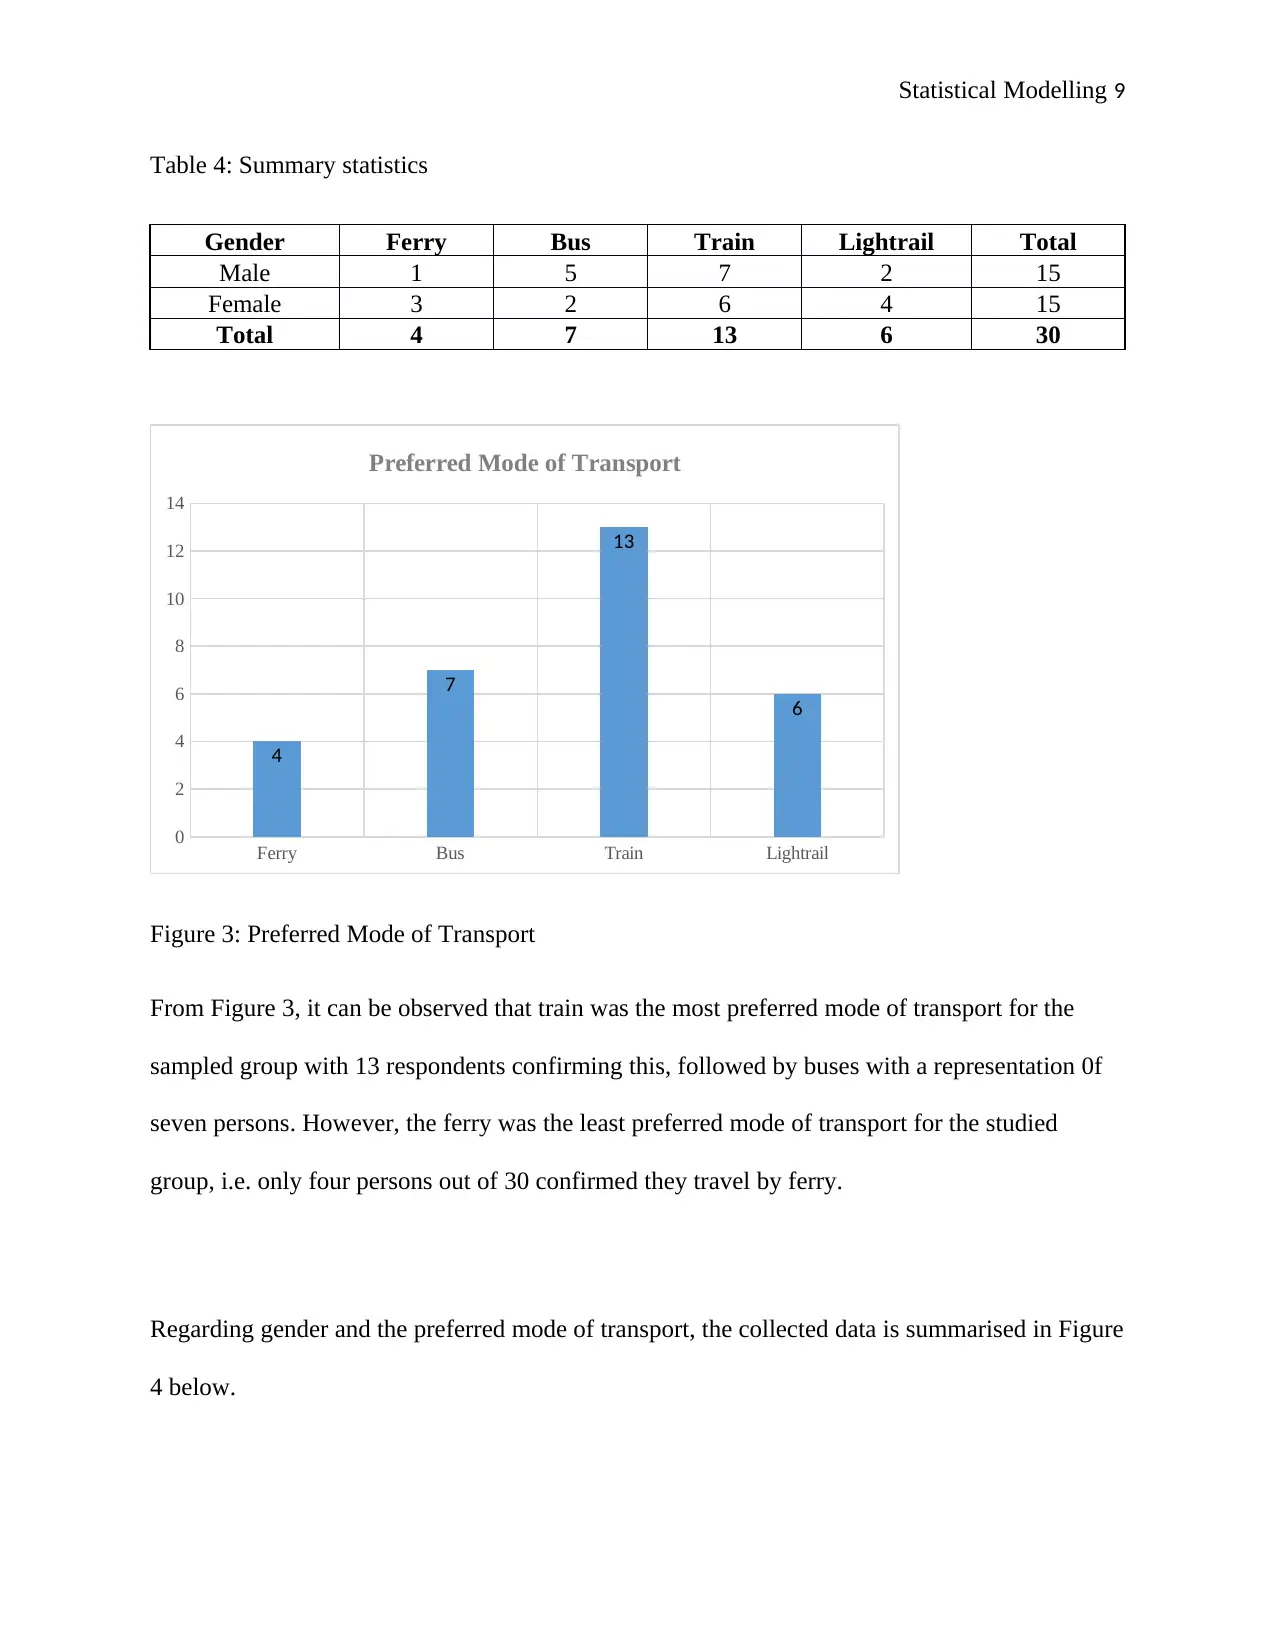
Table 4: Summary statistics
Gender Ferry Bus Train Lightrail Total
Male 1 5 7 2 15
Female 3 2 6 4 15
Total 4 7 13 6 30
Ferry Bus Train Lightrail
0
2
4
6
8
10
12
14
4
7
13
6
Preferred Mode of Transport
Figure 3: Preferred Mode of Transport
From Figure 3, it can be observed that train was the most preferred mode of transport for the
sampled group with 13 respondents confirming this, followed by buses with a representation 0f
seven persons. However, the ferry was the least preferred mode of transport for the studied
group, i.e. only four persons out of 30 confirmed they travel by ferry.
Regarding gender and the preferred mode of transport, the collected data is summarised in Figure
4 below.
⊘ This is a preview!⊘
Do you want full access?
Subscribe today to unlock all pages.
Trusted by 1+ million students worldwide
Statistical Modelling 10
Ferry Bus Train Lightrail
0
1
2
3
4
5
6
7
8
1
5
7
2
3
2
6
4
Preferred Mode of Transport in terms of Gender
Male Female
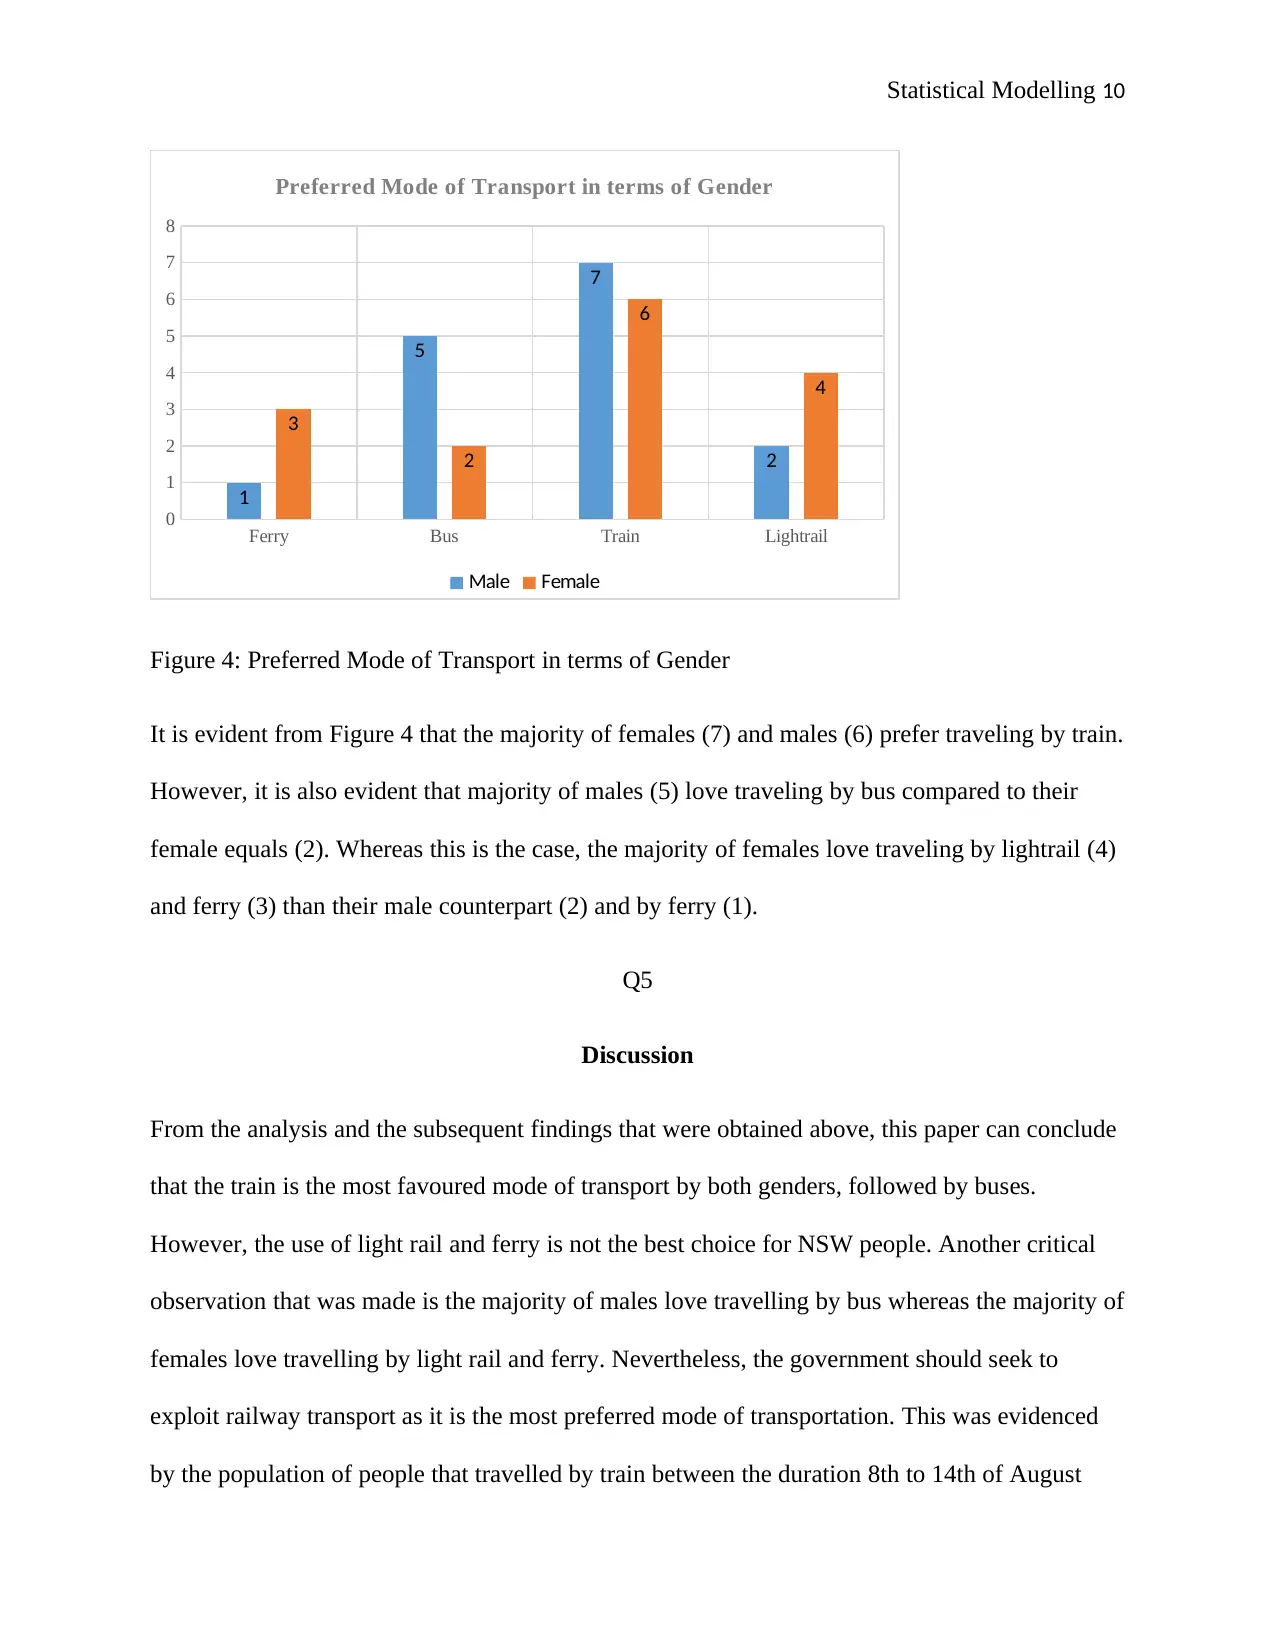
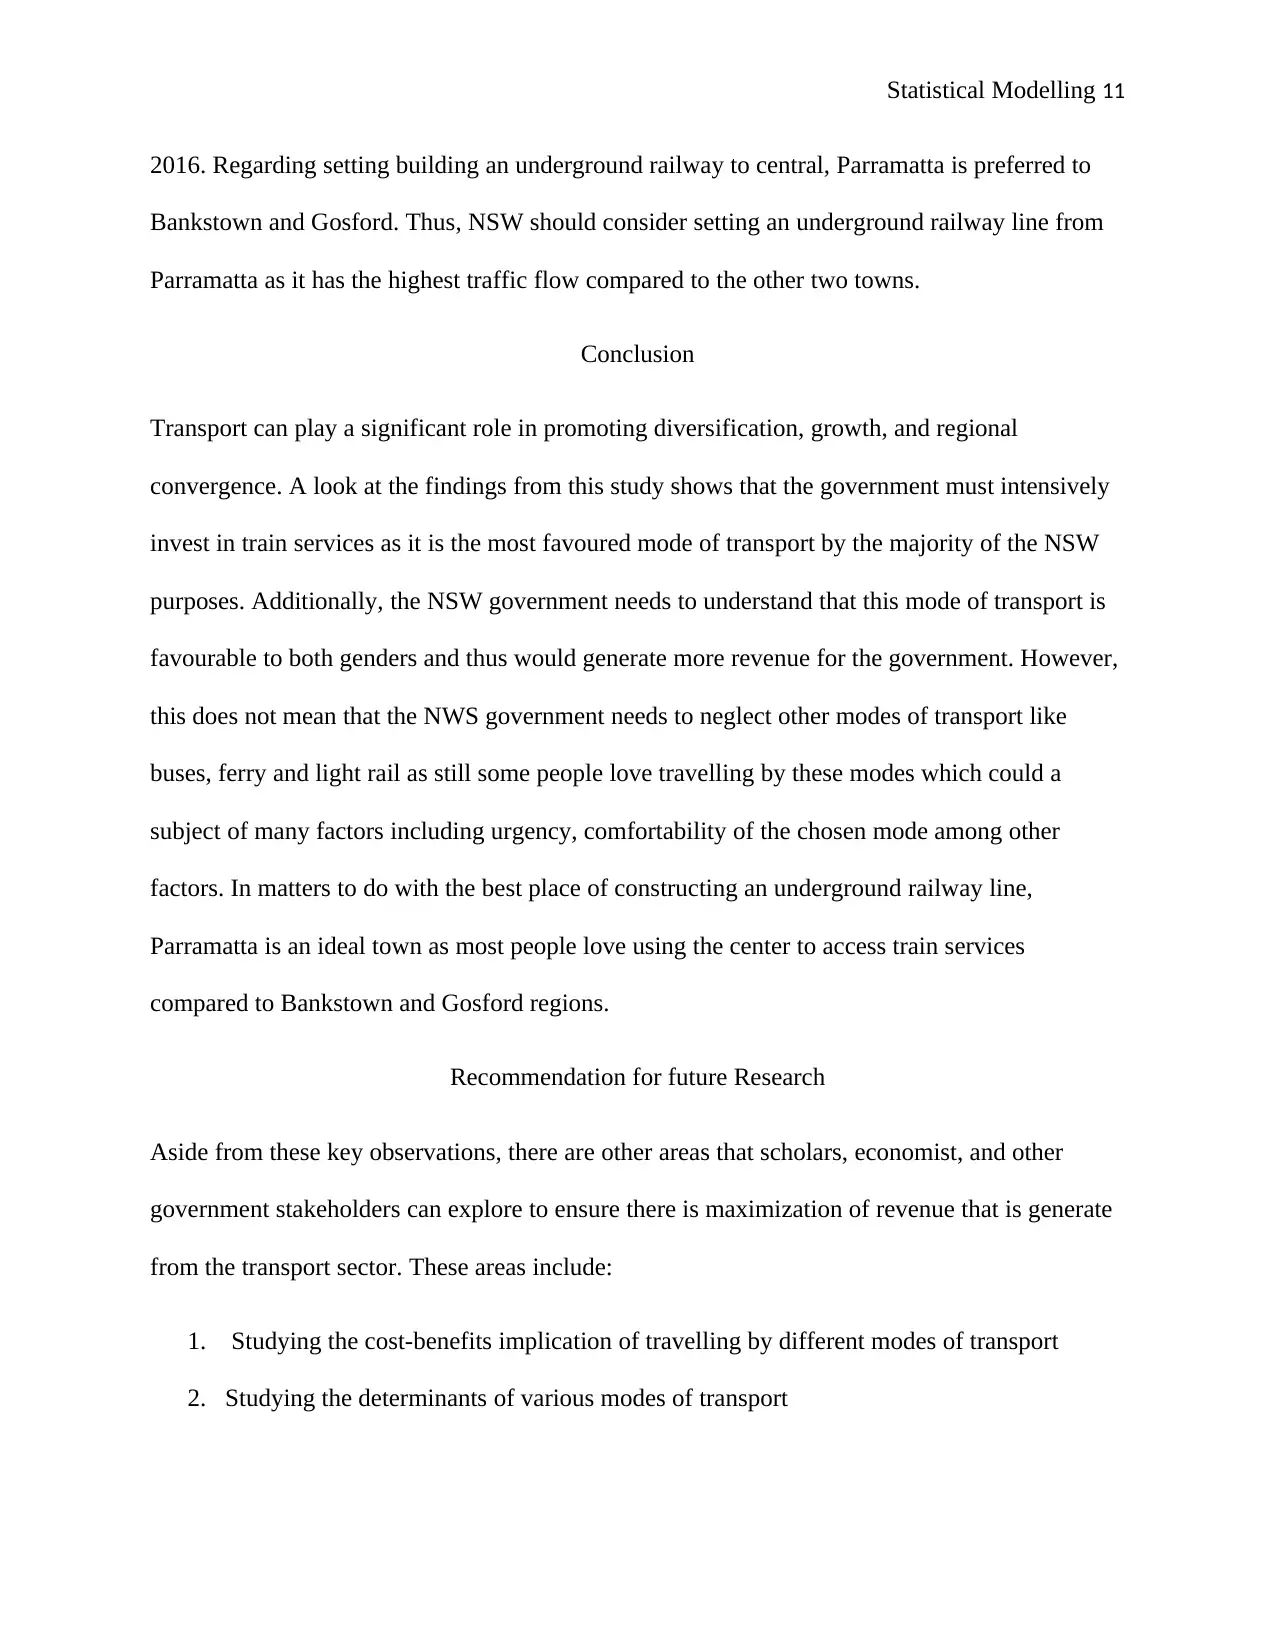
Figure 4: Preferred Mode of Transport in terms of Gender
It is evident from Figure 4 that the majority of females (7) and males (6) prefer traveling by train.
However, it is also evident that majority of males (5) love traveling by bus compared to their
female equals (2). Whereas this is the case, the majority of females love traveling by lightrail (4)
and ferry (3) than their male counterpart (2) and by ferry (1).
Q5
Discussion
From the analysis and the subsequent findings that were obtained above, this paper can conclude
that the train is the most favoured mode of transport by both genders, followed by buses.
However, the use of light rail and ferry is not the best choice for NSW people. Another critical
observation that was made is the majority of males love travelling by bus whereas the majority of
females love travelling by light rail and ferry. Nevertheless, the government should seek to
exploit railway transport as it is the most preferred mode of transportation. This was evidenced
by the population of people that travelled by train between the duration 8th to 14th of August
Ferry Bus Train Lightrail
0
1
2
3
4
5
6
7
8
1
5
7
2
3
2
6
4
Preferred Mode of Transport in terms of Gender
Male Female
Figure 4: Preferred Mode of Transport in terms of Gender
It is evident from Figure 4 that the majority of females (7) and males (6) prefer traveling by train.
However, it is also evident that majority of males (5) love traveling by bus compared to their
female equals (2). Whereas this is the case, the majority of females love traveling by lightrail (4)
and ferry (3) than their male counterpart (2) and by ferry (1).
Q5
Discussion
From the analysis and the subsequent findings that were obtained above, this paper can conclude
that the train is the most favoured mode of transport by both genders, followed by buses.
However, the use of light rail and ferry is not the best choice for NSW people. Another critical
observation that was made is the majority of males love travelling by bus whereas the majority of
females love travelling by light rail and ferry. Nevertheless, the government should seek to
exploit railway transport as it is the most preferred mode of transportation. This was evidenced
by the population of people that travelled by train between the duration 8th to 14th of August
Paraphrase This Document
Need a fresh take? Get an instant paraphrase of this document with our AI Paraphraser
Statistical Modelling 11
2016. Regarding setting building an underground railway to central, Parramatta is preferred to
Bankstown and Gosford. Thus, NSW should consider setting an underground railway line from
Parramatta as it has the highest traffic flow compared to the other two towns.
Conclusion
Transport can play a significant role in promoting diversification, growth, and regional
convergence. A look at the findings from this study shows that the government must intensively
invest in train services as it is the most favoured mode of transport by the majority of the NSW
purposes. Additionally, the NSW government needs to understand that this mode of transport is
favourable to both genders and thus would generate more revenue for the government. However,
this does not mean that the NWS government needs to neglect other modes of transport like
buses, ferry and light rail as still some people love travelling by these modes which could a
subject of many factors including urgency, comfortability of the chosen mode among other
factors. In matters to do with the best place of constructing an underground railway line,
Parramatta is an ideal town as most people love using the center to access train services
compared to Bankstown and Gosford regions.
Recommendation for future Research
Aside from these key observations, there are other areas that scholars, economist, and other
government stakeholders can explore to ensure there is maximization of revenue that is generate
from the transport sector. These areas include:
1. Studying the cost-benefits implication of travelling by different modes of transport
2. Studying the determinants of various modes of transport

Statistical Modelling 12
3. Studying the correlation between the location of railway, bus, ferry, or lightrail boarding
places and the mode of transport that is chosen.
3. Studying the correlation between the location of railway, bus, ferry, or lightrail boarding
places and the mode of transport that is chosen.
⊘ This is a preview!⊘
Do you want full access?
Subscribe today to unlock all pages.
Trusted by 1+ million students worldwide
1 out of 13
Related Documents


Your All-in-One AI-Powered Toolkit for Academic Success.
+13062052269
info@desklib.com
Available 24*7 on WhatsApp / Email
![[object Object]](/_next/static/media/star-bottom.7253800d.svg)
Unlock your academic potential
Copyright © 2020–2026 A2Z Services. All Rights Reserved. Developed and managed by ZUCOL.