BUS 708: Analyzing NSW Public Transport System - Statistical Model

Verified

Added on  2023/06/04

|15
|2124
|177
Report
AI Summary
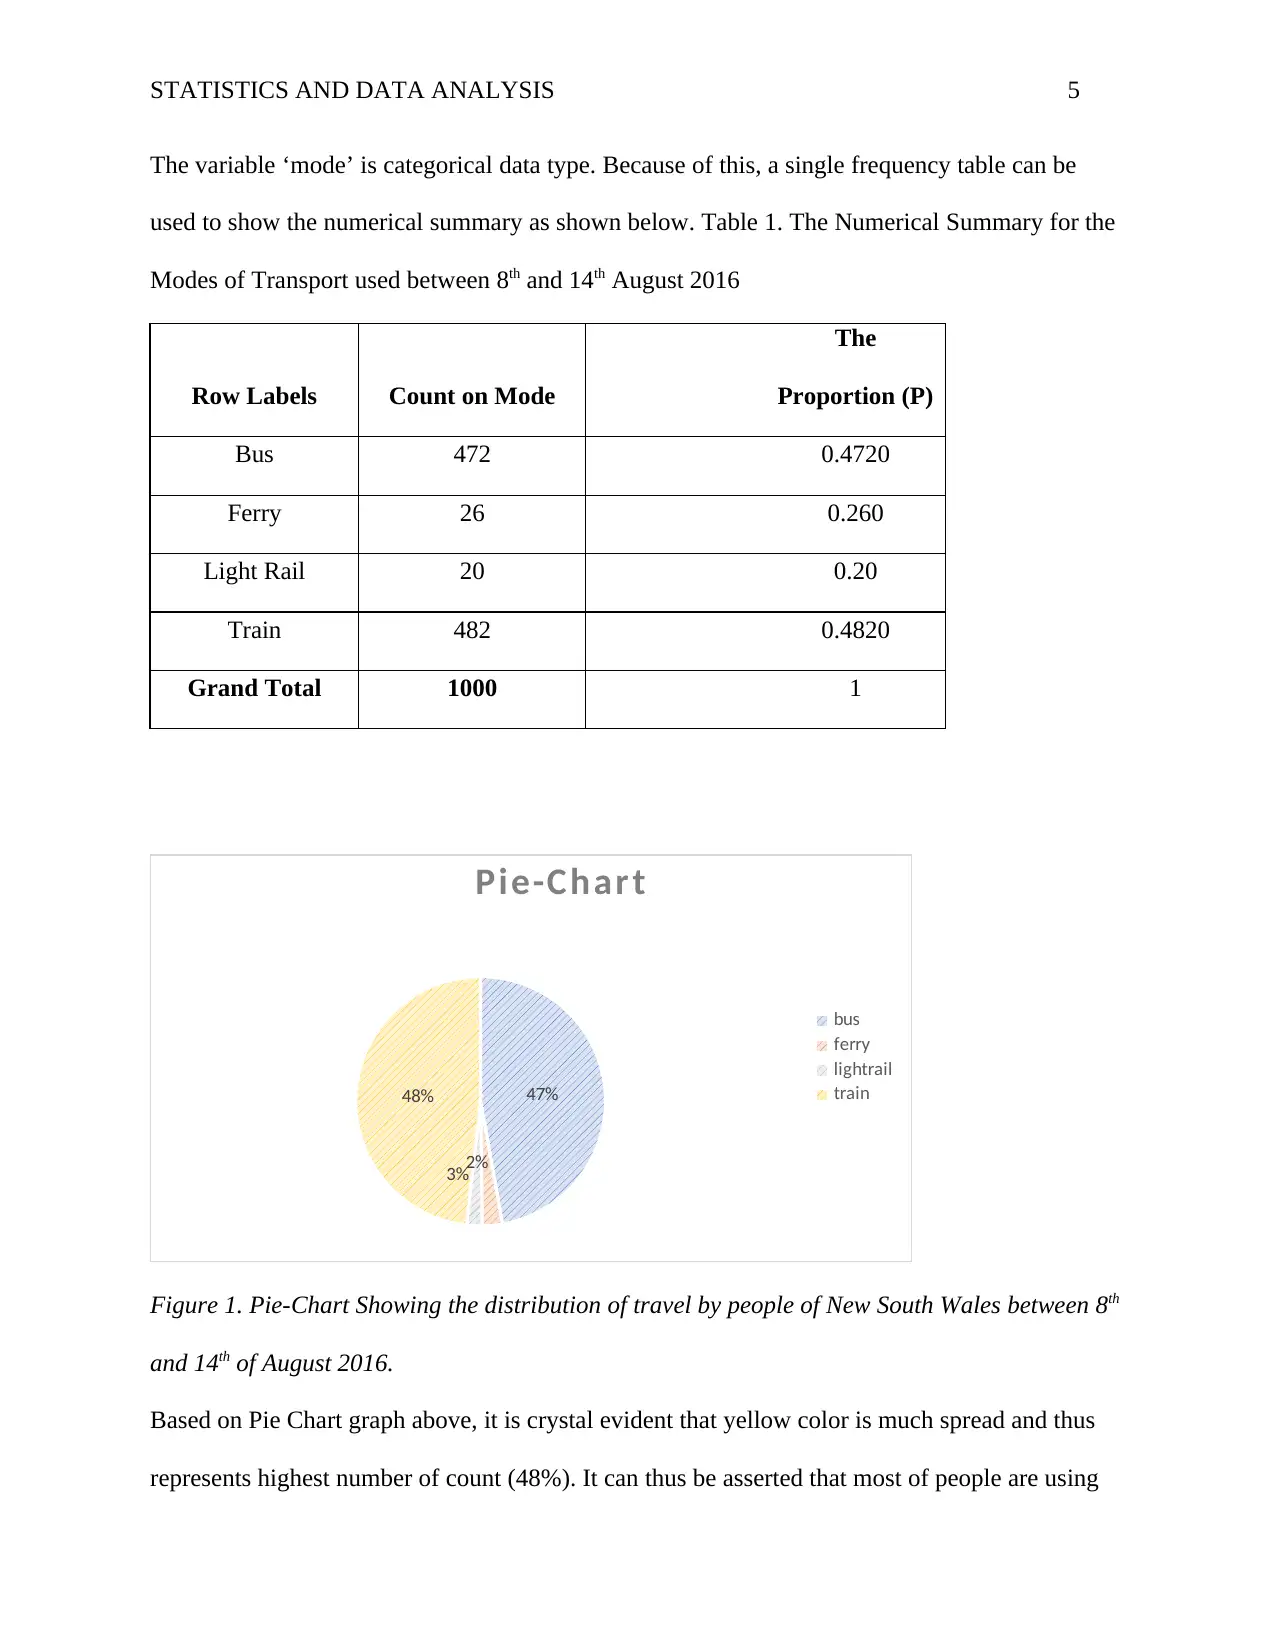
This report provides a statistical analysis of the New South Wales (NSW) transport system, focusing on data from bus, train, ferry, and light rail services. It examines factors such as mode of transport, time, location, and date of travel, using both primary and secondary datasets. The analysis includes numerical summaries, graphical displays, and hypothesis testing to determine transport usage patterns. Key findings indicate that train and bus are the most frequently used modes of transport. The report concludes with recommendations for the NSW government to improve public transport services, emphasizing the need for larger sample populations in future research to avoid biased results. Desklib offers a range of study tools, including past papers and solved assignments, to support students in their academic endeavors.
Document Page
Running head: STATISTICS AND DATA ANALYSIS 1
BUS 708: Statistics and Data Analysis
Statistical Modelling Assignment
[Name of Student]
[University]
[Date of Submission]
tabler-icon-diamond-filled.svg

Paraphrase This Document

Need a fresh take? Get an instant paraphrase of this document with our AI Paraphraser
Document Page
STATISTICS AND DATA ANALYSIS 2
Section 1: Introduction
a). This assignment is based on the analysis of New South Wales government transport by Bus,
Train, Ferry and Light Rail. The assignment entails the analysis of various aspects associated
with the NSW transport such as time, location, count and date of the travel.
Based on the New South Wales Long Term Transport Master Plan (December, 2012), the New
South Wales public transport there are four basic means of transport offered i.e. by bus, by train,
by ferry and by light Rail.
It is important that the New South Wales government is undertaking long term master plan, uses
the opportunity to give clear and concise and better transport services to the people of New South
Document Page
STATISTICS AND DATA ANALYSIS 3
Wales that is passengers over a period of time (Bowditch G 2018). This paper therefore presents
some of the recommendations to the New South Wales government based on the analytical
findings to enable adjustments in a particular variable on transport system. The assignment is
thus a comprehensive analysis of factors such as mode of transport, gender, location, and times
of travel and date of tap. The possible cases used in gathering the data includes direct
interviewing of the travelers, observation and filling of the questionnaires by the actual
passengers.
b). Dataset 1is a secondary form dataset since it originates from the NSW master plan. Dataset 1
contains information that is related to the New South Wales transport used by people. The
dataset Based on the New South Wales Long Term Transport Master Plan (December, 2012),
the New South Wales public transport there are four basic modes of transport offered i.e. by bus,
by train, by ferry and by light Rail.
Dataset 1 is a secondary dataset since it includes information collected by the government and
the data was initially collected for other related research work. The dataset contains variables
such as;
i. Mode of travel (Type of public transport i.e. Bus, Train, Ferry and Light Rail)
ii. Date of the tap on or off held (From 8th to 14th August 2016)
iii. Time of travel
iv. Location
v. Tap (On or off)
vi. Count
Document Page
STATISTICS AND DATA ANALYSIS 4
vii. Location (Locations of stops. For bus postcodes and other names of the stations.
The possible cases used in the study are observation. This is because the data was collected
just on the basis of observing.
c). Dataset is a dataset that comprises of only two variables i.e. mode of transportation and the
gender. Gender in this dataset represents the demographic aspect. The modes of transport in
dataset 2 are four. They include transport by bus, by ferry, by rain and by light train. The dataset
2 has comprise of a sample of 25 from which 14 are females while 11 are male. Dataset is a
primary dataset as the data was collected from the actual travelers from the New South Wales.
The possible cases applied in collecting dataset 2 was through observation. The researcher (in
this case “me”) conducted actual study by observing the factors under consideration and
recording. However, on critical examination of dataset 2, dataset 2 is biased due to the following
reasons: First, the total sample presented in the dataset is comprises of only 25 cases which is
relatively smaller and thus could not be used up in the analysis. The minimum sample should be
45 cases or items. Second, the dataset 2 comprises of categorical variables only which cannot be
subjected to more and extensive statistical analyses since only demographical aspects/ variables
i.e. gender and mode of transport are presented in the dataset 2.
Section 2: Analysis of Single Variable in Dataset 1
Type of transport that was commonly used.
Transport by train was the most used mode of transport in New South Wales transport system
from 8th to 16th August 2016 (482 times).
tabler-icon-diamond-filled.svg

Paraphrase This Document

Need a fresh take? Get an instant paraphrase of this document with our AI Paraphraser
Document Page
STATISTICS AND DATA ANALYSIS 5
The variable ‘mode’ is categorical data type. Because of this, a single frequency table can be
used to show the numerical summary as shown below. Table 1. The Numerical Summary for the
Modes of Transport used between 8th and 14th August 2016
Row Labels Count on Mode
The
Proportion (P)
Bus 472 0.4720
Ferry 26 0.260
Light Rail 20 0.20
Train 482 0.4820
Grand Total 1000 1
47%
3%2%
48%
Pie-Char t
bus
ferry
lightrail
train
Figure 1. Pie-Chart Showing the distribution of travel by people of New South Wales between 8th
and 14th of August 2016.
Based on Pie Chart graph above, it is crystal evident that yellow color is much spread and thus
represents highest number of count (48%). It can thus be asserted that most of people are using
Document Page
STATISTICS AND DATA ANALYSIS 6
train as means of public transport. Travel by bus is the second highest (about 47%) and travel by
Light train is the least mode of transport that people of New South Wales are using (2%).
Section 2 (b)
Testing the Hypotheses
The proportion people using train (p) =0.482 (Highest value chosen from proportion column)
N=1000
Step 1: Stating the Hypotheses
The null and alternative hypotheses can be stated and formulated as follows;
H0: p= 0.5
H1: p>0.5
Step 2: Checking if the condition is satisfied.
Is condition satisfied?
Np0≥10 i.e., 1000 × 0.5≥10 = 500≥10
N (1-p) ≥10 i.e., 1000 × (1-0.5) ≥ 10 = 500 ≥ 10
From the above illustration, it is true that the condition are satisfied. Hence it implies that the p
value can be obtained and computed as the region under the tail of the standard normal beyond
the value of
Calculation of test statistics
Ƶ= statisticnull hypothesis
Standard Error
Document Page
STATISTICS AND DATA ANALYSIS 7
Then we have,
Test statistics Ƶ=
phat p
p (1 p)
n
=
0.4820.5
0.5(10.5)
1000
=0.018
0.0158 = -1.140
Step 3: Comparison
P (Z>-1.140)
=0.1251
The P-value obtained is greater than alpha (p-value>0.05) where α=o.05
Step 5: Conclusion
The test statistics is calculated below 1.645, i.e., -1.14 hence we do not reject the null hypothesis
(H0) and thus we conclude that there is no significant evidence that there are more than 50% of
public transport users in New South Wales in use of a particular mode of transport obtained in
section (a) above.
Section 3
Part (a)
Variables ‘location’ and ‘count’ are categorical and quantitative respectively. So suitable
graphical display for one categorical and quantitative are dot plot and histogram and box plot.
We have used the box plot to show the graphical representation of this two variable.
Numerical Summary
tabler-icon-diamond-filled.svg

Paraphrase This Document

Need a fresh take? Get an instant paraphrase of this document with our AI Paraphraser
Document Page
STATISTICS AND DATA ANALYSIS 8
Box Plot
Location
People count
Document Page
STATISTICS AND DATA ANALYSIS 9
In the above boxplot, x-represent the location of train station and y-axis represent the number of
people. Box plot for paramatta station is skewed to the right which has highest of 443 people,
whereas for bankstown station has highest of 125 people
Part 3 B
Variables involved:
i. Tap- categorical
ii. Count- quantitative
Step-1: Stating the Hypotheses
H0: all the means are equal
H1: at least two means are different
Step-2: Checking the Condition
Condition check
Document Page
STATISTICS AND DATA ANALYSIS 10
1. Sample size (n) in each group are ≥30 (satisfied)
2. Standard deviation is similar in each group (yes), because none of the standard deviation
is twice the other standard deviation.
All the condition are satisfied.
Step-3: Testing the hypothesis
Step-4
tabler-icon-diamond-filled.svg

Paraphrase This Document

Need a fresh take? Get an instant paraphrase of this document with our AI Paraphraser
Document Page
STATISTICS AND DATA ANALYSIS 11
From the diagram we can get value P-value which is 0.243
Step-5
Since P-value i.e., 0.243>0.05, so do not reject H0, which means there is not enough evidence
for difference in the mean.
Document Page
STATISTICS AND DATA ANALYSIS 12
Section 4
In this survey we have got two variable and twenty-four cases. Two variables are ‘Gender’ and
‘Mode’. Both are categorical variables, so we need to use segmented segmented bar chart for
graphical representation of two categorical variables.
In the above segmented bar diagram x-axis represents the variable ‘gender’ and y-axis represent
the variable ‘mode’. In each bar blue color represents the portion of male and grey color
represents the portion of female. Male prefer to use train more than the female. In case of ferry,
female prefer to use ferry more than the male. Similarly, male like to use bus as modes of
transport than that of female. Whereas female use light rail more than male.
chevron_up_icon
1 out of 15
circle_padding
hide_on_mobile
zoom_out_icon
[object Object]