BUS708: Statistical Modelling for Sydney Public Transport System

Verified

Added on  2023/06/04

|8
|2229
|95
Report
AI Summary
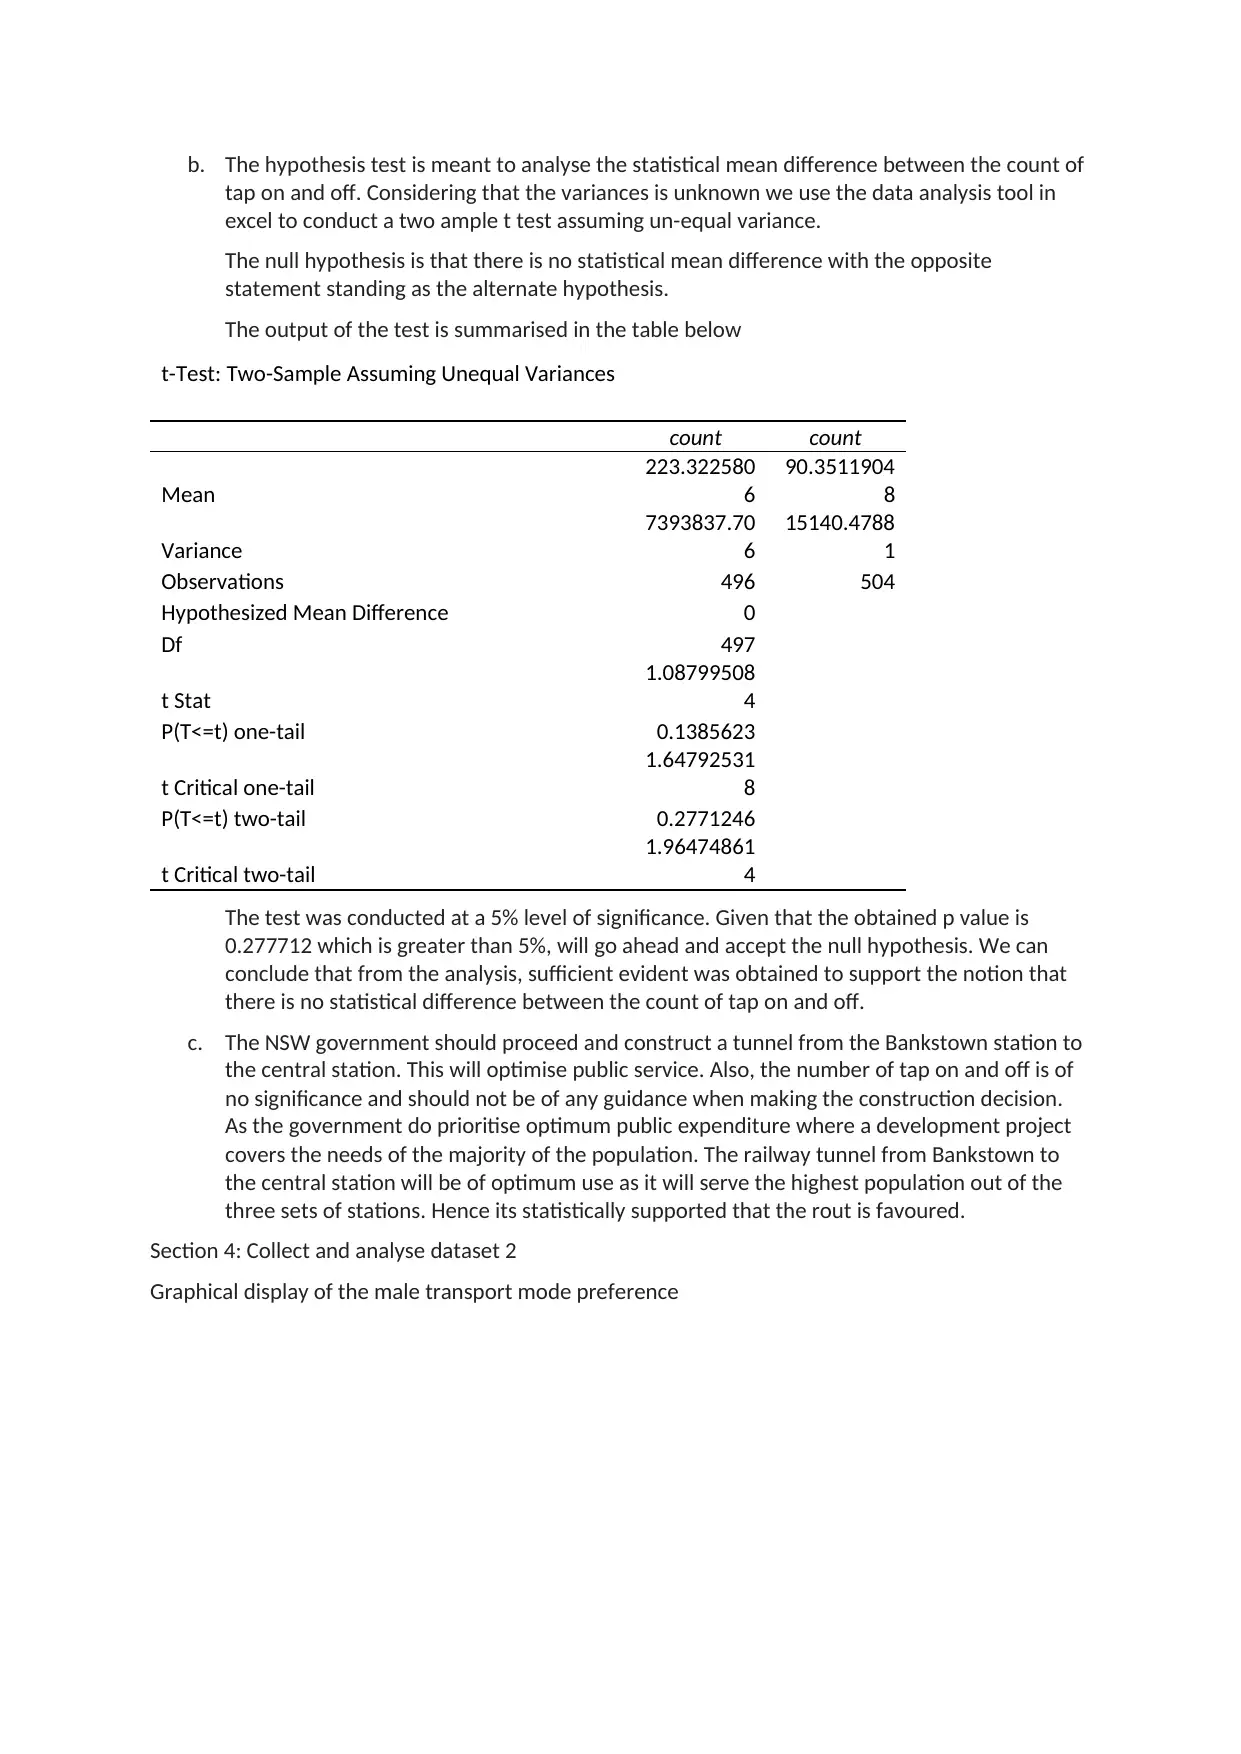
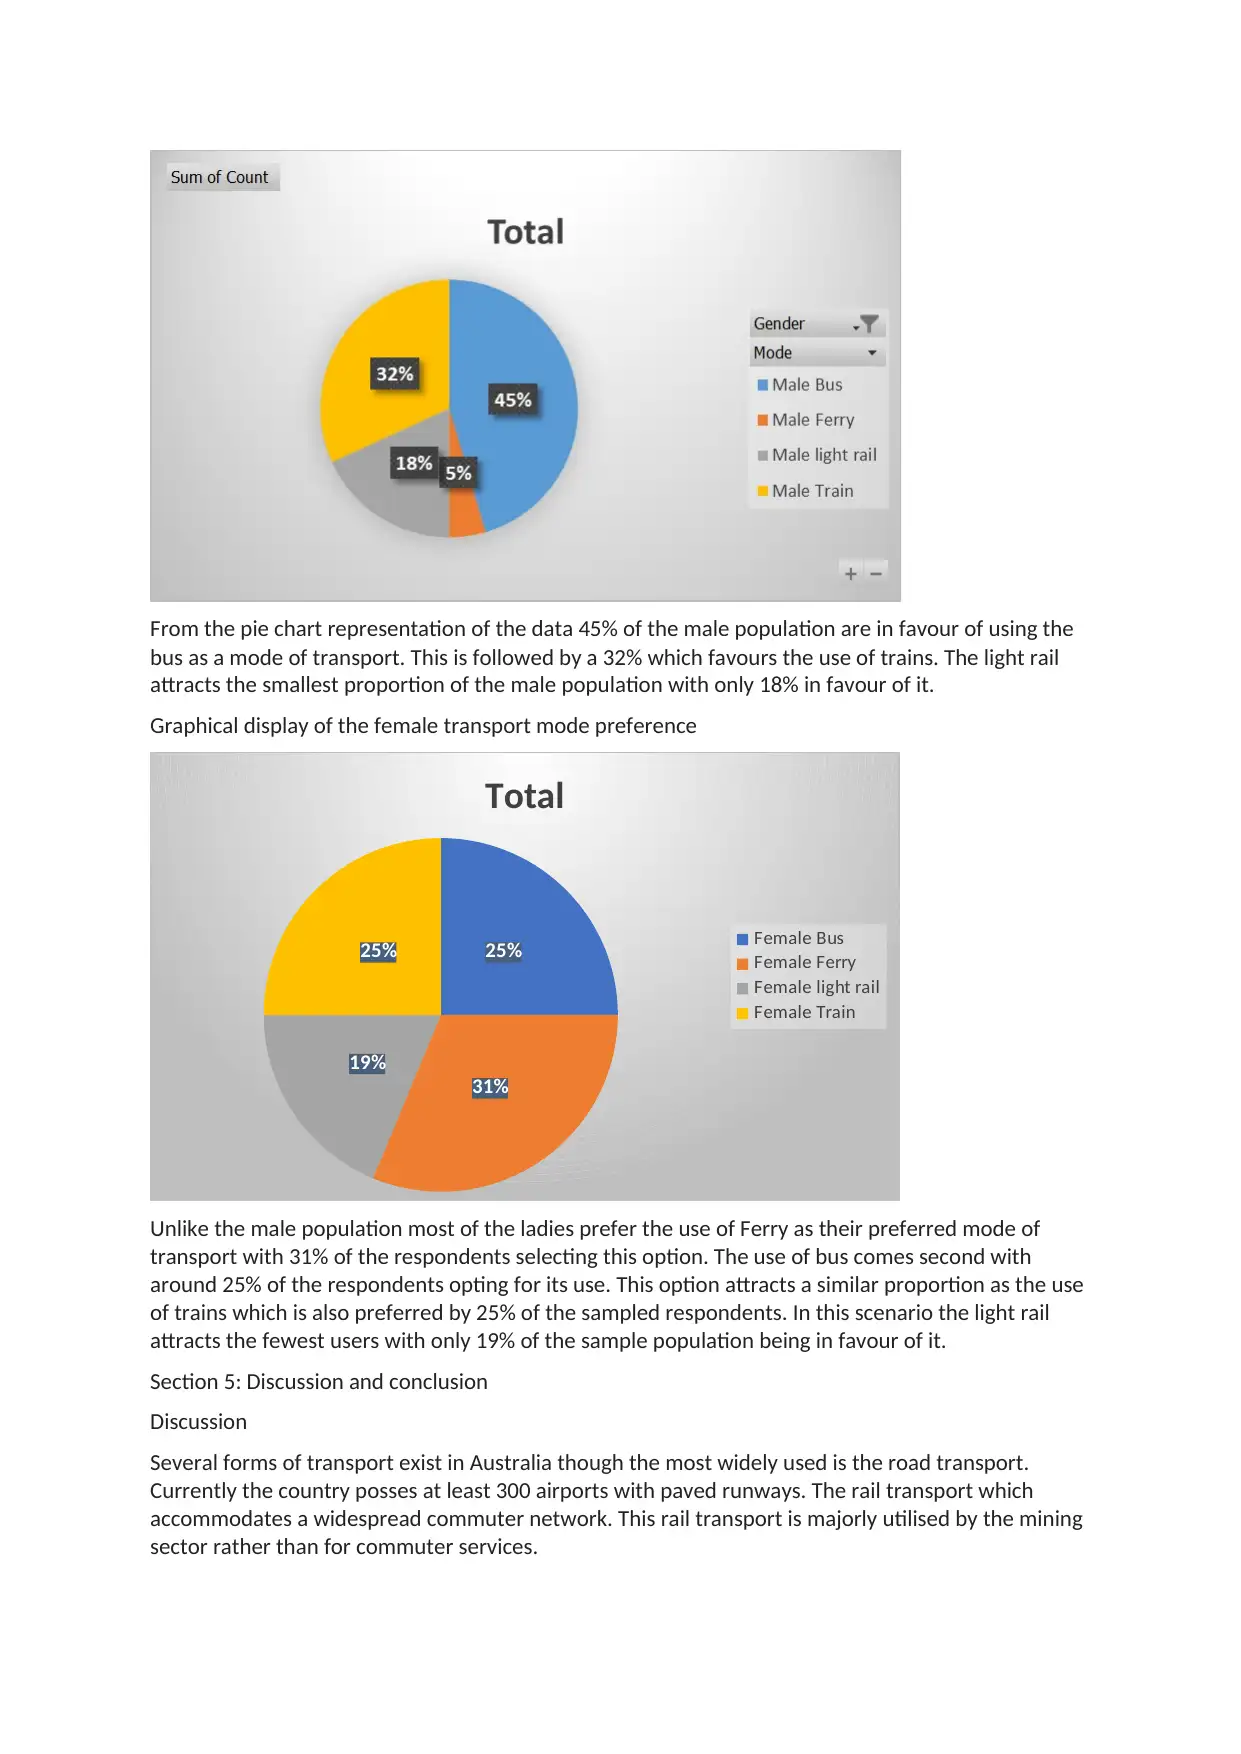
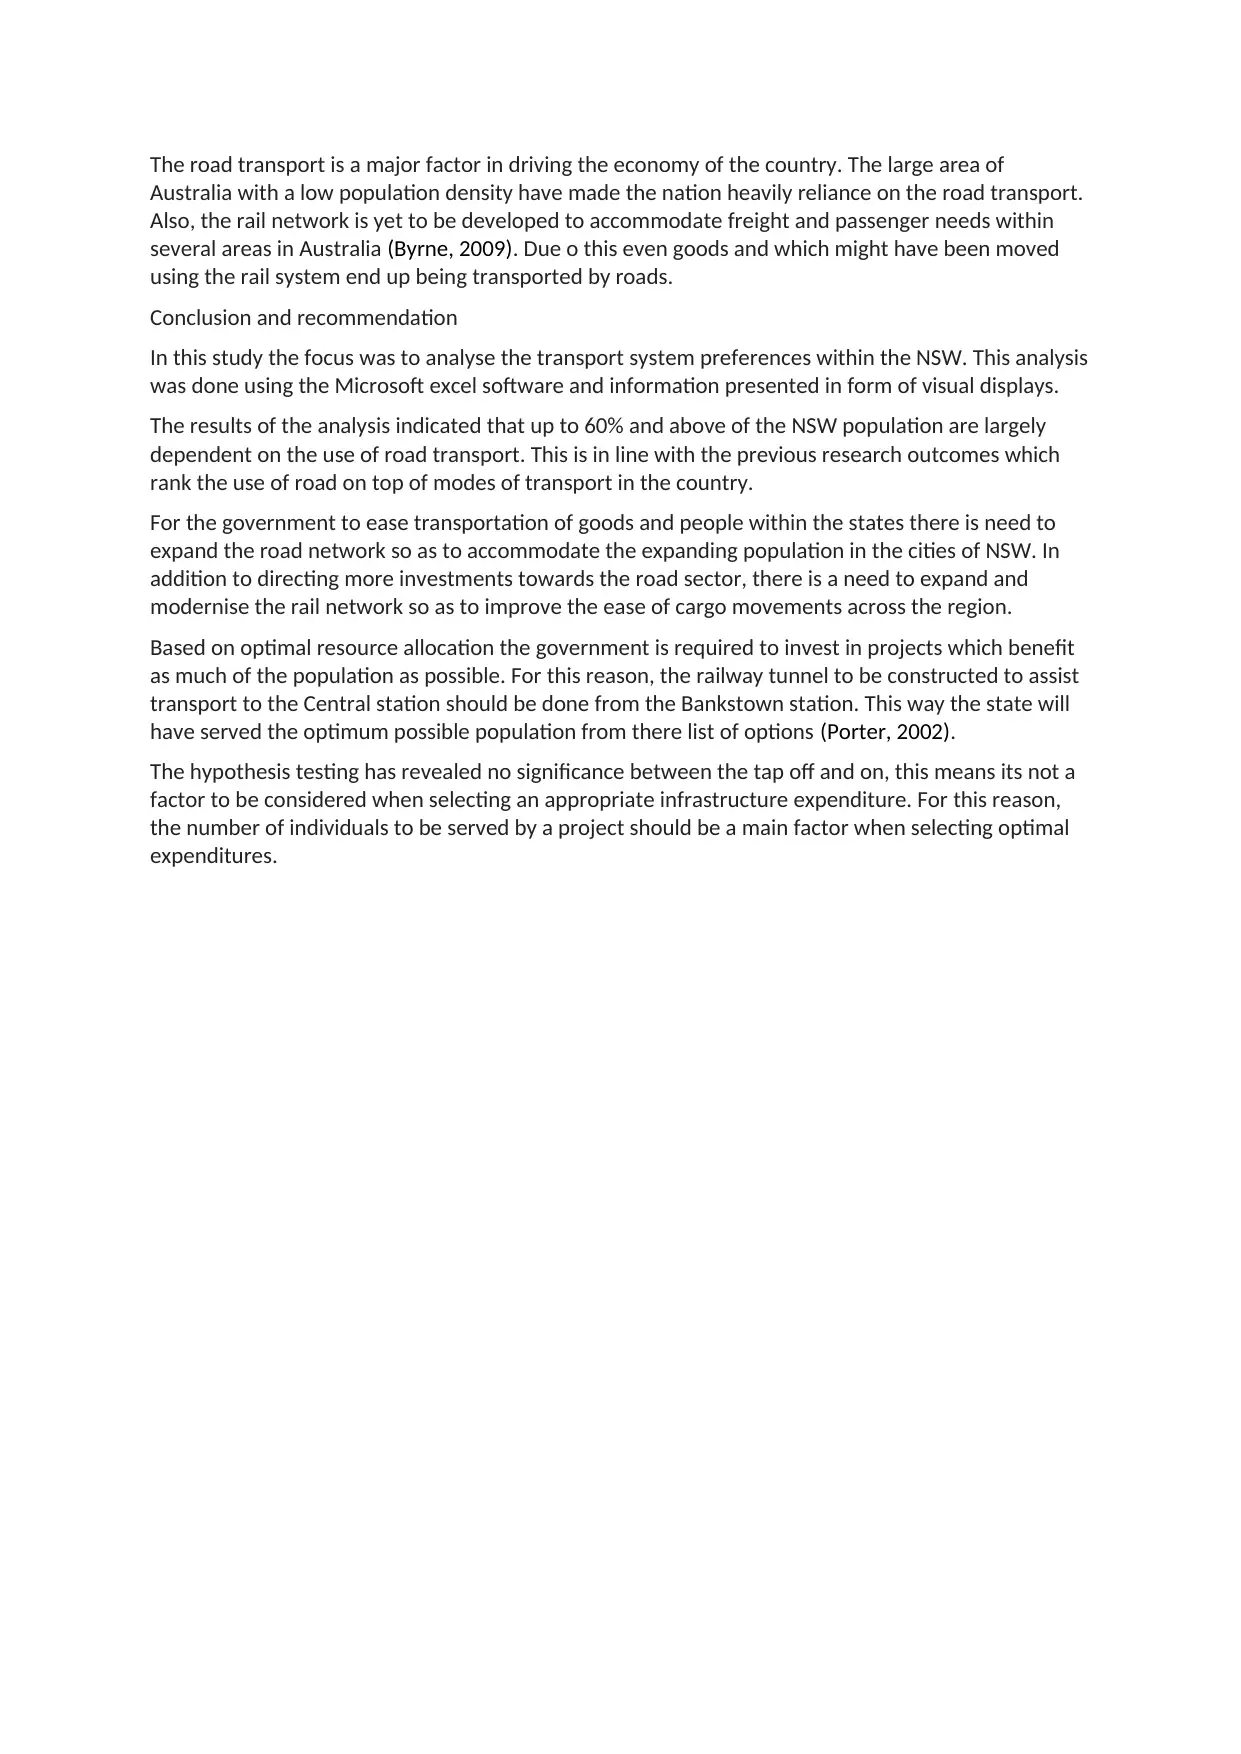
This report provides a statistical analysis of Sydney's transport system, aiming to offer recommendations for improvement. It uses two datasets: one with transport mode usage data and another from interviews about preferred modes. The analysis identifies that buses are the most popular mode of transport. Hypothesis testing confirms that bus usage exceeds 50% of the population. The report also evaluates the potential construction of an underground railway line, recommending a route from Bankstown station to Central station based on user data. Further analysis explores gender-based transport preferences, highlighting differences in mode selection between males and females. The study concludes by advocating for road network expansion and modernization of the rail network to accommodate the growing population and improve cargo movement. The report suggests prioritizing projects that serve the largest population segment, supporting the Bankstown to Central station railway tunnel.
Document Page
Statistics and Data Analysis
Institution Name
Student Name
Date
tabler-icon-diamond-filled.svg

Paraphrase This Document

Need a fresh take? Get an instant paraphrase of this document with our AI Paraphraser
Document Page
1. Introduction
a. The transport system in Sydney city in New South Wales is availed through an extensive
operating mode which compose of suburban rail, buses, ferries as well as light rail. The
structure will also be composed of rail transit with the new Sydney Metro opening in early
2019 to form part of this. Based on the 2006 census Sydney city had the highest rate of
public transport usage out of all the capital cities in Australia. The city had up to 80% of its
weekday transport from /to the central city being made via the public transport. This makes
Sydney to be among the Australian’s largest public transport network. The transport system
is structures as explained below;
Road; New South Wales road infrastructure is under the command of the Roads and
Maritime Services (RMS). This body is concerned with driver licensing as well as registration
of vehicles. RMS is involved with direct management of the state roads and avails funding to
the local council roads for purpose of developing the regional roads. With an assistance from
the Federal Government RMS is also mandated by the management of the national highway
system.
In this report the focus will be to analyse the data from the NSW with a focus of making
recommendations on how to improve the public transport system. The task makes use of a
number of research questions to assist breakdown the transport system and assist identify
the limitations.
b. The data set 1 availed is a primary data. This is because it avails primary viewpoint of the
participants as at the given time. When the variables are scrutinised, it can be deduced that
they are a direct response from the participants prior to a breakdown by the researcher.
The data is composed of the modes of transport, location, tap on or off as well as the count
that indicate the total number of tap on/off on a location at a certain date.
The data set 2 was collected from interviewing participants and provision of questions in
some cases. The respondents to be interviewed were randomly selected from streets of
Sydney city. The major challenge faced when collecting the data was lack of adequate
resources Abd time. This limited the sample size to a value which may not represent the
actual situation of the population appropriately.
The data set majorly considered the mode of transport preferred by the different gender set.
The respondents were mainly asked to select between the four options that is bus, train,
light rail and ferry which mode they prefer to use. Each respondent was only allowed to
select one option which he/she will opt to use if presented by all the four alternatives.
1. Analysis of single variable dataset 1
a. The table below gives a summary of the modes of transport used by the NSW occupants.
Row Labels
Sum of
count
Bus 97094
Ferry 3909
light rail 1750
Train 53552
Grand Total 156305
Document Page
When this data is visually presented using a pie chart, it can be observed that;
The use of bus service was the most popular mode of transport by the occupants of
NSW. 62% of the respondents interviewed admitted to be comfortable with the use of
buses. This was followed by a 34% which preferred using trains. The other modes of
transport which includes ferry, and light rail were only preferred by 1 % of the
respondents.
62%
3%1%
34%
Total
bus
ferry
lightrail
train
To determine ways of improving the transport system in NSW it is thus necessary to
expand the road transport sector as it mostly accommodates the transport needs of the
majority of the population.
b. In the analysis above we have identified that 62% of the respondents make use of buses
as a preferred mode of transport.
To ascertain this case, we wish to verify the hypothesis that 50% of the population
prefer the use of bus as a mode of transport.
So, will begin by first setting up the hypothesis
H0 : x=50 %
H1 ;x >50 %
The parameter x is used to represent the sample population that prefer to use buses.
From here we set up the data in excel and using the data analysis tool conduct a one
tailed hypothesis test.
The result of the analysis is highlighted in the table below
Point
Sum of
count Rank Percent
1 97094 1
100.00
%
4 53552 2 66.60%
2 3909 3 33.30%
3 1750 4 0.00%
Document Page
From the table it is notable that the sum of the individuals who used the bus fall in the
region between the 66th percentile and the 100th percentile. This way we can ascertain
that the number of bus users are more than 50% of the population.
This way we have tested and ascertained our hypothesis. It can be concluded that the
data availed from the set does not support the null hypothesis that the number of bus
users are 50% of the population, we therefore reject this stance and accept the
alternative hypothesis.
From the vailed dataset it is therefore statistically reasonable to support that the
number of bus users exceed 50% of the NSW population.
Section 3: Analysis of two variables in dataset 1
The objective of this analysis is to give enough evidence to support the government decision to
construct an underground railway line from either Parramatta, Gosford or Bankstown to central.
a. The table below summarises the number of train users from the three locations
Row Labels
Sum of
count
Train 2609
Bankstown Station 1207
Gosford Station 214
Parramatta Station 1188
This data can be graphically represented as indicated below to give a visual display of the
case.
B a n k s t o w n S t a ti o n G o s f o r d S t a ti o n P a r r a m a tt a S t a ti o n
t r a i n
1207
214
1188
Train Users
Total
The data display above can be used to give guidelines to the government on the optimal
course of action.
So as to optimise the government resources as well as serve the maximum population
possible, the underground railway tunnel should be constructed from Bankstown station to
the central station. This will serve 1207 people higher than the 1188 people that will benefit
from constructing the railway from Parramatta to the Central station (Transport in Australia,
2009). In the case where the railway was to be constructed from Gosford station to the
central station the few number of train users in the region will see the train equipment’s
being massively underused hence leading to wastage of government development revenue.
tabler-icon-diamond-filled.svg

Paraphrase This Document

Need a fresh take? Get an instant paraphrase of this document with our AI Paraphraser
Document Page
b. The hypothesis test is meant to analyse the statistical mean difference between the count of
tap on and off. Considering that the variances is unknown we use the data analysis tool in
excel to conduct a two ample t test assuming un-equal variance.
The null hypothesis is that there is no statistical mean difference with the opposite
statement standing as the alternate hypothesis.
The output of the test is summarised in the table below
t-Test: Two-Sample Assuming Unequal Variances
count count
Mean
223.322580
6
90.3511904
8
Variance
7393837.70
6
15140.4788
1
Observations 496 504
Hypothesized Mean Difference 0
Df 497
t Stat
1.08799508
4
P(T<=t) one-tail 0.1385623
t Critical one-tail
1.64792531
8
P(T<=t) two-tail 0.2771246
t Critical two-tail
1.96474861
4
The test was conducted at a 5% level of significance. Given that the obtained p value is
0.277712 which is greater than 5%, will go ahead and accept the null hypothesis. We can
conclude that from the analysis, sufficient evident was obtained to support the notion that
there is no statistical difference between the count of tap on and off.
c. The NSW government should proceed and construct a tunnel from the Bankstown station to
the central station. This will optimise public service. Also, the number of tap on and off is of
no significance and should not be of any guidance when making the construction decision.
As the government do prioritise optimum public expenditure where a development project
covers the needs of the majority of the population. The railway tunnel from Bankstown to
the central station will be of optimum use as it will serve the highest population out of the
three sets of stations. Hence its statistically supported that the rout is favoured.
Section 4: Collect and analyse dataset 2
Graphical display of the male transport mode preference
Document Page
From the pie chart representation of the data 45% of the male population are in favour of using the
bus as a mode of transport. This is followed by a 32% which favours the use of trains. The light rail
attracts the smallest proportion of the male population with only 18% in favour of it.
Graphical display of the female transport mode preference
25%
31%
19%
25%
Total
Female Bus
Female Ferry
Female light rail
Female Train
Unlike the male population most of the ladies prefer the use of Ferry as their preferred mode of
transport with 31% of the respondents selecting this option. The use of bus comes second with
around 25% of the respondents opting for its use. This option attracts a similar proportion as the use
of trains which is also preferred by 25% of the sampled respondents. In this scenario the light rail
attracts the fewest users with only 19% of the sample population being in favour of it.
Section 5: Discussion and conclusion
Discussion
Several forms of transport exist in Australia though the most widely used is the road transport.
Currently the country posses at least 300 airports with paved runways. The rail transport which
accommodates a widespread commuter network. This rail transport is majorly utilised by the mining
sector rather than for commuter services.
Document Page
The road transport is a major factor in driving the economy of the country. The large area of
Australia with a low population density have made the nation heavily reliance on the road transport.
Also, the rail network is yet to be developed to accommodate freight and passenger needs within
several areas in Australia (Byrne, 2009). Due o this even goods and which might have been moved
using the rail system end up being transported by roads.
Conclusion and recommendation
In this study the focus was to analyse the transport system preferences within the NSW. This analysis
was done using the Microsoft excel software and information presented in form of visual displays.
The results of the analysis indicated that up to 60% and above of the NSW population are largely
dependent on the use of road transport. This is in line with the previous research outcomes which
rank the use of road on top of modes of transport in the country.
For the government to ease transportation of goods and people within the states there is need to
expand the road network so as to accommodate the expanding population in the cities of NSW. In
addition to directing more investments towards the road sector, there is a need to expand and
modernise the rail network so as to improve the ease of cargo movements across the region.
Based on optimal resource allocation the government is required to invest in projects which benefit
as much of the population as possible. For this reason, the railway tunnel to be constructed to assist
transport to the Central station should be done from the Bankstown station. This way the state will
have served the optimum possible population from there list of options (Porter, 2002).
The hypothesis testing has revealed no significance between the tap off and on, this means its not a
factor to be considered when selecting an appropriate infrastructure expenditure. For this reason,
the number of individuals to be served by a project should be a main factor when selecting optimal
expenditures.
tabler-icon-diamond-filled.svg

Paraphrase This Document

Need a fresh take? Get an instant paraphrase of this document with our AI Paraphraser
Document Page
References
Byrne, M. (2009, October 22). A new tanker ship for Australia. Retrieved from Letter from the
Australian Institute of Marine and Power Engineers to the Federal Minister:
www.aimpe.asn.au
Porter, L. (2002). Shipping out, and definitely not shaping up. The Age.
Transport in Australia. (2009). International Transport Statistics Database.
chevron_up_icon
1 out of 8
circle_padding
hide_on_mobile
zoom_out_icon
[object Object]